Numerical Analysis of Dynamic Mechanical Properties for Rock Sample under Strong Impact Loading

Author: Fuqiang Gao, Aijun Hou, Xiaolin Yang
Journal: International Journal of Information Engineering and Electronic Business(IJIEEB) @ijieeb
Article in issue: 2 vol.2, 2010.
Free access
Stress wave propagation effect and failure characteristic of limestone were studied by one-stage light-gas gun induced-plate impact experiment technology. The experiment results indicate that dispersion effect and attenuation characteristic exist in impacting rock. The failure of rock sample has division characteristics, which are head failure zone, middle tension-compression failure zone and tail fracture failure zone. On this basis, the dynamic mechanical response of rock target under impact loading was analyzed by LS-DYNA finite element method. Stress-time curves in different impact velocities were obtained by sensors buried in rock target. The comparative analysis of experiment and simulation show that the main reason of rock failure is the joint action of longitudinal compression wave and transverse sparse wave, and the conclusions have some significance on guiding farther dynamic mechanical experiment of rock.
Rock sample, impact loading, dynamic failure, numerical analysis
Short address: https://sciup.org/15013051
IDR: 15013051
Text of the scientific article Numerical Analysis of Dynamic Mechanical Properties for Rock Sample under Strong Impact Loading
Published Online December 2010 in MECS
Dynamic damage and its evolution law of rock under impact loading are the universal attention question for rock mechanics and blast theory research. In order to inquiry the blast theory and fragment distribution of impacted rock, it is very important to research the mechanical properties and failure characteristics of rock under impact loading. Some scholars have achieved a series of research findings in the fields of shock characteristic and theoretical model [1-12], at the same times, the impacted rock is recovered for deep analysis. At present, there are two methods for impacted rock recover, the first is soft recover method, a certain mechanical parameter is tested in this proceed and the impacted rock accumulate in light-gas gun recover device, the second is hard recover method, the rock sample is implanted in the matched rigid die for the integrity of impacted rock. It should be indicated that the hard recover method charge the boundary conditions of rock sample, the repeated loading lead to serious damage of rock sample.
Foundation project: national natural science foundation supported (50874039);
Manuscript received January 1, 2008; revised June 1, 2008; accepted July 1, 2008.
Corresponding author: Fuqiang Gao.
Most of rock structures in the process of work except undergo the static load, the often have to endure strong impact loading such as explosions, collisions, etc. Dynamic mechanical response of rock under impact loading is the basis of various structural designs. In order to explore the dynamic failure mechanism of rock, many scholars carried out the dynamic impact damage tests on rock. Gao [3] carried out the shock compression experiment on limestone and marble by one stage light gas gun, and studied the attenuation and dispersion effects of compression wave. Guo [13] used the methods of acoustic detection and split observation to study the impact damage and destruction of limestone. Ren [14] studied the wave propagation in ceramic target by DYNA program, and analyzed the failure mechanism and characteristics. In order to analyze the carrying capacity and dynamic failure of rock structure, it is necessary to research the mechanical properties of rock under impact loading.
Shock compression test and stress-time course measuring of rock sample were carried out on one-stage light-gas gun, the dynamic mechanical properties and failure characteristics of rock sample under impact loading were studied by soft recover device. On this basis, the impact process of rock was numerically simulated to analyze damage mechanism of rock sample.
-
II. Experimental Study
A. Experimental Design
Experimental researches [15-16] indicate that transverse stress deriving from impact loading is much high and the magnitude is equivalent with longitudinal pressure. Because of the interaction between hard recover device and rock sample, the failure of rock sample is not in the state of one-dimensional strain. On this base, a soft recover device is designed and compact with one-stage light-gas gun (Figure 1). Between the recover device and rock sample is full of fine sand, when the transverse stress wave movement to the interface of rock sample and sand, reflected tension shock wave will be occurred in rock sample for the higher of wave rock impedance than fine sand. So the transmission wave attenuates quickly and repeat loading don’t existence in rock sample. In order to compare the difference of soft recover experiment and ordinary impact experiment, the ordinary one-stage light gas gun experiment (Figure 2) was carried out on rock sample also.
The tests were carried out on one stage light gas gun belong to State Key Laboratory of Explosion Science and Technology in Beijing Institute of Technology. The caliber of light gas gun is 57mm, the projectile velocity changes from 20m/s to 600m/s, the maximum pressure of chamber is up to 15MPa. In the test, the impact velocity of flyer changes from 200m/s to 400m/s, the flyer is LY-12 aluminum, the diameter of flyer is 53mm, and the thickness is between 3.96mm and 4.04mm. The diameter of rock sample is 50mm, the thickness is between 3.2mm and 3.3mm, four sensors are buried in each crevice between two rock samples. In order to eliminate the effect of rarefaction wave and unloading wave, the width to thickness ratio of target is designed to be 3.1, the catch-up ratio is designed to be 4.25.
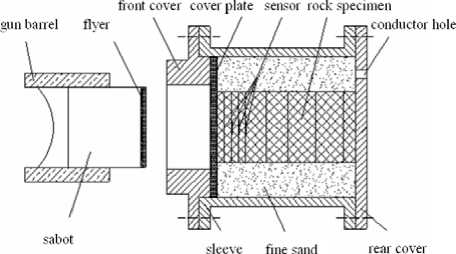
Figure.1 Schematic diagram of impact experiment and callback configuration
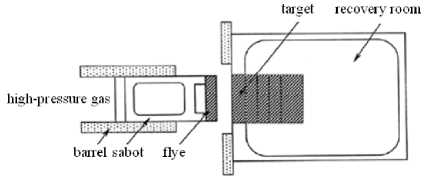
Figure.2 Schematic diagram of one-stage light gas gun experiment device
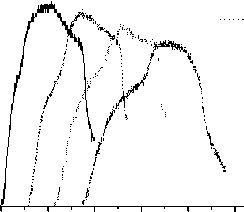
Before the test, the flyer is pasted on sabot, which will glide along the barrel when the high-pressure gas is released suddenly. A series of pressure pulses will occur in the target when the flyer collide on target in a highspeed, and the sensors buried in rock sample will record a group of voltage-time signals, it could be converted into stress-time signals by calibration coefficient. Different stress-time pulse signals could be obtained by adjusting the impact velocity of flyer. One test result by one-stage light gas gun is shown in Figure 3.
3.5
3.0
2.5
2.0
1.5
1.0
NO.1
NO.2
NO.3
NO.4
1 234567
time/μs
Figure.3 Stress-time curves in four testing locations
B. Experiment Result Analysis
From Figure 3, we can obtain the basic mechanical response of rock material: (1) the upward section of stress-time curve is smoothly and the response time is about 0.5μs ; (2) the Hugoniot elastic limit of rock material is1.7GPa ; (3) waveform have a little oscillation when stress reached maximum, which indicates that micro structure of rock material appear complicated response; (4) the amplitude decreases gradually with the spread of stress wave.
Actually, double-wave structure exists in impacting rock. The typical testing waveform of rock sample as shown in Figure 3, which indicates that the stress wave can be divided into elastic precursor wave and succeed plastic main wave. There include two reasons: the first comes from viscous of rock material, which results in the waveform flatted and divergence, the second is many inhomogeneous structure existing in rock material, because of local tensile or shear stress, the collapse, closure and extend lead to the failure of rock sample. So it can be seen that the nonlinear behavior of stress wave transmission corresponding to the nucleation and propagation of micro-crack. At the same times, the attenuation property is very significantly in rock sample, the pulse width of elastic precursor wave increases with distance, but the plastic main wave becomes narrower for the effect of unloading wave.
C. Divided Zone Feature
From the figure 4, we can know that the impacted rock sample have the divided zone feature by cutting observation method. It can be described as follows:
(1)The first is head failure zone, rock sample undergoes the maximum loading in the impact process, but the failure is not the most serious. The residual rock sample is almost conical and the diameter is the same as initial value, the height of conical is half of the diameter and increase with impact velocity.
(2)The second is middle tension-compression failure zone, rock sample undergoes the tensile-compressive loading in the impact process, the failure of rock sample is inform of bulk. The degree and range of damage increase with the impact velocity.
(3)The third is tail fracture failure zone, there are many large cracks existing in those zone and some small pieces drop from coffin comer.
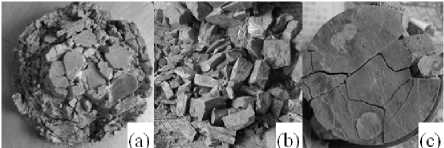
(a) head failure zone (b) middle tension-compression failure zone (c) tail fracture failure zone
Figure.4 Damage pictures of rock sample after impact test
-
III. Numerical Simulation
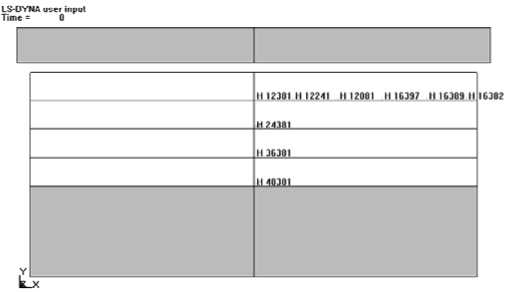
Figure. 6 Ordinary impact calculation model
A. Calculation Model
One-dimensional strain model is adopted in numerical simulation, and the calculation model and rock sample are basically the same size. The finite element method program is used to build model, solid 164 unit is used to mesh model. The constitutive of flyer is described by JOHNSON-COOK material model, and the rock sample is described by JOHNSON_HOLMQUIST_CONCRETE material model, the material model of sand is SOIL_AND_FOAM. The contact between flyer and target is AUTOMATIC_ SURFACE_TO_SURFACE contact, and the contact between rock samples is ERODING_SURFACE_TO_ SURFACE contact. The calculation unit is g - cm - µ s . The calculation model is shown in Figure 5 and Figure 6.
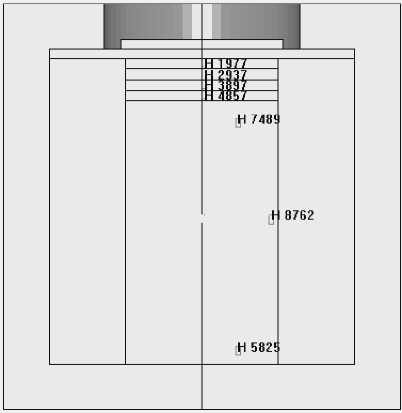
Figure. 5 Impact calculation model with soft recover experiment
B. Material Model and State Equation
The constitutive of aluminum flyer is described by JOHNSON-COOK material model and GRUNEISEN state equation in material library, and the material parameters are shown in table 1. JOHNSON-COOK material model is suitable for describing the constitutive of large deformation, high strain rate and high temperature. Yield criterion in this model can be described as flowing [17]:
σ y = ( A + B ε pn )(1 + C ln ε & *)(1 - T * m ) ( 1 ) Where ε p = equivalent plastic strain, ε & * = dimensionless strain rate respectively, T* = relative temperature, T = corresponding temperature, Troom = room temperature, Tmelt = melting temperature respectively, A , B , n , C and m are material constant.
When the material experiences impact loading, the GRUNEISEN state equation is used to describe the pressure in material:
ρ 0 C 2 µ [1 + (1 - γ 20) µ - α 2 µ 2]
[1 - ( s 1 - 1) µ - s 2 - s 3 µ + 1
µ 3 ]2 ( µ + 1)2
+ ( γ 0 + αµ ) E
( 2 )
When the material expands in loading process, the GRUNEISEN state equation can be described as follow:
P = ρ 0 C 2 µ + ( γ 0 + αµ ) E ( 3 )
where E= initial internal energy per unit volume, ρ0 = initial density of materials, C= intercept of νs~vpcurve, s1,s2,s3 are slope coefficient of νs~vpcurve, γ0 = GRUNEISEN coefficient, α = first order volume correction of γ0 and μ=ρρ0 -1 .
TABLE I. M odel parameters of aluminum material [18]
|
Density /g ⋅ cm3 |
Elastic modulus /GPa |
Shear modulus /GPa |
Poisson's ratio |
Yield strength /MPa |
Tensile strength /MPa |
|
2.75 |
70.3 |
27.5 |
0.3 |
276 |
412.7 |
Dynamic mechanical response of rock target is described by JOHNSON_HOLMQUIST_CONCRETE material model. JHC material model is suitable for the condition of large deformation, high strain and high pressure. The equivalent strength of rock material is related to pressure, strain rate and damage. The constitutive of rock can be described as follow:
ст = [ A (1 - D ) + B ( p * N )](1 - c In f) ( 4 )
D = Z
A ^ p W p D 1 ( P * + T *) D 2
( 5 )
Where де p = equivalent plastic strain, Дц p = plastic volumetric strain, D1 andD2 are material constant, T* = normalized maximum hydrostatic pressure. The failure of JHC model is described by von Mises yield criterion, and the material parameters are shown in table II.
TABLE II. M odel parameters of rock material [17]
|
Material parameters |
Parameter values |
Damage parameters |
Parameter values |
|
Density p/g x cm-3 |
2.65 |
D 1 |
0.040 |
|
Poisson's ratio μ |
0.2 |
D 2 |
1.000 |
|
Elastic modulus E/GPa |
58.8 |
^ f min |
0.010 |
|
Strength parameters |
Parameter values |
Pressure parameters |
Parameter values |
|
A |
0.79 |
P crush /GPa |
0.016 |
|
B |
1.60 |
U crush |
0.001 |
|
N |
0.61 |
K1/GPa |
85.00 |
|
c |
0.007 |
K2/GPa |
-171.000 |
|
fc*/GPa |
0.072 |
K3/GPa |
208.000 |
|
* σ max |
7.0 |
P lock /GPa |
0.800 |
|
T/GPa |
0.0052 |
U lock |
0.100 |
|
G/GPa |
20.87 |
ε & 0 |
1.0 x 10 - 6 |
C. Simulation Results Analysis on Soft Recover Experiment
The numerical simulation results of flyer plate loading and unloading are as follow as Figure 6, curves of 1977, 2937, 3897 and 4857 element are the stress-time relation in different Lagrange locations. The numerical simulation results indicate that the stress-time curves are agreement with experimental data and the decreasing tendency of stress wave is basically identical, but the attenuation velocity of peak stress in numerical simulation is slower than experiment, we believe that the error of measuring device is not considered in experimental testing. The peak stress appears a little fluctuation in numerical simulation curves, which is similar to experiment result. The phenomenon indicates that the micro-structure began to appear complicated response. The deep causes come from the collapsing of micro-damage structure. The transmission velocity of stress wave in numerical simulation is a little faster than in experiment, we believe that the impact process is a positive compression compound with lateral spare disturbance. On the base of experimental and numerical result, we include as follow:
-
(1) The first is head failure zone, although the rock sample undergoes the maximum impact loading, the transverse stress which produce in longitudinal stress is large also. Three received strength enhance the compressive strength of rock material, so there are some tensile-compressive failure in the boundary position.
-
(2) Middle tension-compression failure zone, the experimental and numerical simulation results indicate that the strength of stress wave attenuate with distance, the peak stress of 7489 element decreases from 2.9GPa to 2.2GPa, but the transverse stress exceeds 0.9GPa, as we all know, rock is a typical brittle material, so this position is the typical tension-compression failure zone.
3.0
2.5
2.0
0.5
0.0
1.5
1.0
-0.5
-1.0
0 5 10 15 20 25 30
time/μs
Figure.6 Calculated stress-time curves of soft recover experiment
(3)Tail fracture failure zone, reflected impact loading will be occurred in the face of rock sample and rear cover when stress wave run into the bottom of the sample, such as the stress time curve of 5825 element. In this zone, the compressive stress is too weak to destroy the rock sample, so this position is the typical tail fracture failure zone.
D. Ordinary Simulation Results Analysis
-
a) Comparison of stress-time curve in transverse position
2.8
2.4
2.0
0.8
0.4
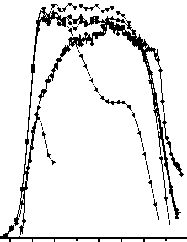
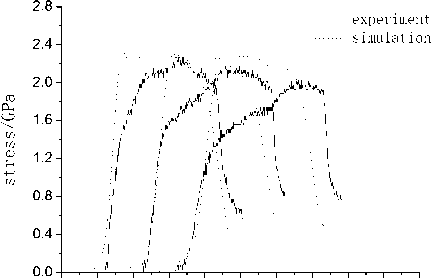
Two basic conditions should be met in plate impact experiment [19]. Firstly, the shock wave is a plane wave. Secondly, the shock wave is uniform. So in the target design, the width to thickness ratio and catch-up ratio should be considered to eliminate the lateral rarefaction wave and catch unloading waves. Figure 7 is the stress time curves of the first layer target in different positions from the center. The simulation results show that the farther away from the target center, the more obvious effect of rarefaction wave. Stress is unloaded when it has not yet reached the peak value (r = 24.4mm), it is much lower than the experimental value of the peak stress. The effect of lateral rarefaction wave will be smaller when the measuring point is placed near the center of the target. The stress will be unloaded when the unloading wave reflected from free surface of flyer, and it is closer to the experimental value. From the simulation curves, the stress becomes uniform when measuring point is placed in the circle with radius of 15.0 mm, and the pulse width is consistent with the test result. The simulation result is consistent with the experimental result in peak stress at measuring point of 20 mm, but the pulse width is smaller than experimental value. Detailed analysis shows that positive shock wave loads the point to peak stress, but it is unloaded by lateral rarefaction wave before catch-up unloading wave reaching.
1.6
1.2
-■- r=0.00mm
-•- r=5.00mm
-A- r=10.0mm
-V- r=15.0mm
-A- r=20.0mm
- ► - r=24.4mm
—•— experiment
0.0
0.0 0.5 1.0 1.5 2.0 2.5 3.0 3.5 4.0
3.5
time/μs
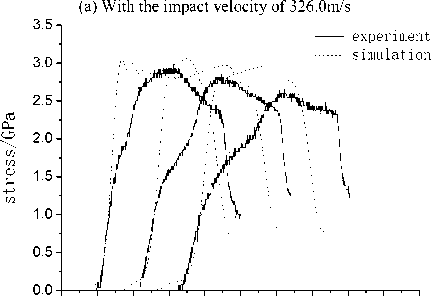
(a) With the impact velocity of 326.0m/s
3.0
2.5
2.0
1.5
1.0
0.5
-■- r=0.00mm
-•- r=5.00mm
-A- r=10.0mm
-V- r=15.0mm
-«- r=20.0mm
-»- r=24.4mm
-•- experiment
0.0
0.0 0.5 1.0 1.5 2.0 2.5 3.0 3.5 4.0
time/μs
(b) With the impact velocity of 400.5m/s
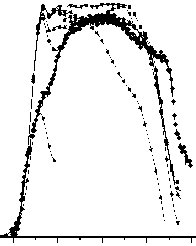
Figure 7. Comparison of simulation curves and experimental curves in transverse position
Under the strong impact loading, each material usually has elastic deformation and plastic deformation zone, and the demarcation point is the Hugoniot elastic limit. When the impact velocity is low, the elastic deformation takes place in rock sample only. The experimental waveform is standard “n” shape, and the simulation curve is consistent with experimental curve in rising edge. When the impact velocity is high, the plastic deformation takes place in rock sample, the Hugoniot elastic limit is about 1.7GPa. The simulation curve is consistent with experimental curve very well when the pressure is below the Hugoniot elastic limit. The simulation curve appears a little deviation with experimental curve when the pressure exceeds the Hugoniot elastic limit. So this material model has some deficiencies in describing plastic deformation. In the simulation curves, minor fluctuations appear in peak stress. This is consistent with experimental curve. These results indicate that the microstructure of material appears complex response, which comes from activation cracks and initial micro-hole collapse.
-
b) Comparison of stress-time curve in longitudinal position
0.0 0.5 1.0 1.5 2.0 2.5 3.0 3.5 4.0 4.5 5.0
0.0 0.5 1.0 1.5 2.0 2.5 3.0 3.5 4.0 4.5 5.0
Figure 8 is the comparison of simulation and experimental stress-time curves in three longitudinal positions. The simulation results show that the rise time of simulation curve is consistent with experimental curve very well in low impact velocity, but appears some deviation with experimental curve in high impact velocity for unrecoverable plastic deformation. The plastic deformation of rock sample becomes more and more serious with the increase of impact speed. The spacing between elastic precursor wave and plastic main wave becomes larger and larger also. That is the dispersion effect of material. For example, the width of pressure pulse changes from 1.7 μ s in first measuring point to 1.8 μ s at second measuring point, and it increases to 1.9 μ s at third measuring point in Figure 4(a). Although the simulation tests can not be good description the width of pressure pulse, but can basically reflect the growing trend. In addition, the attenuation of numerical simulation is slower than experimental value and the peak stress is slightly higher than experimental value, but the attenuation trend of shock wave is consistently. Further analysis shows that the numerical simulation is in ideal state, the test error and the effect of wave propagation are not considered in numerical simulation.
time/μs
time/μs
(b) With the impact velocity of 400.5m/s
Figure.8 Comparison of simulation curves and experimental curves in longitudinal position
-
IV. Conclusions
Stress wave propagation effect and failure characteristics were studied by one-stage light-gas gun induced-plate impact experiment technology on limestone. The results show that the dispersion effect is related to viscous and micro-structure of rock sample, and the process of peak stress attenuation is related to the energy dissipation. The failure sample can be divided by three different failure divisions that are head failure zone, middle tension-compression failure zone and tail fracture failure zone, which corresponding to different impactdamaged mechanism. The numerical simulation result is good agreement with experimental result in four testing locations, but the attenuated velocity is a little slower than real value, the main reason is that the systematic error do not considered in experiment.
In this paper, LS-DYNA finite element program was used to simulate the dynamic response of multi-storey rock target. The dynamic failure mechanism of rock sample was analyzed. The simulation results show that flyer on the collision of target is the process of a variety of stress wave interaction, and the main reason of rock failure is the joint action of longitudinal compression wave and transverse sparse wave. The results reflect the width of loading stress pulse, define the scope of sparse disturbance wave. So the material model could describe the dynamic mechanical response of rock very well. The conclusions can put forward reference on guiding farther dynamic mechanical experiment of rock.
Acknowledgment
This work is the result of collaborative research effort between Luoyang Institute of Science and Technology, Henan and Beijing Institute of Technology, Beijing. The authors wish to acknowledge the support of both universities. The authors are grateful to Luoyang Institute of Science and Technology for the financial support needed for the construction of the new test facility and the simulation program.
References Numerical Analysis of Dynamic Mechanical Properties for Rock Sample under Strong Impact Loading
- HU Gang, GAO Xinming. “Calculation range of damage parameter of limestone by definition of sound wave,” Journal of Heilongjiang Institute of Science, Heilongjiang, vol. 15, 2005, pp. 291-294. (in Chinese)
- Y. Sano. “Underdetermined system theory applied to qualitative analysis of response caused by attenuating plane waves,” Journal of Applied Physics, vol. 65, 1989, pp. 3857-3867.
- GAO Wenxue. “The response and damage model of cocks under dynamic loading,”. Beijing Institute of Technology, 1999. (in Chinese)
- Yang Jun, Gao Wenxue, Jin Qiankun. “Experiment on Dynamic Damage Property of rock and new damage model for rock fragmentation by blasting,”. Chinese Journal of Rock Mechanics and Engineering, vol. 20, 2001, pp. 320-323. (in Chinese)
- H. B Li, J Zhao, T. J Li. “Micromechanical modelling of mechanical properties of granite under dynamic uniaxial compressive loads,” International Journal of Rock Mechanics and Mining Sciences, vol. 37, 2000, pp. 923-935.
- X. Q Feng, S. W Yu. “Micromechanical modeling of tensile response of elastic-brittle materials,” International of Journal of Solids and Structures, vol. 22, 1995, pp. 3359-3372.
- D. A Fanella. “Fracture and failure of concrete in uniaxial and biaxial loading,”.J. Engng. Mech, vol. 11, 1990, pp. 2341-2362.
- Cho Sang Ho, Ogata Yuji, Katsuhiko, et al. “Strain-rate dependency of the dynamic tensile strength of rock,” International Journal of Rock Mechanics and Mining Sciences, vol. 5, 2003, pp. 63-777.
- D. E Grady, M. E Kipp. “Continuum modeling of explosive fracture in oil shale,” International Journal of Rock Mechanics and Mining Sciences, vol. 17, 1980, pp. 140-154.
- N Burlion, F Gatuingt, P. C Gilles, et al. “Compaction and tensile damage in concrete: constitutive modeling and application to dynamics,” Computers Methods in Applies Mechanics and Enginrering, vol, 183, 2000, pp. 291-308.
- T. J Holmquist, D. W Templeton, K. D Bishnoi. “Constitute modeling of aluminum nitride for large strain, high-strain rate, and high-pressure application,” International Journal of Impact Engineering, vol, 25, 2001, pp. 211-231.
- G. R Johnson, T. J Holmquist. “Response of boron carbide subjected to large strains high strain rates and high pressure,” Journal of Applied Physics, vol, 1, 1991, pp. 167-171,.
- Guo Xuebin, Xiao Zhengxue, Shi Jinjin, Liu Fusheng, and Han Yong, “Experimental study and numerical simulation on shock-damaged rock,” Explosion and Shockwaves. Mianyang, vol. 27, 2007, pp. 438-444. (in Chinese)
- Ren Huilan, “Dynamic mechanical behaviors and damage constitutive model of alumina ceramic,” Beijing Institute of Technology, Junly, 2006. (in Chinese)
- Ning Jianguo, Shang Lin, Sun Yuanxiang. “Investiaation on Impact Behavior of Concrete,” Chinese Journal of Theoretical and Applied Mechanics, vol. 38, 2006, pp. 199-208. (in Chinese)
- FAN Chun-lei, HU Jin-wei, CHEN Da-nian. “Measurement of transverse stress and determination of yield stress for OFHC copper subjected to planar shock,” Explosion and Shock Waves, vol, 28, 2008, pp. 110-115.
- T. J. Holmquist, G. R. Johnson, “A computational constitutive model for concrete subjected to larger strains, high strain rates and high pressure,” 14th international symposium ballistics, USA: American Defense Prepareness Association, 1995, pp. 591-600.
- A. M. Rajendran, D. J. Grove, “Computational Modeling of Shock and Impact Response of Alumina,” CMES, 2002, 367-380.
- Huang Zhengping, “Explosion and shock measuring technique,” Beijing: National Defense Industry Press, 2006. (in Chinese)
