О статистике астроклиматических характеристик в Саянской солнечной обсерватории

Автор: Шиховцев А.Ю., Ковадло П.Г., Киселев А.В.
Журнал: Солнечно-земная физика @solnechno-zemnaya-fizika
Статья в выпуске: 1 т.6, 2020 года.
Бесплатный доступ
В работе приводится анализ метеорологических и оптических характеристик атмосферы в месте расположения Саянской солнечной обсерватории (ССО) и будущего Крупного солнечного телескопа с диаметром зеркала 3 м (КСТ-3). Рассматриваются пространственные особенности изменений астроклиматических характеристик для ССО и Байкальской астрофизической обсерватории (БАО). Получен вертикальный профиль структурной характеристики флуктуаций показателя преломления воздуха для низкой интенсивности оптической суммарной турбулентности по лучу зрения. Получение профиля является важным результатом, поскольку даст возможность подстроить систему адаптивной оптики КСТ-3 под лучшие астроклиматические условия, когда эффективность коррекции максимальна. С точки зрения анализа вертикальных профилей характеристик оптической турбулентности, включая оценку вклада отдельных слоев атмосферы в величину изопланатического угла при минимальном уровне суммарной турбулентности, даются рекомендации для построения мультисопряженной адаптивной оптики в целом и, в частности, для КСТ-3.
Астроклимат, адаптивная оптика
Короткий адрес: https://sciup.org/142224283
IDR: 142224283 | УДК: 520.16, | DOI: 10.12737/szf-61202012
Astroclimatic statistics at the Sayan solar observatory
The paper analyzes meteorological and optical characteristics of the atmosphere at the Sayan Solar Observatory (SSO) and the future 3 m Large Solar Telescope (LST-3). We examine spatial features of changes in astroclimatic characteristics for the Sayan Solar Observatory and Baikal Astrophysical Observatory (BAO). We have obtained a vertical profile of the structural characteristic of air refractive index fluctuations for a low intensity optical turbulence along the line of sight. This profile is an important result because it will allow us to adjust the adaptive optics system of LST-3 to the best astroclimatic conditions when the correction efficiency is maximal. In order to analyze vertical profiles of optical turbulence characteristics and to assess the contribution of individual atmospheric layers to the isoplanatic angle for a minimum level of total turbulence, we give recommendations for the design of multi-conjugated adaptive optics in general and for LST-3 in particular.
Текст научной статьи О статистике астроклиматических характеристик в Саянской солнечной обсерватории
In the world and in Russia, a number of large and very large (compared to orbital) ground-based telescopes and new projects are being developed nowadays. In implementing plans of construction and modification of large high-resolution telescopes, of particular importance for their maximum efficiency is their location. A site should be considered optimal where the natural interference affecting operating modes of the telescope and reducing its performance potential is minimal.
The site for a special-purpose astronomical observatory is known to be selected according to astroclimate characteristics [Nosov et al., 2010; Panchuk, Afanas'ev, 2011] . On the one hand, the efficiency of a ground-based astronomical telescope is determined by the duration of clear sky for a year. The visibility of faint objects at astronomical telescopes and the image contrast are limited by transparency of the atmosphere and light scattering, including the night sky brightness. To achieve high resolution in long-focal-length optics and to observe the smallest image details, the main factor is the image quality statistics (defined as seeing or through the Fried radius). Moreover, the Fried radius significantly changes both at short time intervals and at long climatic intervals. Among other key macro-climatic characteristics are wind conditions and cloud cover. The site for large telescopes is selected according to fragmentary results of astroclimatic research.
Monitoring and assessment of astroclimate characteristics are of interest not only at the stage of choice of the site for a large telescope, but also directly at the site of an astronomical instrument that is under construction or operates. On the one hand, long-term observations provide a sufficiently long time series, which can be used for estimating the astroclimatic characteristics. On the other hand, observations of astronomical weather conditions, including optical turbulence, may contribute to the development of concepts of turbulence formation at different altitudes and its effect on the structure of optical radiation from cosmic light sources.
To go to a new level of experimental research in solar-terrestrial physics, the project of the National heliogeophysical complex of the Russian Academy of Sciences has been developed [Zherebtsov, 2013] . This paper deals with astroclimatic characteristics at SSO, which can be used to optimize the adaptive optics in the future LST-3 and to construct the multi-conjugate adaptive system.
ESTIMATED RATE OF
WAVEFRONT EVOLUTION AND DISTRIBUTION OF HORIZONTAL WIND VELOCITY AT A PRESSURE LEVEL OF 200 hPa
One the most important astroclimatic characteristics analyzed in many astronomical observatories of the world and describing the rate of turbulence change in the optically active atmospheric layer is the wind velocity in the upper troposphere in the jet stream zone [Bounhir et al., 2009; Chueca et al., 2004; García-Lorenzo et al., 2009; Hash et al., 2011] . It has been shown that for SSO and BAO an indicator of optical turbulence changes may be the wind velocity at a pressure level of 200 hPa V 200 at a height of ~12 km [Bolbasova et al., 2019] .
The analysis of the wind velocity at 200 hPa at SSO rests on ERA-Interium data []. As compared to the most known databases such as NCEP/NCAR Reanalysis and ERA-40, ERA Interium is based on the data assimilation system 4D-Var and contains a larger number of vertical levels both in the atmospheric boundary layer (ABL) and in the free atmosphere, with a high horizontal resolution. Table describes the most frequently used archives: NCEP/NCAR Reanalysis, ERA-40, and ERA Interium.
From ERA-Interium data with a horizontal spatial resolution of 0.125° we have obtained the annual average distribution of V 200 at SSO (Figure 1).
This is an open access article under the CC BY-NC-ND license
NCEP/NCAR Reanalysis, ERA-40 and ERA Interium
|
Archive |
Используемое horizontal spatial resolution in use, deg. |
Levels, hPa |
Period of observations |
|
Ncep/Ncar Reanalysis |
2.5 |
1000, 925, 850, 700, 600, 500, 400, 300, 250, 200, 150, 100, 70, 50, 30, 20, 10 |
1948–2019 |
|
Era-40 |
0.125 |
1000, 925, 850, 775, 700, 600, 500, 400, 300, 250, 200, 150, 100, 70, 50, 30, 20 |
1957–2002 |
|
Era-Interium |
0.125 |
1000, 975, 950, 925, 900, 875, 850, 825, 800, 775, 750, 700, 650, 600, 550, 500, 450, 400, 350, 300, 250, 225, 200, 175, 150, 125, 100, 70, 50, 30, 20, 10, 7, 5, 3, 2, 1 |
1979–2019 |
Along the X-axis are longitudes; along the Y-axis are latitudes; isolines of V 200 BAO are given, and sites of SSO are shown. Noteworthy is that the analysis of the spatial distribution of V 200 suggests that its changes depend on latitude and the mean values decrease with increasing latitude. For SSO, the average value V 200 =19.7 m/s.
Sarazin M. [Sarazin et al., 2001] has proposed a concept according to which the maximum vertical profile of V 200 is related to the horizontal transport velocity of turbulent fluctuations V 0 as follows: [García-Lorenzo et al., 2009]
V 0 = kV 200 , (1)
where k is the proportionality factor depending on the location of an observatory and taking values from 0.4 to 0.6 typical for middle latitudes. Given the mean spread of k for SSO, V 0 =7.9÷11.8 m/s.
HORIZONTAL SPATIAL DISTRIBUTION OF VERTICAL WIND VELOCITY COMPONENT WITHIN ABL FOR THE
SAYAN SOLAR OBSERVATORY
In addition to the horizontal component V200, another important characteristic is the vertical wind velocity component, which is associated with buoyancy and static stability of the atmosphere. It is important to consider this value in ABL, which makes the greatest contribution to the optical turbulence along the line of sight with the same thicknesses of atmospheric layers. Quality of astronomical images is largely determined both by vertical air flows and by their spatial variability.
Figure 2 shows the spatial distribution of the vertical wind velocity component at BAO and SSO within ABL. The analysis of the spatial distribution suggests that the observatories are in the inhomogeneous field of the vertical wind velocity component. In this case, SSO is predominantly on the periphery of the region with upward motions in ABL. This can lead to the formation of additional turbulence driven by the upward motions. Figure 2 gives us reason to believe that BAO is under the influence of the region of stable downward flows in ABL. The analysis of the spatial distribution suggests that the observatories are in the inhomogeneous field of the vertical wind velocity component. In this case, SSO is predominantly on the periphery of the region with upward motions in ABL. This can lead to the formation of additional turbulence driven by the upward motions. Figure 2 gives us reason to believe that BAO is under the influence of the region of stable downward flows in ABL, which usually cause turbulence suppression.
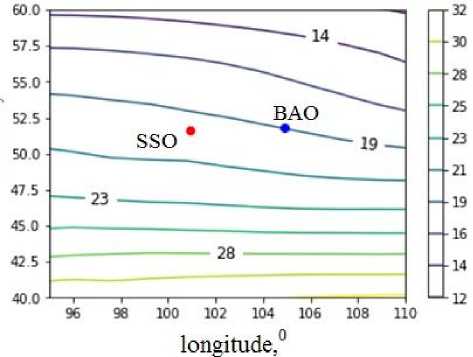
Figure 1 . Annual average distribution of wind velocity V 200 at SSO as derived from Era-Interium data. The horizontal resolution is 0.125°; the selected area for interpolation is bounded by 35° N – 65° N, 90° E – 115° E
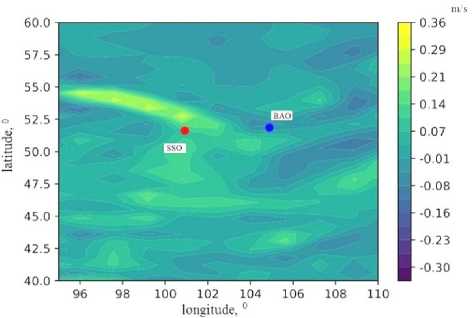
Figure 2. Annual average spatial distribution of the vertical wind velocity component at BAO and SSO. The distribution was obtained from Era Interium data. Horizontal resolution is 0.25°
CLOUD COVER AT SSO
The cloud cover analysis is of interest not only in terms of the available observation time at ground-based astronomical telescopes, but also in terms of the aerosol effect on clouds and their impact on the radiation balance of a selected site. For example, as shown in [Kabanov et al., 2019] , a significant negative tendency for the coarse-dispersion component is observed in the interannual variability of the total aerosol optical depth in the vicinity of Tomsk. Decreasing total aerosol optical depth may indicate decreasing clouds over Western and Eastern Siberia.
From Era-Interium data with the horizontal resolution of 0.125° we have obtained the annual average distribution of a normalized fraction of the total cloud cover W near BAO and SSO (Figure 3). Normalized fractions of the total cloud cover W were determined from the relation
W = W cal / W max, (2) where W cal is the calculated annual average fraction of the total cloud cover in each grid node; W max is the maxi- mum annual average fraction of the total cloud cover in the selected region. The analysis of W distribution shows that the fraction of the total cloud cover decreases from north to south.
When analyzing astroclimatic conditions, also of interest is the intra-annual variability of the total cloud cover over SSO. Increasing in some months and decreasing in others, variations in the total cloud cover may indicate the seasonal dependence of the differential contribution to the radiation balance.
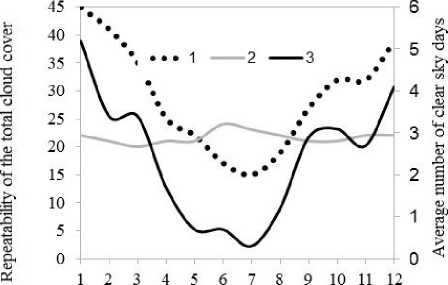
Figure 4 shows intra-annual variations in repeatability of the total cloud cover for SSO as derived from Era-Interium data for different years.
Repeatability of the total cloud cover varies considerably throughout the year. Its intra-annual variations often exhibit three peaks: in April, July–August, November. The lowest fraction is observed in January and September–October; in some months it can be ~0.3–0.4.
To compare the variations in the total cloud cover, Figure 5 shows the annual variation in the repeatability of clear sky days in terms of the total cloud cover as de-
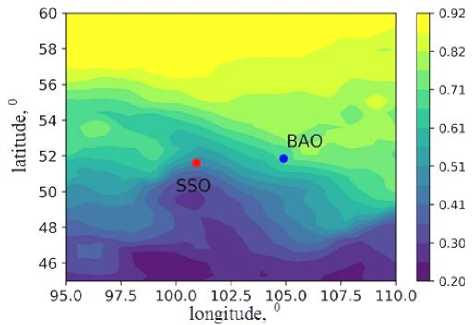
Figure 3. Annual average distribution of normalized fraction of the total cloud cover W for SSO from 2008 to 2018 as derived from Era-Interium data. The horizontal resolution is 0.125°; the selected area for interpolation is bounded by 40° N – 65° N, 90° E – 115° E termined from reference data. The central maximum in the total cloud cover (3–7 cloud amount) occurs in summer. Both the average number of full clear sky days and the average number of days with the total cloud cover up to 2 cloud amount inclusive have a minimum in summer. The annual average number of clear sky days in terms of the total cloud cover may be as large as 29; in the lower cloud cover, much larger (up to 188) with a minimum in summer months. The annual variation in the number of foggy nights, which also limit the observation, is shown in Figure 6. We can see that the increased repeatability of fogs is observed in summer when the image quality is the highest.
OBSERVATION DURATION AT SSO
The most important astroclimatic characteristic is the possible observation duration (in hours). For SSO as a characteristic of observation duration we have taken the meteorological duration of sunshine. It was calculated for different months from reference data. Annual variation of sunshine duration for SSO is shown in Figure 7.
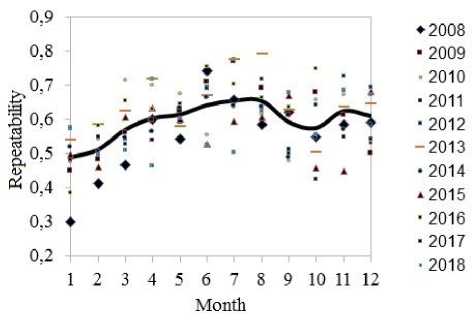
Figure 4 . Intra-annual variations in repeatability of the total cloud cover for SSO as derived from Era-Interium data for different years. Repeatability of the total cloud cover is given in dimensionless units
Month
Figure 5. Annual variation of the repeatability of clear sky days in terms of the total cloud cover: 1 – repeatability of the total cloud cover (0–2 cloud amount); 2 – repeatability of the total cloud cover (3–7 cloud amount), 3 – average number of full clear sky days (auxiliary Y-axis) for SSO
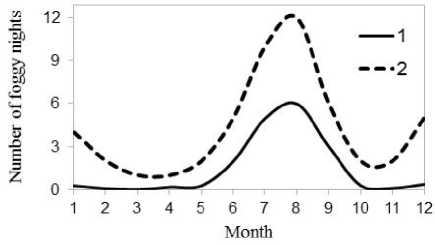
Figure 6. Annual variation of the number of foggy nights: 1 –
age energy characteristics of turbulence at different heights in the atmosphere [Shikhovtsev, Kovadlo, 2018; Shikhovtsev, et al., 2019] for small variances of air temperature fluctuations in the low-frequency range of energy spectrum, we have calculated values of the structural constant of turbulent fluctuations of the air refractive index C n 2 ( z ) according to the relation
с2(*)=
' AP (z ) . T )2 ( z )
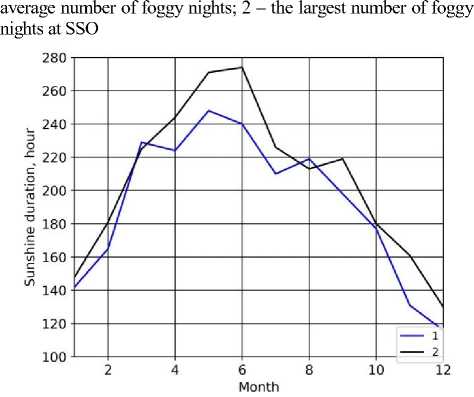
Figure 7 . Annual variation of sunshine duration: 1 – average duration of sunshine from 1956 to 1980; 2 – average duration of sunshine from 2000 to 2004 calculated for SSO
E ( ft , z ) exp
r
- 3
X
ln f + In f m f f
V J L J tL /
- 5 Г In ^
tm
0.125
5 f I 3 ,
The average sunshine duration was derived directly by calculating over the observation periods from 1956 to 1980 and from 2000 to 2004. The analysis of Figure 7 shows that the sunshine duration varies significantly throughout the year.
The highest values are observed in summer. The total duration of sunshine for SSO is 2299 hrs/year in 1956– 1980 and 2472 hrs/year in 2000–2004.
VERTICAL PROFILES
OF OPTICAL ATMOSPHERIC
TURBULENCE CHARACTERISTICS
One of the major characteristics of the optical atmospheric turbulence, the knowledge of the vertical profile of which is necessary for designing and optimizing classical adaptive optical systems (AOS) for correcting astronomical imaging and multi-conjugate optics, is the structural characteristic of turbulent fluctuations of the air refractive index.
Modern AOSs can correct images only for light atmospheric turbulence along the line of sight. In this regard, classical and multi-conjugate AOSs require information about the vertical profile of the structural constant of turbulent fluctuations of the air refractive index up to a height of ~20 km at a sufficiently high initial image quality.
By using the method of spectral estimation of aver-
where A is the constant factor; P is the atmospheric pressure at a given height z ; T is the average air temperature at this height; E ( f L , z ) is the calculated value of the spectral density of air temperature fluctuations (variance) in the low-frequency turbulence energy spectrum; f t is the frequency of change of spectrum slope from –3 to –5/3 in a low-frequency range; f tL , f tm are frequencies in the transition region of the micrometeorological range in their ascending order; f l is the highest frequency in the spectrum. It is important that in a first approximation the exponent having spectral frequencies can be considered as a coefficient slightly variable for this observatory. In this case, C n 2 ( z ) is determined by the vertical profiles of the average air temperature, air pressure, and characteristics of air temperature variance in the low-frequency spectral peak, associated with the baroclinic instability mechanism.
Ncep/Ncar Reanalysis data for 1988–2018 have been used to calculate the air temperature variance at different heights in the low-frequency spectral range and the profile of the structural constant of turbulent fluctuations of the air refractive index C n 2 ( z ) from Formula (3). Figure 8 plots the structural constant of turbulent fluctuations of the air refractive index as a function of the layer height (line 1) and J t , which gives the greatest contribution to the scintillation and isoplanatic angle of the atmospheric depth at SSO (line 2). The J t value is derived as
J, = f z 2 C „ 2 ( z ) z5,3 dz , tz 1 n
where z 1 and z 2 are determined by the vertical resolution of Ncep/Ncar Reanalysis data.
The analysis of J t variations suggests that when creating the multi-conjugate AOS for a solar telescope we should focus on the system conjugate to two remote planes — on the atmospheric layers with heights ~3–5 and 10–12 km.
According to the theory of propagation of light waves in the atmosphere, in a small perturbation approximation and for nearly vertical optical paths the scintillation index is related to the structural constant of turbulent fluctuations of the air refractive index as follows:
ct 2 = 2.24 k 7/6 J C„ 2 ( z ) z 5/6 dz ,
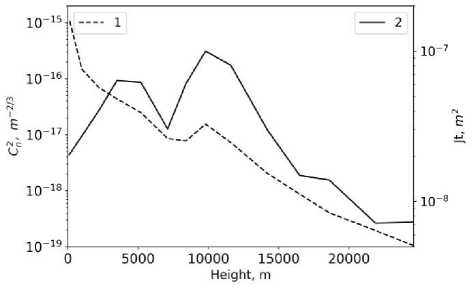
Figure 8 . Structure constant of turbulent fluctuations of the air refractive index as a function of the layer height (line 1) and Jt , which gives the greatest contribution to the scintillation and isoplanatic angle of the atmospheric depth at SSO (line 2)
The value 0 2 varies depending on the spectral composition of the turbulent fluctuations of the air refractive index and depending on the source type (the Sun twinkles due to the spatial averaging over the image).
The structural constant of the air refractive index fluctuations is proportional not only to fluctuations of the intensity of the light wave propagating in the atmosphere, which are usually associated with atmospheric irregularities at a height of ~10 km above the surface (this atmospheric layer is believed to make the largest contribution to amplitude fluctuations), but also to the isoplanatic angle, which for the nearly vertical optical paths can be derived from the formula
—3/5
e 0 = ( 2.91 k2 [ C 2 ( z ) z5/3dz ) . (6)
Using f t , determined for the entire atmospheric depth, we find that for the vertical profile С П ( z ) the isoplanatic angle θ 0 =1.86 arcsec, whereas at a wavelength of 0.5 µm the Fried radius is 8.4 cm. Using the calculated vertical profile of the structural constant of the air refractive index fluctuations for this radius, obtain that the point source scintillation index is 0.21 (Formula (5)). It is worth noting here that the small perturbation approximation holds well for ° 2 < 0.3. It is also known that the scintillation index may be 0.01–1 for stars (point source), whereas for the Sun (extended source) it significantly decreases to ~10–6–10–8. In this regard, the index estimated by the profile (see Figure 8) is within variations for the point source.
Using measurements made by a Shack-Hartmann sensor of the Large Solar Vacuum Telescope (LSVT), along with local wavefront slopes we calculated intensity distributions in subapertures. To estimate scintillations regardless of the averaging action of the light source, the following relation should hold [Tatarsky, 1967]
YL < 4LL, (7) where γ is the angular distance between two extreme beams from the object; L is the beam path length. We may assume that the measurements made with LSVT уL : JLL (within subapertures the product of the distance between the two extreme beams γ=4 arcsec and the distance to the layer L is уL~0.39 m, and VXL : 0.1 m). From this point of view, we can suppose that when observing quite compact solar objects it is possible to estimate the scintillation index. At the same time, although there is a decrease in image scintilation, it is much smaller than at full aperture.
Using the effective height z = h ef in (6) instead of z , for the visible range we can get a rough estimate of the isoplanatic angle
- 3/5
e o : K i ( ° 2 ) , (8)
where K I is the proportionality factor [Sarazin, Toko-vinin, 2001] .
Figure 9 shows frame-to-frame changes of the normalized total-over-field intensity of different areas of the solar image edge in two spaced subapertures of the wavefront sensor in the LSVT pupil plane.
For the given subapertures, the variance of the normalized total-over-field intensity varies within 7.5·10–6– 1.4·10–5 (the reduced intensity variance per 1 pixel is ~10–8). In this case, the proportionality factor in (8) differs from K I for point images.
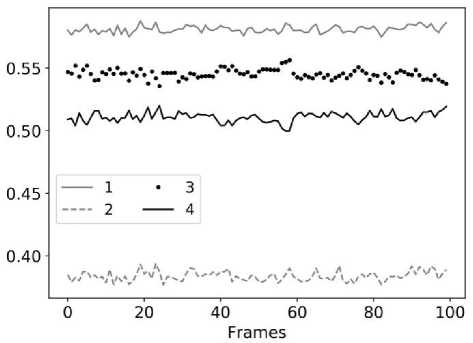
Figure 9 . Frame-to-frame changes of the normalized total-over-field intensity of different areas of the solar image edge in two spaced subapertures of the wavefront sensor in the LSVT pupil plane: 1 – the upper area of the solar image edge, reference subaperture; 2 – the lower area of the solar image edge, reference subaperture; 3 – the upper area of the solar image edge, spaced subaperture; 4 – the lower area of the solar image edge, spaced subaperture
RESULTS AND DISCUSSION
It is still crucial to characterize in detail the atmospheric turbulence, wind, and other astroclimatical parameters in order to optimize future astronomical instruments with the use of adaptive optics, in particular multi- conjugate adaptive optics. Spatial distributions of the horizontal wind velocity component at a pressure level of 200 hPa, the vertical wind velocity component within ABL, and the cloud cover indicate a high degree of spatial variability. Velocity amplitude variations are particularly pronounced in a mountainous area — at SSO. We have found that for SSO the annual average horizontal component V200 is 19.7 m/s. Given the average spread of the proportionality factor k, the expected turbulent velocity V0 is from 7.9 to 11.8 m/s. The obtained characteristic values of V0 are consistent with calculations for the Astronomical Observatory Teide [García-Lorenzo et al., 2009], for which V0 can increase up to ~18 m/s, and its characteristic values range from 3.8 to 8.2 m/s.
We have analyzed the meteorological situation and have obtained the vertical profile of the structural characteristics of air refractive index fluctuations for light integral turbulence along the line of sight at SSO. Using the vertical profile for a wavelength of 0.5 µm, we have estimated the isoplanatic angle and scintillation index.
We have shown that the scintillation index for the vertical profile of the structural characteristic of air refractive index fluctuations for the 8.4 cm Fried radius can be described by the theory of propagation of light waves in the turbulent atmosphere in the small perturbation approximation. LSVT observations of solar image scintillation indicate that estimation of the optical turbulence characteristics from amplitude fluctuations requires further research to verify the proportionality factor K I .
The results may serve as a basis for the estimation of potential operation time of a telescope, as well as for the development of multi-conjugate AOS for a solar telescope. In particular, for LST-3 we should focus on the adaptive multi-system conjugate with two remote planes spaced at distances ~3–5 and 10–12 km. Estimated positions of atmospheric layers and their influence on the optical distortion occurring in the turbulent atmosphere can serve as a basis for the development of AOSs operating in a wide field of view [Shikhovtsev et al., 2019].
This work was performed with budgetary funding of RSF No. 19-79-00061. Measurements were made in part using the Unique Research Facility Large Solar Vacuum Telescope [] under Basic Research Program II.16.
Список литературы О статистике астроклиматических характеристик в Саянской солнечной обсерватории
- Жеребцов Г.А. Национальный гелиогеофизический комплекс РАН // Всероссийская конференция по солнечно-земной физике, посвященная 100-летию со дня рождения члена-корреспондента РАН В.Е. Степанова: Тезисы докладов. 2013. С. 4.
- Кабанов Д.М., Сакерин С.М., Турчинович Ю.С. Межгодовая и сезонная изменчивость аэрозольной оптической толщи атмосферы в районе Томска (1995-2018 гг.) // Оптика атмосферы и океана. 2019. Т. 32, № 7. С. 548-555.
- Носов В.В., Григорьев В.М., Ковадло П.Г. и др. Рекомендации по выбору мест размещения наземных астрономических телескопов // Оптика атмосферы и океана. 2010. Т. 23, № 12. С. 1099-1110.
- Панчук В.Е., Афанасьев В.Л. Астроклимат Северного Кавказа - мифы и реальность // Астрофизический бюллетень. 2011. Т. 66, № 2. С. 253-274.
- Татарский В.И. Распространение волн в турбулентной атмосфере. М.: Наука, 1967. 548 с.
- Шиховцев А.Ю., Ковадло П.Г., Лукин В.П. и др. Разработка системы адаптивной оптики для крупного астрономического телескопа с контуром определения искажений на разных высотах // Всероссийская конференция "Современная звездная астрономия - 2019": Тезисы. 2019. C. 116.
- Bolbasova L., Shikhovtsev A.Yu., Kopylov E.A., et al. Daytime optical turbulence and wind speed distributions at the Baikal Astrophysical Observatory // Mon. Not. Royal Astron. Soc. 2019. V. 482. P. 2619-2626.
- DOI: 10.1093/mnras/sty2706
- Bounhir A., Benkhaldoun Z., Carrasco E., Sarazin M. High-altitude wind velocity at Oukaimeden observatory // Mon. Not. Royal Astron. Soc. 2009. V. 398, iss. 2. P. 862-872.
- DOI: 10.1111/j.1365-2966.2009.14998.x
- Chueca S., García-Lorenzo B., Muñoz-Tuñón C., Fuensalida J.J. Statistics and analysis of high-altitude wind above the Canary Islands observatories // Mon. Not. Royal Astron. Soc. 2004. V. 349. P. 627-631.
- DOI: 10.1111/j.1365-2966.2004.07523.x
- García-Lorenzo B., Eff-Darwich A., Fuensalida J.J., et al. Adaptive optics parameters connection to wind speed at the Teide Observatory // Mon. Not. Royal Astron. Soc. 2009. V. 397. P. 1633-1646.
- DOI: 10.1111/j.1365-2966.2009.15071.x
- Hash Y., Jabiri A., Ziad A., et al. Meteorological profiles and optical turbulence in the free atmosphere with NCEP/NCAR data at Oukaïmeden - I. Meteorological parameters analysis and tropospheric wind regimes // Mon. Not. Royal Astron. Soc. 2011. V. 420, iss. 1. P. 637-650.
- DOI: 10.1111/j.1365-2966.2011.20076.x
- Sarazin M., Tokovinin A. The statistics of isoplanatic angle and adaptive optics time constant derived from DIMM data // Proc. Topical Meeting "Beyond conventional adaptive optics: a conference devoted to the development of adaptive optics for extremely large telescopes". Venice, Italy. 2001.
- Shikhovtsev A.Yu., Kovadlo P.G. Estimation of mean energy characteristics of atmospheric turbulence at various heights from reanalysis data // IOP. 2018. V. 211. P. 7.
- DOI: 10.1088/1755-1315/211/1/012023
- Shikhovtsev A.Yu., Kovadlo P.G., Lukin V.P. Temporal variations of the turbulence profiles at the Sayan solar observatory site // Atmosphere. 2019. V. 10, N 9. P. 499.
- DOI: 10.3390/atmos10090499
- URL: http://ckp-rf.ru/usu/200615 (дата обращения 20 августа 2019 г.).
- URL: https://www.ecmwf.int/en (дата обращения 20 августа 2019 г.).
