On the issue of formation of development institutions in the region

Author: Uskova Tamara Vitalyevna, Selimenkov Roman Yuryevich
Journal: Economic and Social Changes: Facts, Trends, Forecast @volnc-esc-en
Section: Development strategy
Article in issue: 2 (26) т.6, 2013.
Free access
The article analyzes the region’s socio-economic position and identifies the problems hampering its development in the post-crisis period. It reveals the essence and regional experience of formation of development institutions as a tool for economic growth. The efficiency of the development institution is shown and key factors of its formation are identified in the case of the Kaluga Oblast.
Region, economic crisis, diversification, investments, development institutions
Short address: https://sciup.org/147223445
IDR: 147223445 | UDC: 330.341.2(470.12)
Text of the scientific article On the issue of formation of development institutions in the region
The global economic and financial crisis, which affected Russia’s economy at the end of 2008, caused its destabilization, the aggravation of social problems and uncertainty of prospects. By the beginning of 2009, Russia’s economy has entered a recession, accompanied by devaluation of ruble, increase in unemployment and the suspension of investment programmes.
Negative dynamics in industrial production was observed in almost all the regions of the country. The Vologda Oblast was no exception.
In 2009, due to the crisis, the region experienced a significant decrease in growth rates of physical volume of GRP – by 13% to 2008 (fig. 1) .
In terms of per capita GRP, the Vologda Oblast ranked 4th in 2008 among the regions
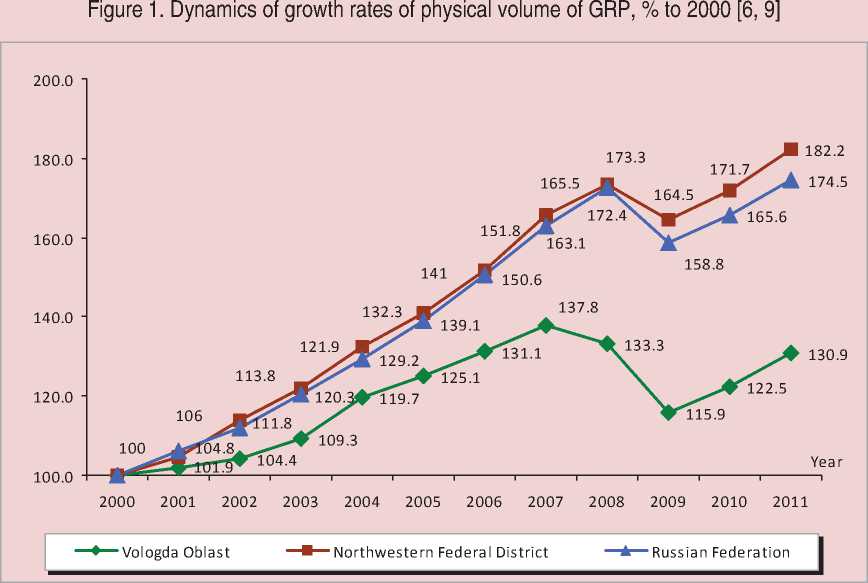
Table 1. Gross regional product per capita in the regions of the Northwestern Federal District (at current basic prices), thousand rubles [6]
One of the reasons for the current situation lies in the mono-structure of economy, i.e. its orientation toward one particular industry, which plays an important role in the creation of the oblast gross regional product (fig. 2) .
By the volume of shipped industrial products per capita, the oblast ranks 10th in Russia and 3rd among the regions of the Northwestern
Figure 2. Contribution of goods-producing industries of the Vologda Oblast to GRP, % [9]
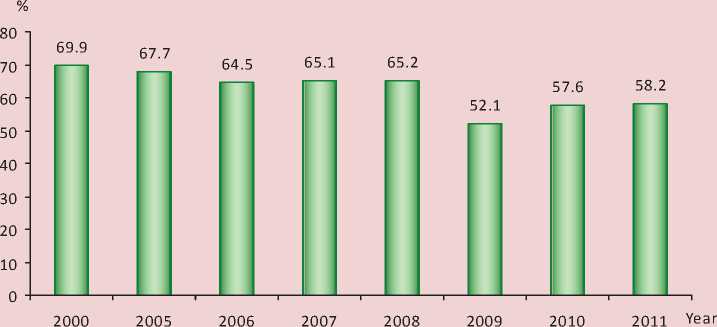
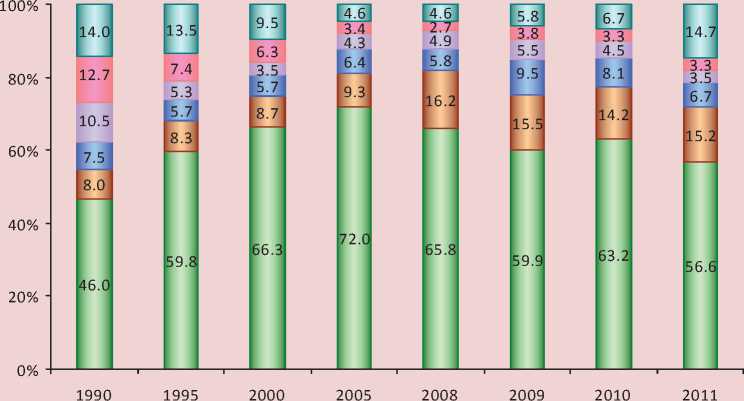
Figure 3. Commodity composition of output, shipped by the industries of the Vologda Oblast, % [10]
□ Metallurgical production □ Chemical production
□ Food production □ Mechanical engineering
□ Wood processing □ Other
Federal District (NWFD). This indicator 1.4 times exceeds the Russian average.
The oblast’s industrial sector is represented by metallurgy, chemical production, mechanical engineering, wood processing, food industry, etc. At that, metallurgical and chemical productions comprise the major part (fig. 3) . Even though, their share decreased slightly in 2011 (72%), it remains high.
The global financial crisis has shown that the development of the region’s industrial sector depends very much on the situation on the world markets, because about 30% of the goods produced in the oblast are exported (for comparison: in Russia as a whole – about 40%). Metallurgical and chemical products form the basis of export (95%).
In the early 2000s, price increase on the world markets determined the growth rates of industrial production. However, since 2008, they have declined under the crisis (95.3% to the previous year), and the situation grew even worse in 2009 (90.5%). The growth of industrial production in the region began only in 2010, but its pace slowed down again in 2011 (tab. 2) .
Decline in production had a direct impact on the financial performance of the Vologda Oblast enterprises. Due to the crisis, their revenues in the prices of 2009 reduced almost 4-fold and amounted to 20.8 thousand rubles per capita. In 2010, the oblast enterprises worked at a loss, the situation stabilized only in 2011 (tab. 3) .
Reduction of equity funds of enterprises influenced the volume of their investments in production. In the pre-crisis period, the investments in the Vologda Oblast increased most rapidly in comparison with those of NWFD and Russia. However, their decline in the region was also more substantial under the crisis. At the same time, the pre-crisis level still hasn’t been reached (fig. 4) .
It is necessary to add that the reduction of budget sufficiency also indicates the problems of the region’s economy. The crisis, affecting the financial condition of industrial enterprises, ‘undermined’ one of the main sources of budget revenues – profit tax revenues. Their volume has decreased by more than 20%, and the oblast has shifted down to the 9-th position
Table 2. Industrial production index of NWFD regions in 2001 – 2011 (in % to the previous year) [9]
|
Region |
2001 |
2005 |
2007 |
2008 |
2009 |
2010 |
2011 |
2011 to 2000, % |
|
Kaliningrad Oblast |
110.1 |
127.4 |
114.4 |
101.8 |
95.3 |
117.0 |
118.0 |
559.9 |
|
Leningrad Oblast |
104.78 |
108.1 |
102.8 |
101.0 |
96.9 |
113.8 |
106.2 |
317.7 |
|
Arkhangelsk Oblast |
98.85 |
117.3 |
107.0 |
105.5 |
115.4 |
102.1 |
82.1 |
267.9 |
|
Saint Petersburg |
106.97 |
105.7 |
110.1 |
103.6 |
83.4 |
109.4 |
113.8 |
219.8 |
|
Novgorod Oblast |
104.8 |
108.3 |
106.4 |
102.3 |
87.7 |
113.9 |
110.0 |
185.4 |
|
Pskov Oblast |
105.2 |
98.7 |
108.0 |
105.1 |
89.6 |
116.9 |
109.8 |
180.5 |
|
Komi Republic |
108 |
104.1 |
106.3 |
102.9 |
98.3 |
100.4 |
104.3 |
147.6 |
|
Vologda Oblast |
96.9 |
106.5 |
104.9 |
95.3 |
90.5 |
111.1 |
104.6 |
146.1 |
|
Republic of Karelia |
98.8 |
118.7 |
116.0 |
97.0 |
78.5 |
110.2 |
99.4 |
143.7 |
|
Murmansk Oblast |
101.1 |
100.2 |
98.2 |
94.6 |
96.5 |
105.2 |
98.7 |
105.3 |
|
NWFD |
103.7 |
108.5 |
106.9 |
100.6 |
92.6 |
108.4 |
105.5 |
205.1 |
Table 3. Balanced financial result of the performance of large and medium-sized enterprises of NWFD regions per capita, thousand rubles (in current prices) [9]
|
Territory |
2000 |
2005 |
2007 |
2008 |
2009 |
2010 |
2011 |
2011 to 2000, times |
|
Komi Republic |
13.9 |
25.3 |
21.7 |
28 |
39.6 |
63.1 |
105.8 |
7.6 |
|
Saint Petersburg |
6.4 |
13.6 |
50.2 |
58 |
57.2 |
71.6 |
100.1 |
15.6 |
|
Murmansk Oblast |
12.5 |
16.8 |
42.5 |
39.4 |
37.9 |
50.2 |
51.8 |
4.1 |
|
Leningrad Oblast |
6.1 |
24.4 |
29.6 |
34.6 |
27.3 |
37.6 |
38 |
6.2 |
|
Arkhangelsk Oblast |
5.3 |
9.9 |
3.4 |
-0.4 |
19.9 |
25.9 |
36.8 |
6.9 |
|
Republic of Karelia |
4 |
15.5 |
10.6 |
10.6 |
-5.1 |
21.9 |
28.3 |
7.1 |
|
Vologda Oblast |
22.2 |
43.1 |
50.9 |
79.4 |
20.8 |
-18 |
23.9 |
1.1 |
|
Kaliningrad Oblast |
4.4 |
11.3 |
7.1 |
7.8 |
5.4 |
23.8 |
20.3 |
4.6 |
|
Pskov Oblast |
1 |
0.9 |
2.1 |
2.1 |
1.6 |
3.3 |
1.5 |
1.5 |
|
Novgorod Oblast |
3.9 |
11.5 |
16.6 |
20.8 |
37.2 |
25.5 |
-10 |
-2.6 |
|
NWFD |
7.9 |
17.5 |
31.7 |
41.9 |
33.7 |
42.2 |
56.7 |
7.2 |
|
Russian Federation |
8.1 |
22.5 |
28.3 |
31.2 |
30.6 |
44.3 |
49.9 |
6.2 |
-
Figure 4. Index of physical volume of investments in fixed capital (in constant price terms, in % to 2000) [9, 10]
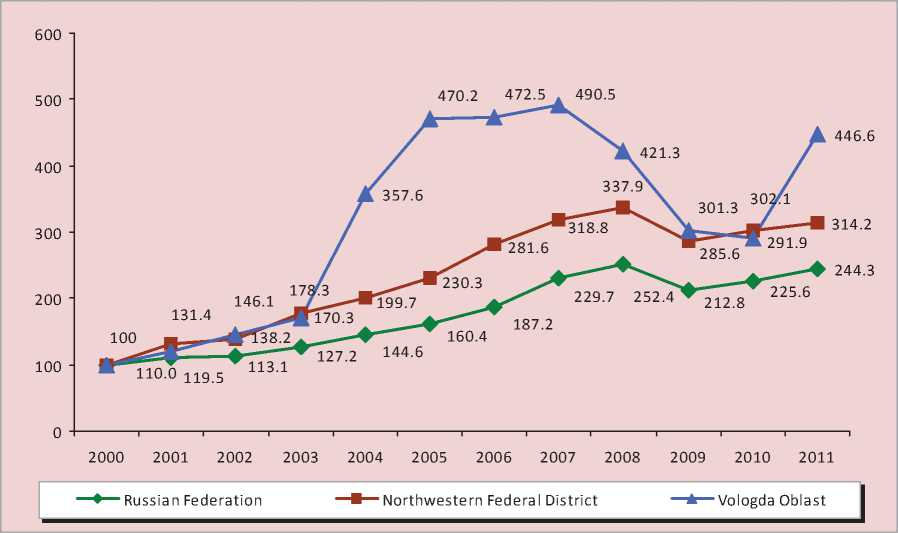
Table 4. Execution of consolidated budget in NWFD regions by incomes per capita (thousand rubles in current price terms) [9]
Therefore, the structure of the industry dominated by metallurgical and chemical production, the dependence of the region’s economy on a few large enterprises (in particular, OAO Severstal and the group of companies PhosAgro AG) are among the destabilizing factors of the economy.
Obviously, in these circumstances, the tasks of economy diversification, innovation development, establishment of advanced industrial and social infrastructure as the basis for economic growth and enhancement of population’s life quality require urgent solving.
However, they are impossible to be handled in the conditions of the regional budget deficit. At the same time, the attraction of private and foreign investments is impeded by high risks and long-term payback. The mechanism that will help to solve the problems of economic development and diversification and to enhance the efficiency of using the country’s resources is to be found in specialized organizations with state participation – the institutions of development.
It is considered that development institutions are structures designed to accumulate financial resources and direct them to the development of promising economic sectors, introduction of innovations, implementation of important infrastructural and social projects. In fact, development institutions are a tool of direct government participation aimed at promoting certain industries (or regions) in the cases, when market-based instruments are inefficient.
At present, there are a lot of development institutions in the world (about 750), most of them are united into development banks. They played a significant role in the development of such big countries as Germany, Japan, China, Italy, India and Brazil. This proves that market methods are not efficient enough to achieve the optimal economic development. Development institutions are especially effective and useful in the conditions of recovery, reconstruction and modernization of economy, when it is necessary to concentrate resources on the solution of priority tasks. Russia’s economy is currently in such a state [3].
It should be noted that the formation of development institutions in Russia took place in 2006 – 2008. In January 2006, the Eurasian Development Bank was established by the Russia – Kazakhstan intergovernmental agreement. Russian Venture Company, the Russian Investment Fund for information and communication technologies and JSC Special Economic Zones were established in the same year. The Russian Corporation of Nanotechnologies and the Fund of assistance to reforming housing and communal services started their work in 2007, and Vnesheconombank, which took over Roseximbank and Russian Development Bank, was reorganized into the state corporation ‘Bank for Development and Foreign Economic Affairs’. The Russian Housing Development Foundation (the RHD Foundation) was the latest one, established in 2008.
Development institutions are being created also at the regional and local levels. Some of them are the subsidiaries or associated partners of federal structures: for example, regional venture funds of Russian Venture Company and corporations for the development of individual regions (special economic zones, technology parks), local funds for support of small business [8]. We can conclude that, at present, the system of development institutions is being formed in Russia (fig. 5) .
Regional development corporations (agencies), i.e. the nongovernmental structures operating at the intersection of governmental and business interests and preparing the chosen territories for the launch of certain projects, are an efficient tool of regional policy widely spread in developed countries [11].
It is known that these structures were created in the Kaluga, Rostov, Penza, Volgograd, Ulyanovsk, Samara, Yaroslavl and Vologda oblasts. However, only one is actually working – the Kaluga Oblast Development Corporation, which is established on the basis of industrial parks (IP), united into the automotive cluster. For the period of 2008 – 2011, the volume of attracted investments in the Kaluga Oblast has reached 2.7 billion U.S. dollars, and the total portfolio of agreed investment projects has exceeded 4.5 billion U.S. dollars [4]. At the same time, at the initial stage (2007), the creation of infrastructure facilities for the projects implementation was subsidized from the budget funds. But soon a new mechanism was found. In addition to budget subsidies, it includes the attraction of borrowed funds under
-
Figure 5. The system of regional development institutions
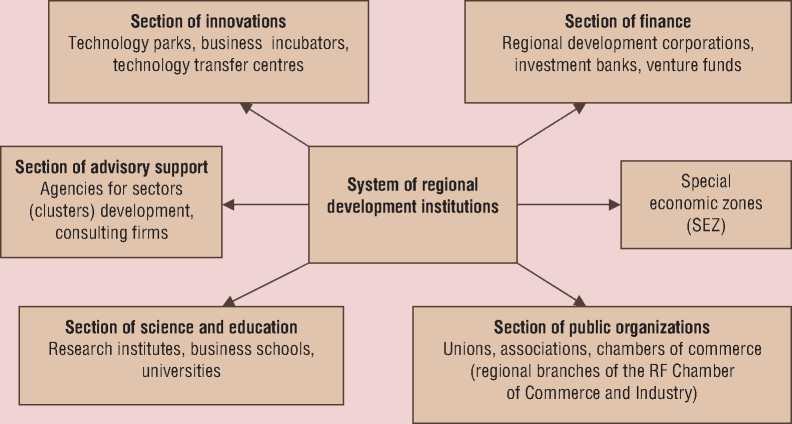
Table 5. Volume of funding allocated to land use and infrastructure engineering in industrial parks, million rubles [4]
In 2008 – 2011, the Corporation, at the expense of loan funds and the authorized capital, carried out a complex of works on land use and infrastructure engineering in the industrial parks ‘Rosva’, ‘Kaluga-South’, ‘Vorsino’, in the technopark ‘Grabtsevo’ (tab. 5) .
Due to the creation of an integrated industrial platform, cornerstone investors were attracted and a wide range of investment projects was implemented (tab. 6) .
The Corporation’s development is characterized by the attraction of the total volume of investments from industrial parks’ residents in the amount of 80 billion rubles, while the investments spent on the industrial platform slightly exceeded 6.6 billion rubles. The direct multiplicative effect is about 12 rubles of investors’ funding per 1 ruble of the Corporation’s expenses. Over 11 thousand new jobs have been created in the framework of the investment activity, the number of people employed in the region’s economy in 2011 amounted to 480 thousand people and unemployment rate was 31 thousand people. The total volume of tax revenues to the Kaluga Oblast consolidated budget from the Corporation’s activities for the period from 2007 to 2012 exceeded 6.5 billion rubles, or approximately 4% of the total tax revenues of the budget for these years [4].
Table 6. List of implemented investment projects in the Kaluga Oblast industrial parks [4]
|
Name of the park |
Investment project |
Economic results |
|
Industrial Park ‘Rosva’ Funding – 3 billion rubles |
Peugeot Citroen Mitsubishi Automobiles Rus launched SKD assembly on March 23, 2010. |
73 thousand motor vehicles were manufactured, 1200 new jobs were created. |
|
General Electric launched its power installations repair plant on November 8, 2010. |
59 new jobs were created. |
|
|
Industrial Park ‘Grabtsevo’ Funding – 2.5 billion rubles |
CKD assembly room was launched at the Volkswagen plant in October 2009. Currently, Volkswagen cars are manufactured using complete production cycle. |
340 thousand motor vehicles were manufactured. 6100 new jobs were created. |
|
Such companies as Magna (bumpers, front-end modules), Visteon (spare parts for cars’ interior), Benteler (suspension parts) launched their productions in 2010. |
Data is not available. |
|
|
Industrial Park ‘Kaluga-South’ Funding – 0.15 billion rubles |
Volvo Truck plant was launched in January 2009. |
5.3 thousand motor vehicles were manufactured. The number of new jobs at the plant reached 750. |
|
Industrial Park ‘Vorsino’ Funding – 0.8 billion rubles |
L’Or e al cosmetic factory was launched on September 23,2010. KT&G launched its tobacco processing plant on October 8, 2010. YAPP launched its plant in 2011. |
Over 2 thousand new jobs were created, over 20 billion rubles of foreign investments were attracted. |
Thus, the establishment of the regional development institution gave a new impetus to the development of the Kaluga Oblast economy and allowed the regional authorities to influence the territory’s development trends more efficiently. This experience is especially relevant for the cities and territories that depend too much on the state of affairs in a certain industry, and sometimes in one particular enterprise.
Thus, a comparative assessment of the main socio-economic indicators in the Kaluga and Vologda oblasts indicates that, during the crisis, the economic recession in the Kaluga Oblast was less significant than that in the Vologda Oblast (tab. 7) .
Besides, the Kaluga Oblast development indicators, due to the diversification of its economic structure over the period of the Corporation’s functioning, significantly exceeded those of the Vologda Oblast.
It should be noted that the idea of economy diversification and enhancement of the region’s economic growth through the creation of development institutions found support in the Vologda Oblast as well. However, this institution in the region is at its initial stage – it was created in 2012. During the Corporation’s functioning, a portfolio of potential investors and projects has been formed, the decisions have been made to remove administrative and legal barriers for speeding up the preparation of necessary documentation, production platforms have been designed on the basis of the Industrial Park ‘Sheksna’ in Sheksninsky District of the oblast [5].
At the same time, the key factors of investment attractiveness and competitive advantages of the territory are a necessary condition for the success of the Vologda Oblast Development Corporation. These factors include the strong dominant sector of the economy (metallurgy and chemical industry); developed agriculture, food industry and timber complex that have a high clustering potential; the presence of natural resources in significant amounts (land, water, forest, etc.); the advantageous geopolitical position (proximity to Moscow and Saint Petersburg, a large consumer base within the range of 500 km); developed transport infrastructure (railroads and motorways, the Volga-Baltic Waterway, Europe-Asia air corridor).
Besides, the advantageous geopolitical position, financial support from the federal centre and the presence of cornerstone investors became the crucial factors for the Kaluga Oblast (tab. 8) .
Table 7. Main socio-economic indicators [9]
|
Region |
2007 |
2008 |
2009 |
2010 |
2011 |
2011 to 2006, % |
|
Indices of physical volume of GRP, in % to the previous year |
||||||
|
Kaluga Oblast |
112.6 |
115.8 |
93.6 |
110.1 |
112.9 |
151.7 |
|
Vologda Oblast |
105.1 |
96.7 |
87.1 |
105.7 |
106.9 |
100 |
|
Industrial production indices, in % to the previous year |
||||||
|
Kaluga Oblast |
110.7 |
122.9 |
94.7 |
144.9 |
125.6 |
2.3-fold |
|
Vologda Oblast |
104.9 |
95.3 |
90.5 |
111.1 |
104.8 |
105.3 |
|
Indices of physical volume of investments in fixed capital, in % to the previous year |
||||||
|
Kaluga Oblast |
163.5 |
159.9 |
83.6 |
116.4 |
85.7 |
2.2-fold |
|
Vologda Oblast |
103.8 |
85.9 |
71.5 |
116.1 |
153.4 |
113.5 |
|
Indices of changes in average annual number of persons employed in the economy, in % to the previous year |
||||||
|
Kaluga Oblast |
100.3 |
100.5 |
99.9 |
99.8 |
100 |
100.5 |
|
Vologda Oblast |
100.5 |
99.6 |
97.4 |
100.5 |
98.6 |
96.6 |
|
Indices of changes in consolidated budget revenues (by the tax on the profit of organizations), in % to 2007 |
||||||
|
Kaluga Oblast |
100 |
142.4 |
88.2 |
203.9 |
204.9 |
- |
|
Vologda Oblast |
100 |
139.7 |
30.8 |
68.9 |
76.8 |
- |
|
Consolidated budget revenues, million rubles |
||||||
|
Kaluga Oblast |
25679.1 |
32085 |
31142 |
38596.5 |
45348.3 |
1.8-fold |
|
Vologda Oblast |
39398.5 |
50823.5 |
40127.3 |
46174.5 |
50693.3 |
1.3-fold |
Table 8. Key factors of formation of the Kaluga Oblast Development Corporation [4]
|
Factor |
Characteristic |
|
Macroeconomic |
High indicators of GRP per capita, etc. |
|
Geopolitical |
Proximity to Moscow 20% of Russia’s population within the range of 400 km |
|
Managerial |
Firm commitment of the Governor and Administration Support during the project construction, assistance in communication and coordination with monopolies |
|
Infrastructural |
Presence of industrial parks and developed infrastructure |
|
Financial |
Support of the federal centre by loan resources of VEB and EBRD |
|
Cluster |
Presence of other enterprises in the same segment Efficient chain of suppliers for the automotive cluster Focus of the oblast Administration on the promotion of the clusters: automotive, pharmaceutical, FMCG |
|
Privileges |
A number of tax concessions (property tax exemption, low rate of profit tax) |
|
Ratings |
Stable FITCH and Expert RA credit ratings |
|
Cornerstone investors |
Presence of cornerstone investors (Western companies): VW, SAB Miller, etc. |
In our opinion, the Vologda Oblast Development Corporation should have been created much earlier, when the inter-regional competition for potential investors and financial resources of the federal centre was just beginning to unfold. However, the region’s experience proves that these structures are able to create the conditions for accelerated economic growth of the territory. In this respect, we believe that the establishment of a regional development institution can become the key factor in the diversification of the oblast economy, in addition, it will reduce the gap in economic growth, and restore its budgetary sufficiency.
At the same time, the establishment of such a Corporation is not the only tool promoting the territory’s development. The forecast and regulation of the country’s spatial development should be oriented toward the territories of priority development. This orientation should become an important feature of the regional policy of the federal centre. The areas of priority development can comprise transport and logistics hubs, areas of industrial and agricultural development, the zones of innovation development, zones of advanced technologies development, tourism, resort and other recreational zones, cultural and natural landscapes [1]. Government authorities should expand the range of the region’s development tools, providing the solution to the complex problems of the territories.
References On the issue of formation of development institutions in the region
- Ilyin V.A., Uskova T.V. Methods of overcoming the spatial socio-economic differentiation. Federalizm. 2012. No. 3 (67). P. 7-18.
- Ilyin V.A., Povarova A.I. Problems of execution of the territorial budgets of the Russian Federation in 2011. Ekonomika. Nalogi. Pravo. 2012. No. 5. P. 87.
- Development institutions as an instrument of implementation of the investment policy of the state. JSC Regional Fund -the development institution of Bashkortostan Republic. Available at: http://regfondrb.ru
- Official website of the Kaluga Oblast Development Corporation. Available at: http://invest.kaluga.ru
- Official website of the Vologda Oblast Development Corporation. Available at: http://www.invest35.ru
- Official website of the Federal State Statistics Service. Available at: http://www.gks.ru
- Petrikova Ye.M. Development institutions as the factors of economic growth. Economic portal. Available at: http://institutiones.com/general/1180-instituty-razvitiya.html
- Russian development institutions: regional aspect. Available at: http://raexpert.ru/researches/regions/ros_evolution/
- Regions of Russia. Socio-economic indicators. 2011: statistical digest. Moscow: Rosstat, 2012.
- Statistical yearbook of the Vologda Oblast. 2011: statistical digest. Vologda: Vologdastat, 2012.
- Uskova T.V. Managing sustainable development in the region: monograph. Vologda: ISEDT RAS, 2009.
- Uskova T. Public-private partnership as a mechanism of economic modernization. Vykonnost’ podniku. 2012. No. 2. P. 107-113.
