On the necessity to develop models of optimal conditions for the formation and implementation of demographic attitudes

Author: Shabunova Alexandra A., Rostovskaya Tamara K.
Journal: Economic and Social Changes: Facts, Trends, Forecast @volnc-esc-en
Section: Theoretical issues
Article in issue: 4 т.13, 2020.
Free access
The article represents the conceptual foundations of a unique interregional study on the population’s demographic behavior based on a sociological monitoring “Demographic well-being in Russia”, the key points of its methodology are described here, and a range of possibilities for analyzing sociological data is shown as well. The purpose of this paper is to define a comprehensive methodology that not only allows identifying individual practices of the population’s demographic behavior and the information field of its formation but also makes it possible to develop a model of optimal conditions for the formation and implementation of demographic attitudes. The relevance of this work is caused by the necessity to timely receive complete, scientifically justified data on the state and determinants of demographic development of Russian regions and the efficiency of demographic policy; in particular, while implementing the national project “Demography”. The theoretical foundations of the presented research take into account the institutional and evolutionary concepts of demography, sociology, economics, and philosophy in relation to its object - the population’s demographic behavior - implemented in a sociodemographic approach that defines the demographic behavior of the population as a set of demographic attitudes (ideas) and actions that result in the acquisition of demographic status relative to childhood, marital status, health status, and territory of residence. The uniqueness of the monitoring is an opportunity to assess demographic behavior in the cohesion of its types (reproductive, matrimonial, self-preservatory, migration), as well as the efficiency of the demographic policy. The authors describe options of analyzing demographic behavior, such as cross-analysis of components and determinants of the demographic behavior, search for territorial features of socio-demographic processes and its regulation, and determination of the characteristics of the population’s socio-demographic groups. The results of the first wave of this monitoring allow getting a detailed picture of a current demographic situation, provide ample opportunities for obtaining and analyzing information, and it will become a foundation for determining directions of an in-depth research and a search for ways and mechanisms to adjust Russia’s socio-demographic policy. All-Russian nature of the study contributes to a balanced approach to an analysis and adjustment of the situation in the regions, which is extremely important because it will make it possible to take into account regional specifics and identify successful practices. As the result, a model of conditions may be created. In it, demographic attitudes and real behavior patterns, which lead to the results determined by the country’s demographic policy, are formed.
Demographic development, population's demographic behavior, monitoring
Short address: https://sciup.org/147225479
IDR: 147225479 | UDC: 314 | DOI: 10.15838/esc.2020.4.70.2
Text of the scientific article On the necessity to develop models of optimal conditions for the formation and implementation of demographic attitudes
Demographic development of Russia from a point of view of national security is a key sphere of public governance. Population’s quantitative and qualitative parameters determine labor, innovation, and economic potential of a country. Understanding of the demographic issue priority is evidenced by the activation of policies concerning birth support and strengthening of public health after the Address of the President of the Russian Federation to the Legislative Assembly in 2006. The success of the demographic policy and the efficiency of new measures to support families with children brought quite significant results: by 2013, the natural population growth was achieved, and the net reproduction rate increased to 0.81 (from 0.62 in 2006). Implemented measures were supported by families wishing to have two or more children, and it promptly stopped the collapse of the population in the last demographic wave [1; 2]. However, after 2016, the demographic situation in the country began to deteriorate again. Today, the national project “Demography” is being implemented in the Russian Federation, but the prospects for its implementation are ambiguous, and many scientists predict depopulation1 [3] and argue that the resources for increasing the population are insufficient, if not exhausted. In this regard, an issue of obtaining operational comprehensive information about trends and determinants of demographic development, taking into account existing territorial differentiation of processes, including its usage in the preparation and management decisions within the framework of the national project “Demography” becomes relevant.
In modern conditions, impact of the behavior factor, population’s demographic behavior specifically, in the determination of demographic processes increases. Thus, fertility parameters are largely determined by demographic (reproductive, marital) and health-preserving attitudes, toward one’s own reproductive health too. Morbidity and mortality parameters largely depend on an attitude of each person toward their own health, the implementation of healthy lifestyle practices or destructive habits; so it is important to study population’s self-preservation behavior based on an analysis of statistical information and data from sociological studies. Demographic parameters of territories may also be significantly affected by population migration, which, in turn, depends on migration mobility.
In recent decades, there has been a significant transformation of population’s reproductive behavior: practice of pregnancy planning [4] became widespread, medium-sized reproductive attitudes (focus on the birth of 3–4 children) changed to small-sized (about 60% of Russians are focused on 1–2 children) [5], average age of childbearing increased (mothers’ age at the first birth was 19 in the 1990s to, in the 2000s – 27) [6]. At the same time, norms of marital behavior changed which resulted in a wide spread of cohabitation as a form alternative to formal marriage, or as relations that precede the registration of a partnership (40% of Russians think that it is necessary “to live together” before the first marriage; in case of the second marriage – 60%), the increase of marriage age (from 19 to 25 years for women and from 23 to 27 for men in comparison with the mid-1990s) [7].
The orientation of the country’s population toward fewer children, “ageing” of marriage and motherhood will have a noticeable impact on the birth rate2.
The parameters of the self-preservation behavior, on the contrary, change slightly, and destructive practices are common. It increases the risks of achieving goals set in the national project: in particular, an objective of increasing healthy life expectancy to 67 years by 2024.
Search for methodology and techniques, which will allow synthesizing statistical indicators of changes in population number and social studies of socio-cultural, socio-economic, and socio-political conditions of population’s demographic attitudes in different Russian regions, raises a whole layer of research questions. For example, what mechanisms of sociodemographic policy operate efficiently at the federal, regional, and municipal levels, and which ones will not lead to the achievement of goals; how well is population informed about measures of children birth support; what factors influence a decision to give birth to the second and subsequent children; what difficulties do families face while giving birth to children, and, most importantly, what are the differences and its reasons in the implementation of demographic behavior of various generations and socio-demographic groups. Registration of differences in the demographic behavior, practices, culture, and motivation among various age groups is a relevant theoretical problem that helps fix the mechanisms of changing demographic behavior, and it will allow forecasting trends and develop recommendations for development of socio-demographic policy.
In order to implement this task, it is necessary to obtain empirical data for the description and classification of different generations’ demographic practices, to identify the factors, resources, problems, and the results of socio-demographic policy implementation at different historical stages in the USSR and the RF, as well as to conceptualize obtained results which will allow developing recommendations on the adjustment of socio-demographic policy measures, including maximizing the efficiency of the national project “Demography”.
In modern Russia, demographic policy is formed in a contradictory research field. A debate about the qualitative interpretation of demographic dynamics and the management of demographic development between scientific schools actively continues [8; 9]. We share the position of a reasonable influence on controlled factors of demographic development for the purposes of national security and population’s well-being. In particular, this factor is the demographic behavior, the contribution of which to population’s reproduction and health is difficult to overestimate.
The purpose of this article is to define a comprehensive methodology that not only allows identifying individual practices of population’s demographic behavior and the information field of its formation, but it also makes it possible to develop a model of optimal conditions for the formation and implementation of demographic attitudes.
Theoretical and methodological basis of the research
The object of our research is population’s demographic behavior and demographic attitudes as its element and determinant, an interdisciplinary category that is studied within sociology, demography, and psychology.
Demographic attitudes represent the readiness to implement specific actions, and it is a significant predictor of population’s demographic behavior as a whole.
Given variability, determination, and mechanism of demographic behavior that we are interested in, it is important to understand socio-economic context and its dynamics, socio-cultural nature of the object.
The research is based on the works, which reveal the mechanisms of social change, transformation of social behavior and culture, from such authors as K. Marx and F. Engels (change of socio-economic formations), F. Giddings, A. Comte, Ch. Cooley, K. Mannheim, M. Mead, P. Sorokin, G. Tarde, P. Sztompka, etc. Social changes as a reaction to the tension of institutional systems are studied by E. Durkheim, T. Parsons, N. Smelser, H. Spencer. Within the integrated approach, implemented in the works of P. Bourdieu, A. Giddens, etc., social changes act as the result of an individual’s activity and external changes of the institutional system. Based on the institutional theory, the resources for implementing socio-demographic policies are also assessed (M. Abolafia, N. Biggart, F. Block, K. Polanyi, V.V. Radaev, N. Fligstein, M.A. Shabanova, etc.) Among Russian authors dealing with social changes and modernization processes in the RF, there are L.E. Vostryakov, Z.T. Golenkova, N.I. Lapin, Ju.A. Levada, V.S. Magun, N.M. Rima-shevskaya, Zh.T. Toshhenko, M.F. Chernysh, A.E. Chirikova, O.I. Shkaratan, V.A. Yadov, etc. The usage of conceptual schemes for studying the essence of human and social capital, considered as the actor resources, is promising (G.S. Becker, P. Bourdieu, M. Granovetter, T. Moliterno, R. Putnam, R. Ployhart, F. Fukuyama).
Methodological matrix of the research is based on the works of Russian demographers where the reasons of the evolution of childbearing norms are revealed, the types of demographic behavior are classified (A.I. Antonov, V.N. Arhangel’skiy, R.I. Akjulov, E.I. Akjulova, A.G. Vishnevskiy, etc.), trends of changes of the RF socio-demographic policy are studied (V.N. Arhangel’skiy, N.V. Zvereva, A.G. Vishnevskiy, V.A. Gorshkov, G.I. Klimantova, L.I. Kravchenko, N.M. Rima-shevskaya, etc.), and the role of family and education institutions in the formation of value attitudes is defined (M.K. Gorshkov, O.V. Kuchmaeva, T.K. Rostovskaja, L.I. Savinov, A.B. Sinel’nikov, T.A. Gurko, N.E. Tihonova, F.E. Sheregi, etc.). To understand the features and patterns of demographic attitudes, it is important to turn to sociology of youth – namely, to the theories that justify the allocation of youth to a special socio-demographic group with its inherent features (E D. Voznesenskaya, G.S. Goncharova, D.L. Konstantinovskiy, G.A. Cherednichenko, V.N. Shubkin, etc.), studies on social changes related to youth selfdetermination (T. Lisovskiy, V.F. Levicheva, V.A. Lukov, etc.), research on the influence of environmental risks on young people’s behavior in conditions of uncertainty and the concept of a socio-cultural mechanism of the formation and reproduction of social reality (Ju.A. Zubok, V.I. Chuprov, N.A. Romanovich).
Human and demographic potential of Russian regions, as well as institutional space, is studied in several works (by O.V. Baydalova, E.S. Gubanova, M.M. Guzev, N.V. Dulina, Z.M. Dyl’nova, S.M. Imyarekov, O.V. Inshakov, A.E. Kalinina, E.V. Kargapolova, N.I. Lapin, N.M. Tokarskaja, A.A. Shabunova, K.P. Yurtaev, etc.).
The influence of behavior factors on population dynamics is also recognized in well- known concepts of the demographic transition [10; 11], especially the second and third ones [12–14]. The concepts of the third and fourth demographic transitions, developed by A.V. Iontsev, also determine the significance and impact of the migration on the demographic appearance of territories [15]. The concept of epidemiological transition draws attention to the importance of the self-preserving (healthpreserving, vital) behavior of population in the formation of public health at the present development stage [16; 17].
The demographic behavior from demographers’ point of view is a system of relatively independent types: reproductive, marital (matrimonial), self-preservatory, and migration. Each one has its own structure, which is distinguished on non-identical grounds within different approaches. Thus, the psychological approach involves an analysis of values, motives, goals/attitudes, decisions, actions, and control of the result. The medical approach, used in relation to self-preservatory behavior, focuses on medical activity and the norms of a healthy lifestyle, i.e. actions that are directly included in the area of healthcare responsibility ( Tab. 1 ).
The matrimonial behavior is primarily studied together with the reproductive one. This is a well-justified research design: in the 20–21st centuries, more than 70% of children are born in marriage. Among the most well-known are estimates of the historical evolution of these behavior types due to social transformations of family and marriage institutions ( Tab. 2 ). Presented characteristics of behavior types are described within the sociodemographic approach.
The sociodemographic approach integrates socio-psychological foundations of behavior and its demographic meaning, defining two enlarged components in all types – an idea of what actions should be, its final result, and
Table 1. Theoretical approaches to the interpretation of self-preservatory behavior and its structure
|
Approach |
Representatives |
SPB interpretation |
SPB components |
|
Medical |
Ju.P. Lisitsyn, O.V. Grinitsyn, A.M. Izutkin, I.F. Matyushin |
Self-preservatory behavior is equal to a healthy lifestyle (or hygienic behavior), i.e. an activity of an individual , certain groups of people, most characteristic for specific socioeconomic, political, environmental, and other conditions, aimed at preserving and improving, strengthening of health |
(HLS norms):
|
|
Psychological |
M. Becker, L. Maiman, M. Fishbein, A. Eisen, J. Prochazka, K. DiClemente, N.V. Yakovleva, N.N. Ulanova, L.G. Ulyaeva |
Self-preservatory behavior (more commonly called health-saving behavior) is viewed in different ways:
L.G. Ulyaeva) |
SPB basic components:
|
|
Sociodemographic |
A.I. Antonov,
I.V. Zhuravleva, L.S. Shilova, E.B. Babin, L.V. Shibut, I.S. Vjalov, G.A. Ivahnenko, V.Ya. Shklyaruk, L.Yu. Ivanova, A.A. Shabunova |
Self-preservatory behavior is a system of actions and relationships of an individual |
|
|
aimed at preserving health throughout a life cycle and extending life span |
|||
|
Source: [18]. |
|||
directly implemented behavioral acts. The first component, which is a formed image of a family, family life, and health saving in a certain sense, is measured using demographic attitudes; the second one – by the parameters of specific actions.
The demographic behavior, childbearing and birth rates, and public health depend on population’ s demographic attitudes. The scientific problem is in the definition of the formation mechanism of these attitudes, identification of factors and conditions that have a direct and indirect impact on this process. One of the determining factors of the socio-demographic policy is sociodemographic policy, which influences the formation of conditions for the implementation of the demographic behavior. Hypothetically, adverse conditions lead to delayed childbirth, reduced childbearing, increased risks of implementing “positive” demographic attitudes, implemented destructive practices in the area of health, leaving of population from territories with subjectively and objectively “bad” living conditions. Favorable conditions, in turn, do not always help increase birth rates, strengthen public, individual health, and migration attractiveness. The scientific problem expands,
Table 2. Historical types of reproductive and marriage behavior in Russia and Europe
|
Reproductive behavior type |
Characteristics |
Period |
Marriage behavior type |
Characteristics |
Period |
|
Many children (traditional type) |
5 or more children in a family; lack of birth control practices (contraception, abortion); predominance of economic motives for childbearing (children are workers, assistants at home) |
Until the mid. 19th cent. in West. Europ. countries; in Russia – until the mid. 19th cent.–early 20th cent. |
Traditional (Eastern European) |
Early age of marriage (below 24 years), universal marriage, i.e. high percentage of married population (more than 90%) and low percentage of celibacy (less than 10%) |
Unt. the end of the 17th cent. in West. Europ. countries; in Russia – before the 20th cent. |
|
Average number of children (intermediate type) |
3–4 children in a family; weakening of intra-family motivation for childbearing; application of birth control (abortion, contraception) |
From the mid 19th cent. In West. Europ. count.; in Russia – starts in the second half of 19th cent. in urban regions, from the 1920s – main part of the country |
Western European (European) |
Late age of marriage (over 24 years), low percentage of married population, high percentage of celibacy (over 10%) |
In West. Europe and other developed countries – since the late 18th cent.–early 19th cent.; in Russia – since early 20th cent. until the 1940s |
|
Post-war |
Early age of marriage (below 24 years), universality of marriage |
In West. Europ. countries – after the Second World War (the 1940s–50s) until the 1960s-70s; in Russia – until the 1980s |
|||
|
Few children (modern type) |
1–2 children in a family; pregnancy planning; common spread of methods for intra-family regulation of a number of births |
From the 1960–70s in West. Europe and developed сountries; in Russia – from the late 1960s |
Modern |
Late age of marriage (over 25 years), high level of final celibacy, high divorce rate |
In West. Europe and other developed countries – since the 1960s–70s; in Russia – since the 1980s–90s |
|
Source: [19]. |
|||||
since it is not only necessary to determine the mechanisms of forming demographic attitudes, but also to decide what content we should put in concepts of “favorable” and “unfavorable” conditions for childbirth, a healthy lifestyle, and life in general. Hypothetically, it may be assumed that favorable conditions are associated with the economic growth. However, practice shows that this is not the case; the socio-economic situation is not an only factor, and the birth rate declines even faster in many economically developed countries and regions in comparison with poorly developed ones. The relationship between health development and health parameters, living standards, and migration is more noticeable. The theoretical problem is the search for a balance of different factors and an optimal model of conditions for the formation and implementation of demographic attitudes. That is why it seems important to analyze the efficiency of sociodemographic policy taking into account sociocultural conditions of its implementation while developing the methodology and research methodology, since optimal models may differ depending on regional specifics. It seems that the all-Russian study of the demographic behavior (in its broad sense) and population’s well-being, conducted in the monitoring format, will allow justifying the choice of a model of socio-demographic policy considering territorial characteristics.
The project “Demographic behavior of the population within Russian national security”, implemented by a creative team of Russian scientists from academic institutions and leading universities, supported by the Russian Science Foundation, is aimed at such a deep and comprehensive analysis. Within the current study, tools of the all-Russian sociological monitoring “Demographic well-being of the population in Russian regions”, which allows conducting a comprehensive assessment of demographic behavior types, from the position of its formation and factors of demographic attitudes too, were developed. A questionnaire consists of five blocks that may provide data on all types of demographic behavior (marital, reproductive, self-preservatory, migration) and the efficiency of demographic policy. In addition, the selection of blocks will help notice a mutual relationship of attitudes and behavioral practices of various types of the demographic behavior, determine its interconnections, and identify ones that are more responsive to managerial influences. A common block of socio-demographic characteristics of respondents, which specifies the targeting of conclusions, also expands analysis opportunities. A set of questions about demographic policy allows assessing the significance of implemented measures for population as a whole, individual region, sociodemographic groups, population’s loyalty to the demographic policy at federal and regional levels, and its real effect in the form of results of the demographic behavior.
In February–March 2020, the first wave of selective sociological survey was carried out by means of a questionnaire survey. Ten Russian regions were covered: Moscow, Republic of Bashkortostan, Tatarstan, Vologda Oblast, Volgograd Oblast, Ivanovo Oblast, Leningrad Oblast, Moscow Oblast, Nizhegorod Oblast,
Sverdlovsk Oblast. The total sample size included 5.616 people.
The survey implements a multi-stage typological selection. At the first stage, territories for conducting the survey and types of settlements (urban and rural localities) were selected; at the second stage, each one went through a systematic selection (a quota sample taking into account respondents’ age groups, gender, and professional sphere). The usage of multi-stage sampling increases accuracy of the results, a confidence interval for calculating data for the all-Russian sample is +/–0.4% (with the 99.7% confidence level), for regional samples +/–4% (with the 95.4% confidence level). The results are representative for Russia as a whole and for the regions included in the sample [20]. Thus, we can get data on the parameters of demographic behavior of Russians, including its results, recorded by demographic statistics, and its determining factors. The first wave of monitoring, conducted before an active phase of the pandemic in the country, allowed obtaining unique data on the characteristics of demographic behavior considering population’s socio-demographic stratification and in the complex of its kinds (matrimonial, reproductive, health, migration) and laying the foundation for the next wave of research in the post-pandemic period. It significantly expands opportunities for finding ways of improving the efficiency of demographic policy in general and the national project “Demography” in particular.
Results. Possible ways of analyzing data of the first monitoring wave
A comprehensive nature of tools provides extensive opportunities for an analysis, which allow understanding trends, identifying main factors or motives of people’s behavior, and, moreover, revealing issues that require an indepth study, mechanisms, and tools for solving problems. A monitoring nature of the study will allow noticing the dynamics of the situation, a reaction to measures of socio-demographic policy. Even the first wave provides wide opportunities. In this paper, we will indicate only possible directions for analyzing obtained sociological cross-section study.
– Cross-analysis of blocks (comparison of reference points of questionnaire’s different blocks), which allows seeing deep diverse connections and take it into account in the subsequent analysis. For example, interconnections between demographic behaviors are noticeable. People focused on large families are more oriented on longevity (average 95 years vs. 88–89 among those who want less children or are childless) which is caused by a desire to stay longer with family members, take care of them (Tab. 3). In this group, there are higher people’s estimations of their own health
Table 3. Parameters of self-preservation behavior in population groups with different reproductive plans
|
Option |
Average in the survey |
How many children (including existing ones) Do You want to have? |
||
|
“Childfree” |
Planning few children (1–2 kids) |
Planning many children (3+) |
||
|
Number of a category in the sample (people) |
5616 |
272 |
3121 |
927 |
|
If you had a choice, how many years Would you like to live with the most favorable conditions? (years) |
||||
|
Average value |
90 |
89 |
88 |
95 |
|
Median value |
90 |
85 |
90 |
90 |
|
Why would You like to live this many years? (average value on a 5-point scale) |
||||
|
I would like to live for myself, without work |
3.8 |
3.8 |
3.9 |
3.8 |
|
I don’t want to lose my retirement savings and use it completely |
2.8 |
3.0 |
2.9 |
2.8 |
|
Older people are respected in society |
2.4 |
2.5 |
2.4 |
2.4 |
|
I want to work longer in retirement age |
2.4 |
2.5 |
2.3 |
2.5 |
|
I want to help my adult children |
3.6 |
2.5 |
3.7 |
3.9 |
|
I do not want to leave my spouse without my help and support |
3.7 |
3.0 |
3.8 |
4.0 |
|
I want to live long enough to see my grandchildren |
4.2 |
2.8 |
4.3 |
4.5 |
|
How would You assess your lifestyle? (% of a number of respondents) |
||||
|
It can be called healthy |
32.8 |
31.1 |
30.8 |
38.4 |
|
It is not quite healthy |
50.1 |
46.1 |
52.6 |
48.6 |
|
I am far from a healthy lifestyle |
17.1 |
22.8 |
16.6 |
13.1 |
|
What do you personally do to preserve and strengthen your health? (% of a number of respondents) |
||||
|
A number of measures taken to preserve and strengthen own health |
||||
|
None of the measures are marked |
11.8 |
13.2 |
11.3 |
10.4 |
|
1–2 measures |
25.9 |
38.6 |
23.8 |
23.0 |
|
3–4 measures |
30.4 |
29.0 |
32.8 |
25.4 |
|
5 and more measures |
31.9 |
19.1 |
32.1 |
41.3 |
|
Including, for example: |
||||
|
Adhere to recommendations about healthy nutrition |
20.3 |
20.2 |
19.8 |
26.7 |
|
Abuse alcohol |
45.8 |
39.0 |
46.2 |
47.4 |
|
Do not drink alcohol at all or do it moderately* |
54.2 |
61.0 |
53.8 |
52.6 |
|
Do not consult a doctor in case of illness |
29.0 |
28.3 |
27.4 |
34.6 |
|
Seek medical help in case of illness |
70.9 |
71.8 |
72.5 |
65.5 |
|
Toughen up regularly |
34.2 |
21.7 |
35.3 |
39.1 |
|
* This group includes people who do not drink alcohol at all or consume it moderately – none alcoholic beverages are consumed often (“daily”, “on weekends”) and, over the last month, there was no fact of consuming 5 or more standard portions of alcohol at once. Source: data from a sample sociological study conducted in February–March 2020 in 10 Russian regions. |
||||
(53% consider it very good and good, compared to 40% among those focused on having fewer children) and lifestyle (38% believe that it can be called healthy). However, an analysis of specific practices cautions us not to jump to simple straightforward conclusions. It revealed that families focused on having many children have lower medical activity, and alcohol abuse is more common among them.
Combined motives of matrimonial behavior and reproductive plans of individuals are quite logical. Marital status of respondents is partly determined by their age characteristics (there are more young people among childfree people). Legitimate marriage, in its traditional basics, is more intensively supported by those who are focused on having many children: average score for proposed reasons-motives for registering a marriage is higher than an average number ( Tab. 4 ). However, among couples focused on having fewer children, the share of cohabiting couples is higher (8% vs. 4 and 6%).
While analyzing migration flows and attitudes, it is important to understand population’s reproductive plans. Migration moods are not linked to reproductive orientations so clearly and closely. About 30% of respondents would like to change their place of residence ( Tab. 5 ). In any case, this is a signal for management structures that requires comprehension. Probably, among the reasons for leaving, the chain of evaluating steps and motives stops at solving the most acute problems. People leave for better living conditions, which are clearly linked to a job with a high salary, i.e. the construction “I want to leave because there will be better conditions for the birth and children upbringing”, which would seem to be really important, is hidden (not visible) behind the search for better living standards in general. The results of this stage of the study show that this issue requires an in-depth analysis; perhaps, with help of a focus group study, it is necessary to deepen
Table 4. Some parameters of marital behavior in population groups with different reproductive plans
|
Option |
Average in the survey |
How many children (including existing ones) Do You want to have? |
||
|
“Childfree” |
Planning few children (1–2 kids) |
Planning many children (3+) |
||
|
Size of a category in the sample (people) |
5616 |
272 |
3121 |
927 |
|
Are you married? (% of a number of respondents) |
||||
|
I am in a registered marriage |
47.4 |
10.3 |
52.4 |
55.1 |
|
I am in an unregistered marriage |
7.1 |
4.4 |
8.4 |
5.5 |
|
Widower (widow) |
1.4 |
0.7 |
1.4 |
0.9 |
|
Divorced |
8.5 |
8.8 |
7.7 |
4.9 |
|
I have never been married |
35.6 |
75.7 |
30.2 |
33.6 |
|
If you think that marriage should be registered, why is that? (an average score for assessing the significance of each of these factors on a 5-point scale: “1 “ means that it is almost irrelevant, “5” means that it is very important) |
||||
|
It corresponds to the norms of public morality and opinion of others |
3.1 |
2.7 |
3.1 |
3.3 |
|
Desire to have a child in a registered marriage |
3.9 |
2.9 |
4.0 |
4.2 |
|
If there is a confidence that cohabitation in an unregistered marriage has “challenged marriage” (or if people already know each other well) |
3.2 |
2.9 |
3.2 |
3.3 |
|
Ensures material rights of a parent who remains with children in case of a possible divorce |
3.5 |
3.4 |
3.5 |
3.6 |
|
It guarantees that a couple will live a long life together |
2.7 |
2.3 |
2.8 |
2.9 |
|
Source: data from a sample sociological study conducted in February–March 2020 in 10 Russian regions. |
||||
Table 5. Population’s migration attitudes
Clarification of a degree of impact and demand for support measures in population groups with different reproductive plans allows drawing more precise conclusions. Among those who plan to have many children, there are more recipients of government support (67% vs. 28% among childless people and 60% among those who are focused on having few children, Tab. 6 ). It is also explained by a higher percentage of families that already had children at the time of the survey. A degree of significance of government support for them is also more important (3.5 points on a 5-point scale against 2.7 and 3.3 points, respectively). For many-children-oriented groups, the significance of almost all options for support measures is higher than for other groups, especially for measures related to child rearing and flexible work hours.
The activation of the demographic policy was most highly appreciated by a group of Russians planning three or more children. New support measures helped 40% people of this group to implement their existing reproductive intentions. Among those who plan 1–2
children, there are two times fewer such people – 21%. One factor of underestimating the importance of implemented support measures and refusal of receiving it is the lack of awareness of support forms and a procedure for receiving it. Average score for the assessment of the level of information proficiency on this issue is 2.6 on a 5-point scale: among those who do not plan children – 1.9 points, among those who plan fewer children – 2.7, and among those who plan many children – 3.0. The need for information among those who are aimed at having many children is noticeably higher, which is obviously determined by a higher need for support.
– Search for territorial features of sociodemographic processes and its regulation
Another important advantage of the allRussian monitoring is an opportunity to identify regional characteristics of the demographic behavior and susceptibility to demographic policy measures. The results of the first wave showed that regions differ, for example, in population’s reproductive orientations. A desired number of children in the Moscow and Sverdlovsk oblasts and the Tatarstan and Bashkortostan republics is above
Table 6. Government support: receiving, assessment, and informing
From a point of view of realization of a desired number of children, conditions are assessed in the most critical way by residents of the Ivanovo, Sverdlovsk, Moscow, Nizhegorod oblasts and the Republic of Tatarstan. In other regions, the difference is smaller, i.e., on the one hand, people assess the conditions for the birth of a desired number of children as more favorable, on the other – in these regions, the need for children itself is averagely lower. In both republics, there is a noticeably higher
Table 7. Preferred number of children, regional aspect
Among the regions of the first wave, the Republic of Bashkortostan, the Sverdlovsk and Vologda oblasts, the Stavropol Krai, the Ivanovo and Nizhegorod oblasts were the most labile to new support measures (the share of responses that demographic policy measures affected a decision to give birth to a child, respectively, were 36, 29, 26, 26; 0, 15%; Figure ).
Distribution of answers to the question “How did the strengthening of government support measures for families with children influence the decision to give birth to Your youngest (only) child?” (% of a number of respondents)
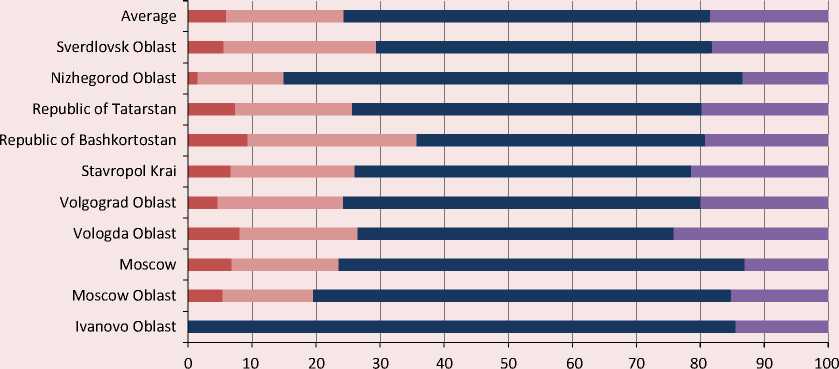
Yes, affected a lot Yes, affected a little ■ No ■ Difficult to say
Source: data from a sample sociological study conducted in February–March 2020 in 10 Russian regions.
An interesting and informative form of analysis is the construction of various matrices, such as the matrix of demand for social support measures for families with children in the territorial context. Regional differences in important measures are quite clear. The most popular ones are additional education for children and flexible work hours ( Tab. 8 ). In the Republic of Bashkortostan and the Moscow Oblast, assistance in finding additional work is important, in the Republic of Tatarstan, an issue of looking after schoolchildren is relevant, in the Stavropol Krai and Sverdlovsk Oblast – an issue of looking after preschool children. Vologda residents experience difficulties and expect help in organizing leisure and family recreation. The Nizhegorod Oblast has a complete match of a set of measures with average Russian ones.
A set of three least popular positions differs significantly less than a range of the most important ones. Least important for families with children are assistance in providing household services, assistance in caring for a disabled family member, and assistance in organizing family affairs.
The combination of the constructed matrix with the analysis of the legal framework of socio-demographic policy in studied regions will strengthen the reasonableness and accuracy of conclusions and proposals.
– Detailed analysis of each personal data block. Socio-demographic profile in relation to any selected population or for each question.
The basis for further in-depth and extended analysis, additions, and cross-connections is a consistent, logical, and complete discussion of the information for each questionnaire block. This analysis may be carried out either on the basis of data from the survey as a whole, or with the selection of a separate region or group of regions. A single “passport” for all blocks also provides additional opportunities for comparisons and conclusions.
Table 8. Matrix of regional differences in the importance of social support measures for families with children (three most and three least necessary measures, average score on a 5-point scale)
|
Region |
Three most important measures for family support |
Points |
Three least important measures for family support |
Points |
|
Ivanovo Oblast |
Assistance in finding employment with an opportunity to work flexible hours |
3.39 |
Assistance in organizing a family business |
2.46 |
|
Assistance in looking after a child of preschool age |
3.30 |
Assistance in providing household services (go to a store, clean an apartment) |
2.12 |
|
|
Assistance in organizing family leisure |
3.18 |
Assistance in looking after a disabled family member |
2.07 |
|
|
Moscow Oblast |
Additional education for children |
3.41 |
Assistance in looking after a disabled family member |
2.75 |
|
Assistance in finding employment with an opportunity to work flexible hours |
3.38 |
Assistance in organizing a family business |
2.57 |
|
|
Assistance in finding extra work |
3.29 |
Assistance in providing household services |
2.43 |
|
|
Moscow |
Assistance in finding employment with an opportunity to work flexible hours |
3.23 |
Assistance in looking after a child of school age |
2.60 |
|
Additional education for children |
3.12 |
Assistance in providing household services |
2.57 |
|
|
Assistance in organizing family leisure |
3.09 |
Assistance in organizing a family business |
2.56 |
|
|
Vologda Oblast |
Assistance in organizing family leisure |
3.19 |
Assistance in looking after a disabled family member |
2.29 |
|
Other (specify what it is) |
3.14 |
Assistance in organizing a family business |
2.23 |
|
|
Assistance in organizing leisure activities |
3.05 |
Assistance in providing household services |
2.12 |
|
|
Volgograd Oblast |
Assistance in organizing family leisure |
3.17 |
Assistance in looking after a disabled family member |
2.44 |
|
Additional education for children |
3.17 |
Assistance in organizing a family business |
2.43 |
|
|
Other (specify what it is) |
3.10 |
Assistance in providing household services |
2.20 |
|
|
Stavropol Krai |
Additional education for children |
3.56 |
Other (specify what it is) |
2.99 |
|
Assistance in looking after a child of preschool age |
3.33 |
Assistance in looking after a disabled family member |
2.94 |
|
|
Assistance in finding employment with an opportunity to work flexible hours |
3.27 |
Assistance in providing household services |
2.70 |
|
|
Republic of Bashkortostan |
Additional education for children |
3.50 |
Assistance in organizing a family business |
2.77 |
|
Assistance in organizing family leisure |
3.14 |
Assistance in looking after a disabled family member |
2.44 |
|
|
Assistance in finding extra work |
3.11 |
Assistance in providing household services |
2.41 |
|
|
Tatarstan Republic |
Additional education for children |
3.63 |
Assistance in organizing a family business |
2.81 |
|
Assistance in finding employment with an opportunity to work flexible hours |
3.33 |
Assistance in looking after a disabled family member |
2.79 |
|
|
Assistance in looking after a child of school age |
3.33 |
Assistance in providing household services |
2.62 |
|
|
Nizhegorod Oblast |
Additional education for children |
3.27 |
Assistance in looking after a disabled family member |
2.24 |
|
Assistance in organizing family leisure |
3.25 |
Assistance in organizing a family business |
2.13 |
|
|
Assistance in finding employment with an opportunity to work flexible hours |
3.22 |
Assistance in providing household services (go to a store, clean an apartment) |
1.92 |
|
|
Sverdlovsk Oblast |
Additional education for children |
3.53 |
Assistance in organizing a family business |
2.48 |
|
Assistance in organizing family leisure |
3.20 |
Assistance in looking after a disabled family member |
2.46 |
|
|
Assistance in looking after a child of preschool age |
3.18 |
Assistance in providing household services (go to a store, clean an apartment) |
2.16 |
|
|
Average |
Additional education for children |
3.33 |
Assistance in organizing a family business |
2.56 |
|
Assistance in finding employment with an opportunity to work flexible hours |
3.18 |
Assistance in looking after a disabled family member |
2.55 |
|
|
Assistance in organizing family leisure |
3.15 |
Assistance in providing household services (go to a store, clean an apartment) |
2.34 |
|
|
Source: own compilation. |
||||
Russians highly value health and declare the importance of achieving this goal in life. Longevity occupies the third most important position together with a desire to have a close person and to give a good education to children ( Tab. 9 ).
Good health also has the most important instrumental value: according to Russian estimates, it ranks second in the list of conditions for successful life – right after communication skills, and Vologda residents placed it first ( Tab. 10 ).
However, declaration of the health importance is not enough for its preservation and strengthening throughout life: widespread usage and daily usage of health-saving practices are important. Older people, women over 55 years of age, and residents of rural areas mostly value health, while young women (42%), people with higher and postgraduate education (36%), owners of their own businesses (35%), urban residents (33%), and people who highly assess their financial situation (7 or more points on a 10-point scale – 35%) take care of it.
While assessing their lifestyle, half of respondents identified it as “not quite healthy”, while only 33% of respondents identified it as “healthy”. 17% of respondents realize that “they are far from a healthy lifestyle”.
What are the most common selfpreservation practices (actions consciously and unconsciously aimed at preserving and strengthening one’s own health)? Most often, Russians say that they give up smoking to preserve their health (53%). Slightly more than one third of respondents visit baths and saunas (31 and 36%), control weight (34 and 35%), resort to water purification or buy bottled water (33%), try to walk at least 30 minutes a day (34%) and moderately consume alcohol (31%). However, the vast majority of these practices do not require much effort or daily effort. Everything about constant morning exercises, regular physical education, optimal
Table 9. Importance of life goals (average score on a 5-point scale, where 1 is “not important at all”, 5 is “very important”)*
|
Goal |
Vologda Oblast |
Average in the survey |
|
Have a good heath |
4.6 |
4.7 |
|
Own good home |
4.7 |
4.6 |
|
Financial well-being of my family |
4.6 |
4.6 |
|
Have a loved one around |
4.5 |
4.5 |
|
Give children a good education |
4.5 |
4.5 |
|
Live a long life |
4.6 |
4.5 |
|
* Only positions with an average score of at least 4.5 points are shown. Source: data from a sample sociological study conducted in February–March 2020 in 10 Russian regions. |
||
Table 10. Conditions necessary for achieving success in life (average score on a 5-point scale, where 1 is “basically not important”, 5 is “very important”)*
|
Conditions for success in life |
Vologda Oblast |
Rank by importance |
Average in the survey |
Rank by importance |
|
Ability to build relationships with people |
4.4 |
2 |
4.5 |
1 |
|
Good health |
4.5 |
1 |
4.4 |
2 |
|
Capabilities, talent |
4.2 |
4 |
4.3 |
2 |
|
Ability to work hard and conscientiously |
4.3 |
3 |
4.2 |
2 |
|
Ability to adapt |
4.0 |
6 |
4.2 |
3 |
|
High level of education, upbringing, culture |
4.1 |
5 |
4.2 |
4 |
|
Luck |
3.9 |
7 |
4.1 |
5 |
|
Source: data from a sample sociological study conducted in February–March 2020 in 10 Russian regions. |
||||
Table 11. Distribution of responds to the question “Over the last 12 months, have you seriously tried...?”, % of a number of respondents
|
Option |
Vologda Oblast |
Average in the survey |
||||
|
Yes, I tried and succeeded |
Yes, I tried and failed |
No, I didn’t try |
Yes, I tried and succeeded |
Yes, I tried and failed |
No, I didn’t try |
|
|
Improve performance |
37.4 |
11.7 |
50.9 |
40.0 |
18.6 |
41.4 |
|
Increase your physical activity |
38.1 |
14.5 |
47.4 |
37.0 |
23.8 |
39.3 |
|
Reduce alcohol consumption |
16.4 |
6.5 |
77.1 |
25.4 |
8.6 |
66.0 |
|
Quit smoking, % of those who smoke |
5.3 |
30.2 |
64.5 |
8.8 |
31.8 |
59.4 |
|
Reduce weight |
19.1 |
18.6 |
62.3 |
25.7 |
21.2 |
53.1 |
|
Increase weight |
2.5 |
3.1 |
94.4 |
8.0 |
7.3 |
84.6 |
|
Consume less fat |
24.0 |
11.5 |
64.5 |
24.4 |
14.5 |
61.2 |
|
Consume less salt |
24.8 |
9.5 |
65.7 |
22.0 |
14.4 |
63.6 |
|
Consume less sugar |
28.5 |
10.9 |
60.6 |
27.7 |
16.2 |
56.1 |
Note: the sum of responses is 100% per line (for the Vologda Oblast and average for the survey).
Source: data from a sample sociological study conducted in February–March 2020 in 10 Russian regions.
combination of workloads and rest has a significantly lower prevalence (from 20% and below). The spread of health-improving procedures in sanatoriums and dispensaries is also low (7%). In addition, 17% of Russians do nothing to preserve and strengthen their own health.
The analysis of the successfulness of attempts to change a lifestyle is very demonstrative. Averagely, more than a half of respondents tried to bring it closer to healthy in one way or another ( Tab. 11 ). The most significant areas of healthy lifestyle are the improvement of performance and physical activity, which are also the most efficient ones (40 and 37% of attempts are successful). Almost a half of those who tried to lose weight reached this goal, and their nutrition adjustments were quite successful. The worst situation is with smoking: the success rate of attempts to quit smoking is only 9% (in the region – only 5%).
We see an interesting distribution of responses while comparing self-assessment of health and actions of preserving it. First, the share of those who do not take care of their health is higher in a group with its low selfassessment and lower among those who rated their health as good and excellent (Tab. 12). Second, low-energy practices are equally common among people with different selfassessments of health. Active physical activity is more typical for people who defined their health as very good and good – 36% (against 14–15% of those who called it satisfactory and bad). Third, it is noteworthy that people with low self-assessment of health do not manage to optimally combine work loads and rest. It requires additional thinking and analysis. Fourth, people with poor health visit baths less often (24% vs. 33% among people with satisfactory health and 33% among those who rated their health as very good and good), have higher medical activity (35% vs. 28 and 29%, respectively), are undergo treatment more often (10% vs. 6 and 8%); at the same time, among unhealthy people, there are fewer of those who moderately consume alcohol (26% vs. 33 and 30%) and care about an optimal combination of work and rest (16% vs. 22 and 24%).
The analysis suggests that people’s assessment of their lifestyle is not always adequate. For example, among those who consider it healthy, one third of respondents either do not implement self-preservation
Table 12. Distribution of responds to the question “What do you personally do to maintain and improve your health?” depending on self-assessment of health, % of a number of respondents
However, an analysis of the prevalence of risk factors shows that they are significantly less differentiated in both groups: lifestyle selfassessment and longevity attitude. Among modern risk factors for bad health, absolute leaders are neglect or ignorance of the norms of a healthy diet and the ratio of work and rest (almost 40%), frequent stress, a feeling of distress (55%) and associated alcohol consumption (53%, while 27% of respondents have obvious abuse). Smoking and alcohol often act as a “cure” for stress or intermediaries in communication, a quarter of its users acknowledge their need to drink and/ or smoke (among Vologda residents, the share of such responses is critical – 43%). It is quite difficult to work with traditions of feasts and communication practices, but it is possible and necessary to work systematically to replace destructions in the complex of relaxation and anti-stress behavioral programs.
Concluding a brief overview of the block “health and self-preservation behavior”, it is necessary to note that Russians tend to declare a high value of health. At the same time, there is a persistent gap between understanding how to live to preserve health and what practices are implemented in everyday life.
It is obvious that most Russians, using the health resource to achieve other life goals, live in an uncompensated high rhythm, stressful conditions and aggravate the situation by an inadequate way of relaxing and reducing stress.
In such situation, it is important to act with soft power by creating a need for selfpreservation practices and leading to its mandatory implementation; it is necessary to simultaneously create an accessible infrastructure that allows implementing these practices.
In this article, we deliberately avoided mathematical methods of analyzing received information, since it is important at the next stage of understanding obtained primary data while searching for patterns, conducting factor analysis, and making forecasts. Undoubtedly, while developing a model of optimal conditions for the formation and implementation of demographic attitudes, it is impossible to do without a mathematical apparatus.
Thus, realizing the responsibility and complexity of forming a methodology that allows synthesizing numerous indicators of population’s demographic behavior and refracting it from a point of view of possible directions for adjusting socio-demographic policy, the creative team of the project “Demographic behavior of the population within Russian national security” believes that formed sociological tools will help solve this task.
A comprehensive nature of the study will allow understanding the current situation, provide extensive opportunities for obtaining information and analyzing it, and become the basis for understanding the directions of deepening the study and finding ways and mechanisms for adjusting socio-demographic policy after the results of the first wave of monitoring.
An all-Russian nature of the study will allow a balanced approach to the analysis and adjustment of situations in regions, which is extremely important since there can be no unified solutions for many demographic problems for the whole country, and the regional aspect is important.
References On the necessity to develop models of optimal conditions for the formation and implementation of demographic attitudes
- Zvereva N.V., Arkhangel’skii V.N. Modern fertility policy in Russia: preliminary results and outlook. Federalizm=Federalism, 2010, no. 2 (58), pp. 69–84 (in Russian).
- Kalachikova O.N. Shabunova A.A. Population growth causes in the period of activation of Russia’s demographic policy (on the example of Vologda oblast). Problemy prognozirovaniya=Studies on Russian Economic Development, 2013, no. 5, pp. 129–136 (in Russian).
- Arkhangel’skii V.N., Elizarov V.V. Demographic projections in modern Russia: analysis of results and choice of hypotheses. Nauchnye trudy: Institut narodnokhozyaistvennogo prognozirovaniya RAN=Scientific Articles – Institute of Economic Forecasting Russian Academy of Sciences, 2016, no. 1, pp. 524–545 (in Russian).
- Denisov B.P., Sakevich V.I. The use of contraception in Russia (based on sample survey materials). Dokazatel’naya meditsina i klinicheskaya epidemiologiya=Evidence-Based Medicine and Clinical Epidemiology, 2009, no. 2, pp. 32–37 (in Russian).
- Tyndik A.O. Reproductive attitudes of the population in modern Russia. SPERO, 2012, no. 16, pp. 95–112 (in Russian).
- Ipatova A.A., Tyndik A.O. Reproductive age: 30 years old in preferences and biographies. Mir Rossii=Universe of Russia, 2015, no. 4, pp. 123–148 (in Russian).
- Kalachikova O.N., Gruzdeva M.A. Changes in reproductive behavior and marriage patterns of the Russian population (based on analysis of Rosstat sample studies). Sotsial’noe prostranstvo=Social Area, 2018, no. 2 (14). DOI: 10.15838/sa.2018.2.14.1 (in Russian).
- Sinelnikov A.B. Demographic self-regulation in terms of population growth and decline. Sotsiologicheskii zhurnal=Sociological Journal, 2019, vol. 25, no. 4, pp. 84–92. DOI:10.19181/socjour.2019.25.4.6819 (in Russian).
- Vishnevsky A.G. Demographic transition and the problem of demographic self-regulation. Answer to A.B. Sinelnikov. Sotsiologicheskii zhurnal=Sociological Journal, 2019, vol. 25, no. 4, pp. 93–104. DOI:10.19181/socjour.2019.25.4.6820 (in Russian).
- Notestein F.W. Population. The long view. In: Food for the World. University of Chicago Press, 1945. Pp. 35–57.
- Landry A., Girard A. La Révolution Démographique. INED, 1982. 230 p.
- Lesthaeghe R, van de Kaa DJ. Twee demografische transities? Bevolking: groei en krimp, 1986, pp. 9–24.
- Van de Kaa D. Europe’s second demographic transition. Population Bulletin, 1993, vol. 42, no. 1.
- Coleman D., Rowthorn R. Who’s afraid of population decline? A critical examination of its consequences. Population and Development Review, 2011, vol. 37, Demographic Transition and Its Consequences, pp. 217–248.
- Iontsev V.A., Prokhorova Yu.A. Generation of “A New Population” within the concept of fourth demographic transition. Vestnik Moskovskogo universiteta. Seriya 6. Ekonomika=Moscow University Economics Bulletin, 2012, no. 4, pp. 75–86 (in Russian).
- Omran A.R. The epidemiologic transition: A theory of the epidemiology of population change. The Milbank Quarterly, 2005, vol. 83(4), pp. 731–757.
- Weinstein N., Sandman P. The precaution adoption process model. In: Health Behavior and Health Education. San Francisco: Jossey-Bass, 2002. Рp. 121–143.
- Korolenko A.V. Patterns of population’s self-preservation behavior: research approaches and building experience. Ekonomicheskie i sotsial’nye peremeny: fakty, tendentsii, prognoz=Economic and Social Changes: Facts, Trends, Forecast, 2018, vol. 11, no. 3, pp. 248–263. DOI: 10.15838/esc.2018.3.57.16 (in Russian).
- Kalachikova O.N., Korolenko A.V. Patterns of reproductive behavior of population (on the materials of Vologda Oblast). Narodonaselenie=Population, 2018, no. 4, pp. 110–122. DOI: 10.26653/1561-7785-2018-21-4-10 (in Russian).
- Rostovskaya T.K., Kuchmaeva O.V. Conceptual approaches to conducting an all-Russian sociological study “Russia’s demographic well-being” as a tool for monitoring the effectiveness of demographic policy. VESTNIK YuRGTU (NPI)=The Bulletin of SRSTU (NPI), 2020, no. 3, pp. 89–99. DOI: 10.17213/2075-2067-2020-3-89-99 (in Russian).
