On the transformation of science and innovation space of a macroregion: case study of the northwestern federal district

Author: Rumyantsev Aleksey Aleksandrovich
Journal: Economic and Social Changes: Facts, Trends, Forecast @volnc-esc-en
Section: Innovation development
Article in issue: 4 (28) т.6, 2013.
Free access
The article presents the research results of science and innovation space in order to identify problem fields as the directions of its possible transformation. The analysis of the unevenness of science and innovation space by several indicators helped to identify the key problem fields in science and innovation activity in specific local fields. The article shows that the results of science and innovation activity in the regions with extractive industries are underestimated. It indicates the need for intensive support of large processing enterprises, the necessity to introduce indicative planning of the activity on the execution of federal and regional scientific and technological programmes. The tendencies of science and innovation space of a macroregion on the example of the Northwestern Federal District, contributing to its transformation in resolving the issues of upsurge in innovation activity, are determined.
Macroregion, science and innovation space, problem fields, directions of transformation, tendencies
Short address: https://sciup.org/147223499
IDR: 147223499 | UDC: 338.242.001.76(470.2)
Text of the scientific article On the transformation of science and innovation space of a macroregion: case study of the northwestern federal district
Transformation of social relations is caused by any violation of balance in the living conditions of people. It is aimed at overcoming the already existing negative phenomena and preventing crisis and the system collapse in the future.
Economic innovation activity has been remaining on a low level for a long time, the share of innovation products in Russia ranges from 4.4% in 2000 to 6.3% (2011), in the Northwestern Federal District – from 5.7% to 5.2% respectively, compared with 34.3% (2002) in Germany.
The functioning of enterprises with low-level innovation activity in the conditions of the global market with the country’s accession to WTO may lead to irreversible consequences.
The actions correcting the balance between the need for innovation renewal and production activity are associated with the necessity of profound transformation of science and innovation sphere.
Let us consider some issues of science and innovation activity in spatial dimension as the direction of its possible transformation on the example of the NWFD macroregion.
Identifying directions for the transformation of science and innovation space of the macroregion
The transformation of science and innovation space as an essential change of its characteristics is becoming socially necessary, in case problems hindering the development of science and innovation activity and innovation economy dynamics are revealed in the structure of the space. The problems that are characteristic of the considered space, form its problem fields.
The unevenness of science and innovation activity in space with its fields of condensation and rarefaction is considered the traditional problem field of the extension property of science and innovation space. As a rule, it is characterized by uneven territorial distribution of science and innovation potential. The analysis of unevenness showed that from the perspective of determining the directions of transformation it may be more productive to estimate the unevenness in terms of other characteristics, as opposed to such approach.
Table 1 presents the indicators of the distribution of the scientific potential kernel
(the number of researchers), as well as attracted resources and the results of science and innovation activity on the example of the Northwestern Federal District space.
The table data indicates the unevenness not only in the distribution of the research potential, but also in the resources, attracted to science and innovation research, scientific results and innovation output.
Scientific potential of Russia’s North-West space is distributed across the territory very unevenly: from 0.5 (Vologda Oblast) to 3.5 (Leningrad Oblast) researchers per 1000 of the employed in the economy by local zones, subjects of the Russian Federation, with the sharp increase to 17.9 people in Saint Petersburg. Saint-Petersburg, which is the largest science and innovation centre, as follows from the table, clearly distinguishes itself from other subjects of the Russian Federation. It plays a central role in the hierarchy of the Northwestern science and innovation centres [1].
Saint Petersburg can be attributed to the space defined as the force field [2], from which centrifugal and centripetal forces proceed.
Table 1. Indicators of the science and innovation space of the Northwestern Federal District for 2011
|
Region |
Potential kernel |
Resource |
Result |
|
|
Number of researches per 1000 of the employed in the economy, people |
Costs of research, development and technological innovations, billion rubles |
Number of patents granted per 10 thousand of the employed in the economy |
Share of innovation products, % |
|
|
Vologda Oblast |
0.5 |
10.0 |
1.4 |
3.7 |
|
Pskov Oblast |
0.8 |
0.3 |
1.1 |
2.3 |
|
Arkhangelsk Oblast |
1.1 |
4.1 |
1.2 |
0.2 |
|
Kaliningrad Oblast |
1.4 |
1.5 |
1.3 |
0.2 |
|
Republic of Karelia |
1.5 |
2.8 |
1.2 |
0.3 |
|
Novgorod Oblast |
1.6 |
1.7 |
1.4 |
4.8 |
|
Murmansk Oblast |
2.3 |
2.9 |
1.0 |
0.2 |
|
Komi Republic |
2.3 |
17.1 |
0.8 |
7.8 |
|
Leningrad Oblast |
3.5 |
13.4 |
1.6 |
2.5 |
|
Saint Petersburg |
17.9 |
107.3 |
8.8 |
9.0 |
|
NWFD |
7.7 |
160.0 |
4.0 |
5.2 |
Source: the author’s calculations based on the data: Russia’s regions. Socio-economic indicators: statistical digest. Rosstat. Мoscow, 2011.
As follows from the data of table 1, the share of expenses on science and innovation activity by local areas, subjects of the Russian Federation, is not proportional to the magnitude of scientific potential. For example, with relatively equal number of researchers, the expenses on research and innovation activity in the Arkhangelsk Oblast, in comparison with the Pskov Oblast, are much higher with share of innovation products being low. A similar ratio is observed in the Murmansk and Novgorod oblasts. Extremely low value of the innovation activity indicator can point that its role in the mentioned regions is insignificant or the given indicator does not reflect its real state. The effect of both factors can be assumed.
The data indicates the importance of the spatial approach, consisting in the establishment of not only local differences in science and innovation activity, but also in the realization of the necessity to identify and compare its factors.
Uneven results under equal or even fewer attracted resources (researchers and costs) by separate local zones, the subjects of the Russian Federation may serve as the basis for improving the measurement and the elaboration of measures for the transformation of science and innovation space of the macroregion in order to develop science and innovation activity.
The analysis of the extension properties of science and innovation space allowed us to discover its heterogeneity by profile of science and innovation activity, caused by the economic structure of the macroregion – the ratio of extractive and manufacturing industries. In the regions identified a clear connection between the share of extractive industries and the innovation indicator – the share of innovation products. Most vividly this connection can be illustrated by the following example: In 2010 in the Nenets Autonomous Okrug the share of extractive industries in the structure of gross value added amounted to 78.6%, the share of innovation products to 0.0%; in Saint Petersburg – 0.0 and 8.0% respectively; in the
Novgorod Oblast – 0.2 and 6.9% [3]. These data indicate partial sufficiency of the applied indicator of the share of innovation products for measuring the innovativeness of extractive industries, which are inherent not only in food, but process innovations as well. The indicators characterizing the entire volume of process innovation are not singled out in state statistics. The indicator of ‘technological innovation costs’ includes the cost of development and introduction of new products and processes. The indicators ‘number of created advanced manufacturing technologies’ and ‘number of applied advanced manufacturing technologies’ reflect technologies, controlled by a computer, summarizing manufacturing and extractive industries.
In regions with the considerable share of extractive industries innovation cannot be estimated only by the indicator of the innovation products share. “In modern conditions the natural resources sector of the economy (first of all, the oil and gas industry) is no more ‘technologically simple’. Extraction of raw materials is carried out with the use of increasingly complex technology. Therefore, one can assert that oil, gas and other raw products are increasingly becoming knowledgeintensive products” [4].
The indicator for process innovation estimation can be suggested in analogy to the specific indicator of the innovation products share. It is defined as the share of used innovation production technologies as the ratio of the volume of production, produced under technologies, subjected to various changes during the last three years, to the overall volume of production in percentage.
The problem of technological development of extractive industries is acute in Russia’s North-West with its forest industry, oil production and processing, gas, extractive and metallurgical industries. Thus, according to experts, “the extractive complex requires serious modernization and improvement, as it does not ensure the full utilization of raw materials (at the functioning enterprises up to 60% of potentially valuable components are wasted, piled up at dumps and tailing pits, dispersed in the environment)” [5]. The need to move towards “deep complex of wasteless (low-waste) recycling of raw materials extracted from earth depths” is highlighted. The assessment of the innovativeness of extractive industries and control over it as an essential component of transforming science and innovation space remains a problem field.
Domestic raw materials extracting and manufacturing companies of hydrocarbon specialization, as well as non-ferrous and ferrous metallurgical corporations, etc have necessary means for complex modernization, increasing share of the used innovation production technologies unlike many manufacturing industries that do not have own required investment resources.
By world standards low level of science and innovation activity, can be considered a problem field in the regions, where manufacturing industries dominate in the economic structure.
Table 2 presents the data on the economic innovativeness of Russia’s Northwestern regions with manufacturing industries, predominating in the added value.
As follows from the given data, the share of innovation products cannot be considered as satisfactory, due to the low level of innovation activities in the manufacturing industries of the regions, and not because of the assessment indicator. The amount of own funds allocated by enterprises to innovation activities, which is rather low by world standards, is one of the main factors of such situation. Thus, the volume of investments in scientific and technological development of the company Power Machines (Saint Petersburg, number of employees is over 12 thousand people) amounted to 1.99 billion rubles in 2009, while the specialization-related German company Siemens spent 5.7 billion US dollars for scientific research and development alone in 2002, and the Japanese company Matsushita Electric and the German company Volkswagen spent 4.3 billion each. [6].
The world experience shows that non-state financing of innovation activity as the main source is possible only under the condition that the state has large monopolies of the international standard, which may have effect from investments at costs, comparable with the corresponding expenses of the state [7].
Transnational corporations determine and form the scientific and technological progress in the world. In Russia large enterprises create science and innovation image of the industry. As follows from the data presented in table 2 , the share of innovation products is considered in the statistics only by large and medium-sized enterprises.
It is not only small business, but large business of the manufacturing industries as well, that requires intensive state support for laying the foundation of innovation modernization of the economy and integrating into the global innovation system.
Table 2. Regions with predominating manufacturing industries and the share of innovation products in 2010, % [3]
|
Region |
Extractive industries |
Manufacturing industries |
Share of innovation products |
|
NWFD |
7.7 |
21.6 |
4.1 |
|
Saint Petersburg |
0.0 |
24.1 |
8.0 |
|
Novgorod Oblast |
0.2 |
30.0 |
6.9 |
|
Pskov Oblast |
0.2 |
18.9 |
2.7 |
|
Vologda Oblast |
0.0 |
39.4 |
1.6 |
|
Leningrad Oblast |
0.9 |
23.8 |
2.4 |
|
Kaliningrad Oblast |
5.9 |
16.9 |
0.1 |
The connectivity characteristic, which is displayed through the interaction of industrial enterprises and scientific organizations and mainly created due to the functioning of federal and regional programmes, is an inherent part of science and innovation space. 14 federal and 13 regional scientific and technological programmes have been operating in the Northwestern Federal District [8]. Scientific and innovation programmes, comprising sectors and regions, form a network of extensive cooperation, jointly carried out by the organizations and enterprises of science and innovation projects. Network panorama of science and innovation space is yet poorly studied from the perspective of the methodological principle of the network organization of activities. At the moment its fragments are combined, loosely coupling and complementing each other.
The opportunities for arranging specific partnerships, knowledge transfer, based on trusted connections of informal and formal nature, are not implemented in full [9]. Scientific and innovation programmes become an active factor in the formation of science and innovation space. However, their role in this process is depreciated due to the absence of the mechanism of indicative and planning control over the programmes, generating a problem field in the application of the programme method of the macroregion’s science and innovation development.
The identified problem fields indicate possible directions for the transformation of science and innovation space. Their research involves the quantitative and qualitative assessment of the state of science and innovation space, and its transformation as well.
Indicators, characteristics, tendencies of the region’s science and innovation space as the basis for its transformation
The problem fields are identified as the result of current trends in science and innovation space of the macroregion and are examined on the example of NWFD based on the following indicators of the state statistics, and indicators in dynamics for 2005–2011calculated on their basis: number of scientific research and development organizations, including researchers; the results of science and innovation activity – the number of granted patents for inventions and utility models, the share of innovation products, as compared to the indicator of the share of innovation-active organizations.
The dynamics of the number of scientific organizations (tab. 3) shows that in the Northwestern Federal District the number of scientific organizations is inclined to decrease.
Table 3. Dynamics of the number of scientific research and development organizations, %
|
Region |
2005 |
2006 |
2007 |
2008 |
2009 |
2010 |
2011 |
|
Russian Federation |
97.5 |
101.6 |
109.2 |
92.6 |
96.4 |
98.7 |
105.4 |
|
NWFD |
97.1 |
99.1 |
114.1 |
87.9 |
97.2 |
96.9 |
102.4 |
|
Republic of Karelia |
100.0 |
100.0 |
100.0 |
100.0 |
100.0 |
100.0 |
118.7 |
|
Komi Republic |
90.5 |
126.3 |
95.8 |
108.7 |
88.0 |
104.5 |
91.3 |
|
Arkhangelsk Oblast |
100.0 |
96.1 |
120.0 |
106.7 |
103.1 |
100.0 |
100.0 |
|
Vologda Oblast |
107.1 |
120.0 |
116.7 |
95.2 |
95.0 |
89.5 |
105.9 |
|
Kaliningrad Oblast |
87.5 |
100.0 |
107.1 |
93.3 |
78.6 |
100.0 |
100.0 |
|
Leningrad Oblast |
94.4 |
105.9 |
111.1 |
85.0 |
88.2 |
93.3 |
100.0 |
|
Murmansk Oblast |
96.5 |
92.8 |
96.1 |
96.0 |
100.0 |
104.2 |
108.1 |
|
Novgorod Oblast |
100.0 |
100.0 |
118.2 |
92.3 |
100.0 |
100.0 |
108.3 |
|
Pskov Oblast |
90.9 |
100.0 |
140.0 |
85.7 |
100.0 |
108.3 |
92.3 |
|
Saint Petersburg |
96.0 |
96.8 |
116.3 |
84.1 |
98.1 |
95.5 |
102.4 |
|
Source: the author’s calculations based on the data: Russia’s regions. Socio-economic indicators: statistical digest. Rosstat. Мoscow, 2012. |
|||||||
The reduction was observed in all the subjects of the Russian Federation in certain years, especially in 2008–2009 – in the period of economic crisis, except for the Republic of Karelia and Arkhangelsk Oblast, where this number did not decline. The tendency of the decreasing number of scientific organizations throughout the macroregion is caused by their reduction in Saint Petersburg almost every year with its share in the total number of the macroregion’s scientific organizations amounting to 70%.
The chart (fig. 1) confirms the earlier conclusion that scientific potential is distributed irregularly on the territory of the macroregion.
The indicator ‘number of scientific organizations’, used to evaluate the scientific potential, does not fully reflect the magnitude and dynamics of the potential in space, due to the changing number of researchers per one organization (consolidation, or disaggregation).
Data, presented in table 4, indicate the tendency of a steady decrease in the number of the employed in the scientific sphere.
Figure 1. Number of scientific research and development organizations in 2011*
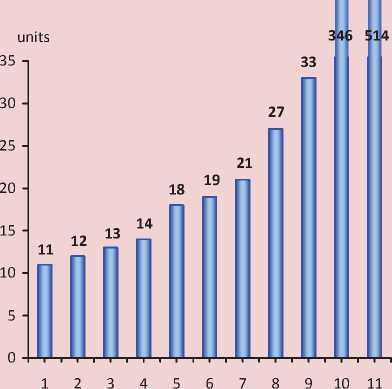
-
1 – Kaliningrad Oblast
-
2 – Pskov Oblast
-
3 – Novgorod Oblast
-
4 – Leningrad Oblast
-
5 – Vologda Oblast
-
6 – Republic of Karelia
-
7 – Komi Republic
-
8 – Murmansk Oblast
-
9 – Arkhangelsk Oblast
-
10 – Saint Petersburg
-
11 – NWFD
* The dimension wasn’t maintained for positions 10 – 11.
Table 4. Dynamics of scientific research and development staff, %
|
Region |
2005 |
2006 |
2007 |
2008 |
2009 |
2010 |
2011 |
|
Russian Federation |
96.9 |
99.2 |
99.3 |
95.0 |
97.5 |
99.2 |
99.8 |
|
NWFD |
97.0 |
98.9 |
100.2 |
95.8 |
98.1 |
98.1 |
101.4 |
|
Republic of Karelia |
82.0 |
92.7 |
109.0 |
100.6 |
95.4 |
103.0 |
104.7 |
|
Komi Republic |
89.1 |
100.1 |
101.9 |
101.0 |
89.7 |
95.6 |
96.8 |
|
Arkhangelsk Oblast |
97.9 |
170.6 |
98.2 |
98.7 |
49.6 |
77.9 |
92.7 |
|
Vologda Oblast |
82.4 |
120.9 |
83.6 |
103.0 |
96.5 |
103.4 |
85.1 |
|
Kaliningrad Oblast |
99.5 |
97.5 |
96.9 |
96.7 |
94.8 |
103.3 |
107.0 |
|
Leningrad Oblast |
99.1 |
100.5 |
100.7 |
98.6 |
101.4 |
100.2 |
99.3 |
|
Murmansk Oblast |
92.5 |
93.6 |
95.8 |
98.5 |
99.3 |
101.9 |
100.2 |
|
Novgorod Oblast |
88.8 |
101.7 |
96.9 |
96.6 |
106.5 |
102.2 |
110.1 |
|
Pskov Oblast |
79.3 |
102.5 |
91.3 |
87.8 |
120.0 |
115.2 |
162.3 |
|
Saint Petersburg |
97.6 |
97.1 |
100.5 |
95.3 |
99.7 |
98.0 |
101.5 |
Source: the author’s calculations based on the data: Russia’s regions. Socio-economic indicators: statistical digest. Rosstat. Мoscow, 2012.
In the Russian Federation the number of scientific research and development staff in the 2005–2011 period decreased by 77.934 people (from 813.207 to 735.273 respectively), in the Northwestern Federal District – by 7531 people (from 752.104 people to 221.97 people), in Saint Petersburg – by 6861 people (from 87.861 people to 81.000 people).
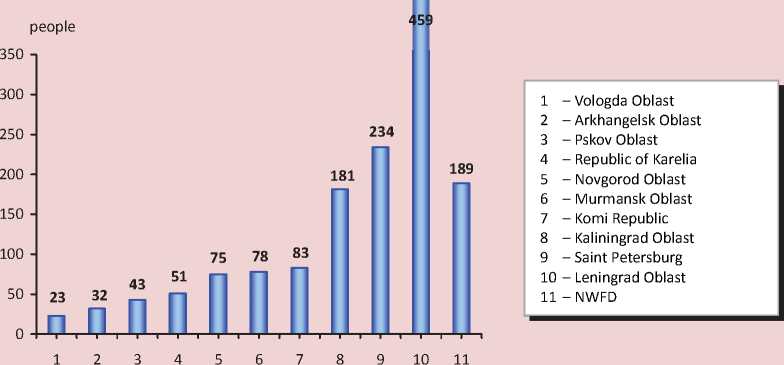
Research and development staff is mainly concentrated in the Leningrad Oblast (6431 people) and Saint Petersburg (81 thousand people) (fid. 2) . As follows from the figure 3 , the scientific organizations of the District, the largest ones in the employment volume, are concentrated in the Kaliningrad, Leningrad oblasts and Saint Petersburg.
Figure 2. Number of scientific research and development staff in 2011
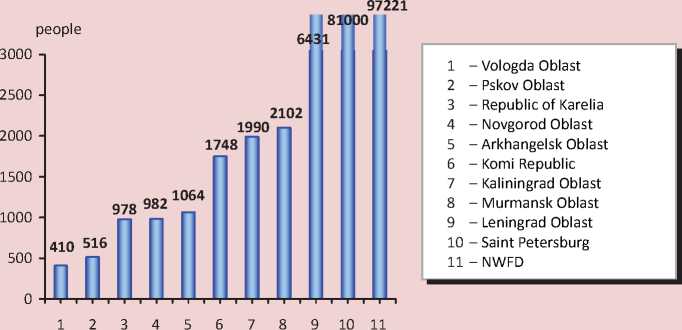
* The dimension wasn’t maintained for positions 10 – 11.
Figure 3. Number of scientific research and development staff per one organization in 2011
In addition to the indicators of the dynamics of research and development staff, table 5 contains data on the number of researchers, for the purpose of clarifying an earlier conclusion that the number of the employed in the scientific sphere of the macroregion is inclined to reduce.
As follows from the table, the dynamics of the number of researchers by the subjects of the RF Northwestern Federal District is also characterized by an overall tendency of reduction with some increase in certain years.
In the period under review the number of researchers decreased by 16.330 people (from 391.121 people to 374.791 people respectively) in the Russian Federation, by 2287 people (from 54.532 people to 52.245 people respectively) in the Northwestern Federal District, by 2206 people (from 46.882 people to 44.676 people) in Saint-Petersburg.
The chart ( fig. 4 ) illustrates the distribution of the researchers on the territory of NWFD, which is generally consistent with the distribution of the number of research and development staff (see fig. 2).
Table 5. Dynamics of the number of researchers, %
|
Region |
2005 |
2006 |
2007 |
2008 |
2009 |
2010 |
2011 |
|
Russian Federation |
97.4 |
99.4 |
101.0 |
95.7 |
98.2 |
99.9 |
101.6 |
|
NWFD |
96.0 |
100.1 |
101.7 |
95.8 |
97.8 |
97.8 |
102.5 |
|
Republic of Karelia |
102.3 |
90.8 |
97.3 |
100.6 |
89.8 |
106.2 |
97.1 |
|
Komi Republic |
89.6 |
100.3 |
105.9 |
104.4 |
89.6 |
95.7 |
96.8 |
|
Arkhangelsk Oblast |
98.8 |
277.4 |
100.4 |
89.5 |
48.1 |
81.2 |
93.4 |
|
Vologda Oblast |
86.7 |
126.9 |
70.8 |
140.4 |
97.3 |
100.0 |
96.9 |
|
Kaliningrad Oblast |
98.2 |
96.6 |
98.5 |
87.4 |
94.3 |
105.2 |
107.4 |
|
Leningrad Oblast |
98.2 |
100.0 |
101.4 |
95.0 |
103.5 |
105.8 |
120.0 |
|
Murmansk Oblast |
92.6 |
96.1 |
96.3 |
100.6 |
98.6 |
100.6 |
104.7 |
|
Novgorod Oblast |
82.1 |
95.1 |
101.7 |
102.3 |
104.7 |
100.4 |
102.3 |
|
Pskov Oblast |
69.9 |
139.6 |
92.5 |
89.2 |
113.8 |
95.2 |
149.4 |
|
Saint Petersburg |
96.4 |
97.5 |
97.8 |
93.0 |
107.4 |
97.5 |
102.6 |
Source: the author’s calculations based on the data: Russia’s regions. Socio-economic indicators: statistical digest. Rosstat. Мoscow, 2005, 2008, 2009, 2012.
Figure 4. Number of researchers in 2011
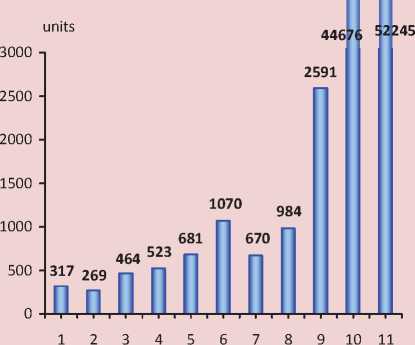
-
1 – Vologda Oblast
-
2 – Pskov Oblast
-
3 – Republic of Karelia
-
4 – Novgorod Oblast
-
5 – Arkhangelsk Oblast
-
6 – Komi Republic
-
7 – Kaliningrad Oblast
-
8 – Murmansk Oblast
-
9 – Leningrad Oblast
-
10 – Saint Petersburg
-
11 – NWFD
* The dimension wasn’t maintained for positions 10 – 11.
Table 6. Share of researchers, %
|
Region |
Share of researchers out of the total number |
|
Vologda Oblast |
77 |
|
Pskov Oblast |
52.0 |
|
Republic of Karelia |
47.0 |
|
Novgorod Oblast |
53.0 |
|
Arkhangelsk Oblast |
64.0 |
|
Komi Republic |
61.0 |
|
Kaliningrad Oblast |
34.0 |
|
Murmansk Oblast |
47.0 |
|
Leningrad Oblast |
40.0 |
|
Saint Petersburg |
55.0 |
|
NWFD |
54.0 |
At the same time, while in the Vologda Oblast the share of researchers is high – 77% (tab. 6), it makes up 34% in the Kaliningrad Oblast, 40% in the Leningrad Oblast , 54% with the average level of the macroregion amounting to 54%.
The dynamics of the results of science and innovation activity is presented in tables 7,8 .
Data presented in table 7 indicates an overall positive dynamics of the number of granted patents. In NWFD the growth in the period under review amounted to 3%. When comparing the data of table 7 and table 4 (dynamics of the number of research and development staff) and table 5 (dynamics of the number of the researchers employed), one can see that some increase in the number of granted patents, with reduction in the number of the employed in the scientific field in the Arkhangelsk Oblast, Kaliningrad Oblast, Saint-Petersburg may indicate the growth of scientific productivity in these regions. However, definite positive relation between the number of granted patents and the number of the employed in the scientific field is not revealed in other regions. Moreover, in some regions (Komi Republic, Vologda Oblast, Leningrad Oblast) the first indicator has been decreasing, while the latter has been increasing.
The low level of innovation activity in the Northwestern regions is confirmed by its results presented in table 8.
A steady tendency of retaining innovation output share at less than 1% is inherent in the Republic of Karelia, Arkhangelsk Oblast, Murmansk Oblast. The Komi Republic, Vologda Oblast, Leningrad Oblast, Novgorod Oblast, Pskov Oblast and Saint Petersburg can be noted among other regions with the best performance indicators.
The data on innovation-active organizations (tab. 9) show that except for Saint Petersburg, their share by regions does not exceed the average value across the Northwestern Federal District (11.2%), formed mainly by Saint Petersburg (18.9%).
The Republic of Karelia, Arkhangelsk Oblast, Vologda Oblast, Leningrad Oblast, Murmansk Oblast, Pskov Oblast, Saint Petersburg are among the regions with relatively large number of innovation-active organisations.
When assessing to what extent the data of tables 8 and 9 correlate, it appears that, while the share of innovation products is relatively low, the share of innovation-active organizations is higher in a number of regions: the Republic of Karelia, Arkhangelsk Oblast, Murmansk Oblast, Leningrad Oblast, Pskov Oblast. The situation in the Komi Republic is the reverse. These indicators correlate more or less in the Vologda, Kaliningrad, Novgorod oblasts, Saint Petersburg.
Table 7. The dynamics of the number of granted patents for inventions and utility models
|
Region |
2005 |
2006 |
2007 |
2008 |
2009 |
2010 |
2011 |
|
Russian Federation |
26405 |
28303 |
27742 |
31510 |
36794 |
34814 |
30910 |
|
NWFD |
2651 |
2814 |
2749 |
2665 |
3380 |
2683 |
2740 |
|
Republic of Karelia |
17 |
27 |
15 |
16 |
27 |
26 |
38 |
|
Komi Republic |
49 |
20 |
57 |
45 |
38 |
35 |
36 |
|
Arkhangelsk Oblast |
59 |
39 |
72 |
92 |
71 |
53 |
72 |
|
Vologda Oblast |
114 |
110 |
100 |
86 |
138 |
89 |
86 |
|
Kaliningrad Oblast |
62 |
68 |
60 |
80 |
71 |
80 |
63 |
|
Leningrad Oblast |
140 |
144 |
95 |
126 |
121 |
124 |
123 |
|
Murmansk Oblast |
50 |
54 |
54 |
69 |
61 |
59 |
42 |
|
Novgorod Oblast |
38 |
43 |
45 |
42 |
39 |
28 |
44 |
|
Pskov Oblast |
40 |
43 |
48 |
56 |
66 |
32 |
35 |
|
Saint Petersburg |
2072 |
2237 |
2203 |
2083 |
2748 |
2157 |
2202 |
|
Source: Russia’s regions. Socio-economic indicators: statistical digest. Rosstat. Мoscow, 2008; 2009, 2012. |
|||||||
Tableа 8. Dynamics of innovation activity share, %
|
Region |
2005 |
2006 |
2007 |
2008 |
2009 |
2010 |
2011 |
|
Russian Federation |
5.0 |
4.7 |
4.6 |
5.0 |
4.5 |
4.8 |
6.3 |
|
NWFD |
3.3 |
4.4 |
3.4 |
3.7 |
3.1 |
4.1 |
5.2 |
|
Republic of Karelia |
0.4 |
0.5 |
0.3 |
0.7 |
1.7 |
1.3 |
0.3 |
|
Komi Republic |
- |
4.3 |
5.5 |
4.7 |
0.6 |
3.2 |
7.8 |
|
Arkhangelsk Oblast |
0.4 |
0.3 |
0.1 |
0.1 |
0.3 |
0.4 |
0.2 |
|
Vologda Oblast |
4.5 |
5.6 |
7.5 |
6.2 |
2.6 |
1.6 |
3.7 |
|
Kaliningrad Oblast |
9.2 |
9.5 |
13.4 |
9.6 |
2.8 |
0.1 |
0.2 |
|
Leningrad Oblast |
0.5 |
0.4 |
0.3 |
1.4 |
1.8 |
2.4 |
2.5 |
|
Murmansk Oblast |
3.5 |
0.6 |
0.2 |
0.2 |
0.3 |
0.5 |
0.2 |
|
Novgorod Oblast |
19.1 |
6.7 |
6.9 |
10.4 |
7.5 |
6.9 |
4.8 |
|
Pskov Oblast |
1.0 |
1.3 |
0.9 |
1.2 |
1.4 |
2.7 |
2.3 |
|
Saint Petersburg |
3.1 |
6.1 |
2.3 |
2.8 |
5.5 |
8.0 |
9.0 |
|
Source: Russia’s regions. Socio-economic indicators: statistical digest. Rosstat. Мoscow, 2008; 2012. |
|||||||
Table 9. Dynamics of the share of innovation-active organizations, %
|
Region |
2005 |
2006 |
2007 |
2008 |
2009 |
2010 |
2011 |
|
Russian Federation |
9.7 |
9.9 |
10.0 |
9.4 |
9.3 |
9.5 |
10.4 |
|
NWFD |
9.4 |
11.0 |
9.8 |
8.9 |
9.8 |
9.4 |
11.2 |
|
Republic of Karelia |
5.6 |
6.1 |
5.8 |
6.1 |
5.3 |
6.6 |
9.2 |
|
Komi Republic |
7.1 |
8.1 |
8.1 |
9.7 |
6.3 |
7.5 |
6.1 |
|
Arkhangelsk Oblast |
8.4 |
8.6 |
9.9 |
8.0 |
8.8 |
9.0 |
9.3 |
|
Vologda Oblast |
8.4 |
8.9 |
8.3 |
9.8 |
7.6 |
7.4 |
9.3 |
|
Kaliningrad Oblast |
4.6 |
14.1 |
10.1 |
5.1 |
5.5 |
3.2 |
3.3 |
|
Leningrad Oblast |
6.9 |
8.8 |
6.7 |
5.6 |
8.6 |
9.4 |
9.1 |
|
Murmansk Oblast |
13.5 |
12.3 |
8.0 |
7.9 |
7.6 |
9.7 |
8.5 |
|
Novgorod Oblast |
9.9 |
10.2 |
8.9 |
10.3 |
9.7 |
8.7 |
7.5 |
|
Pskov Oblast |
9.5 |
10.6 |
9.8 |
6.2 |
8.7 |
9.6 |
10.0 |
|
Saint Petersburg |
12.7 |
14.1 |
13.1 |
12.5 |
14.0 |
13.0 |
18.9 |
|
Source: Russia’s regions. Socio-economic indicators: statistical digest. Rosstat. Мoscow, 2012. |
|||||||
The difference between the indicators of innovation products share and the share of innovation-active enterprises is based on different values of shares of innovation products per company in the region.
The analysis of the dynamics of state statistics indicators characterizing research and innovation space, on the example of the NWFD permit the following:
-
• the tendency of decreasing number of the employed in the scientific field;
-
• a slight increase in the results of scientific activity – the number of granted patents for inventions and utility models;
-
• low level of innovation activity.
The state of science and innovation space of the macroregion indicates the need for the development and implementation of measures to change the situation concerning science and innovation activity in the regions, which is inadmissible in the context of the progress towards innovation economy.
References On the transformation of science and innovation space of a macroregion: case study of the northwestern federal district
- Thisse J.-F.The Peripheral role of space in economic thinking. Spatial Economics. 2008. No. 1. P. 84.
- Perroux F. Economic space: theory and applications. Spatial Economics. 2007. No. 2. P. 84.
- Russia’s regions. Socio-economic indicators: statistical digest. Rosstat. Moscow, 2012. P. 397, 816.
- Tsukerman V. A. Topical issues of innovation economic development in Russia’s North. Spatial Economics. 2009. No. 4. P. 71.
- Laritchkin F.D. Modernization of subsoil use based on the formation of competitiveness clusters. Priorities of scientific and technological development of Russia’s North-West. Saint Petersburg, 2011.
- Babina A. Foreign investments as a source of new technologies. Available at: http://www.nbrb.by/bv/narch/339/
- Kudinov A.N., Sulman E.M. High technologies, fundamental and applied investigations, education: proceedings. Ed. by A.N. Kudinov, Matvienko G.G. Integration of knowledge-intensive products on the basis of the regional centre of new technologies. Saint Petersburg: Polytechnic University Press, 2005. V. 1. P. 9.
- Priorities of the scientific and technological development of Russia’s North-West: materials of the session of RAS Northwestern coordination Council on fundamental and applied research, February 16, 2011. Saint Petersburg, 2011.
- Ukrainsky V. N. Modern french Spatial Economics: the proximity theory and typology of localized economic systems. Spatial Economics. 2011. No. 2. P. 119.
- Russia’s regions. Socio-economic indicators: statistical digest. Rosstat. Мoscow, 2008; 2009, 2012
- Russia’s regions. Socio-economic indicators: statistical digest. Rosstat. Мoscow, 2012
- Russia’s regions. Socio-economic indicators: statistical digest. Rosstat. Мoscow, 2011
