Opportunities for and constraints in the modernization development of the regions of the Northwestern federal district

Author: Lastochkina Mariya Aleksandrovna, Shabunova Aleksandra Anatolyevna
Journal: Economic and Social Changes: Facts, Trends, Forecast @volnc-esc-en
Section: Development strategy
Article in issue: 5 (29) т.6, 2013.
Free access
Nation-wide modernization is possible only if it is carried out in all of the regions of a country. And the elaboration of the plans for the country’s (regions’) modernization implies quite reasonably the comparison of the key parameters of the territory’s modernization with those of developed countries, the countries leading in innovation development. Due to significant territorial differences in Russia’s development, it is necessary to differentiate the approach to determining the level of the regions’ modernization. A scientifically proved strategy is required specifically for each federal district and region (supported by the population and implemented by management authorities), such a strategy should take into consideration the problems hindering modernization in the given territory.
Modernization of the regions, socio-economic development, levels of modernization, technological mode, r&d
Short address: https://sciup.org/147223515
IDR: 147223515 | UDC: 338.1(470.2)
Text of the scientific article Opportunities for and constraints in the modernization development of the regions of the Northwestern federal district
Modernization has become a worldwide process and it represents an objectively existing global challenge to each country. Recently, Russia has intensified its work on understanding the parameters of this challenge and working out the strategy of action that will ensure the safety and sustainability of our country’s development.
Modernization has been a widely discussed issue in political speeches, periodicals, and academic research; the country’s leaders set out the objectives, defined the guidelines for further development. The Commission under the President of the Russian Federation on modernization and technological development of Russia’s economy [12], later renamed the Council [13] was established in 2009 in order to promote sustainable technological development of Russia’s economy, improve state management of modernization programmes. These steps are aimed not only at economic modernization and innovation development, but also at the improvement of state management in this sphere, which means the improvement of investment climate in the country, the establishment of public-private partnership. However, favorable business environment has not been created so far, the country’s investment policy has not been stimulated, scientific-technological and economic progress has not been promoted.
Russia in the world
Russia’s modernization, if considered from the point of view of prospects for a long-term development of economy and society, is primarily a process of transforming the country into innovation-driven power, whose products are competitive in international markets. At that, each new stage of modernization is based on technological, organizational and social innovations, on the changes of technological modes (TM). As S.Yu. Glazyev claims, the new sixth TM, coming to replace the fifth one, provides Russia with the opportunities for technological breakthrough and rapid growth on the crest of the new long wave of economic growth [4]. In this case the fundamental factors include the timely establishment of reserves to form the core of the sixth TM and priority modernization of its main industries: electronic industry, software, information technologies, nanotechnologies, genetic engineering.
The analysis of economic climate shows a great disproportion between Russia and the developed countries, due to technological multiformity, passed on from the Soviet times. The fourth technological mode developed in the USSR with 30 years time delay, as compared with the global trajectory of fuel and energy resources. Moreover, in the course of political and social transformations in Russia, little attention was given to the fifth technological mode connected with telecommunications, microelectronics, low-tonnage chemistry. Thus, for example, Russia has been significantly lagging behind other countries in the quality and quantity of computers. The share of our country on the world stage of supercomputers made up 1.6% in 2013, i.e. 4 times less than Japan and 31 times less than the US (tab. 1). Although some positive growth has been registered in the sphere of computer technologies in the Russian Federation, the rate of increase is insufficient for taking the leading positions. China, aspiring to the position of global leader, has been constantly increasing the pace of growth and has risen from the 15th to the 2nd place over the last 13 years. Russia took the 9th place in the rating of supercomputers in 2013, with a significant lag in productivity, i.e. 25-fold lower than in China and 44-fold lower than in the USA.
Communication component of science and technology progress in Russia has been also developing rather slowly: the number of patents in the field of information and communication technologies (ICT), is not only 75 times lower than that in the three leaders (Japan, USA, European Union), it has declined by 11% from 2006 to 2009. Asian countries are increasingly expanding their domination spheres. For instance, in 2010 Japan caught up with the US, an absolute leader; China, judging by its growth rates, will do the same in the next 10 years (tab. 2) .
Analysis of R&D expenditures per capita in purchasing power parity (PPP) shows that Russia lags behind Sweden, USA, Japan, and Germany 5–6 times, from the European Union – 2.7 times (tab. 3) . And although Russia has experienced almost a 3-fold increase in expenses over the last 10 years with 71.6 to 235.9 US dollars per capita, growth rate is still lower than in China (for 9 years, the expenses have increased more than 6-fold), which also has one of the lowest values of this indicator.
Table 1. The largest holders of supercomputers (500 of the most powerful socially well-known world computer systems) [3]
|
No. |
10 leading countries |
1997 |
2000 |
2004 |
2007 |
2013** |
|||||
|
Number (items) |
TFlops |
Number (items) |
TFlops |
Number (items) |
TFlops |
Number (items) |
TFlops |
Number (items) |
TFlops |
||
|
1 |
USA |
265 |
10 |
258 |
57 |
262 |
782 |
280 |
4436 |
252 |
152701 |
|
2 |
China |
– |
– |
2 |
0.135 |
14 |
43 |
13 |
175 |
66 |
85176 |
|
3 |
Japan |
87 |
0.381 |
62 |
12 |
35 |
124 |
23 |
393 |
30 |
24501 |
|
4 |
Great Britain |
24 |
0.607 |
28 |
6 |
34 |
108 |
44 |
526 |
29 |
11032 |
|
5 |
France |
19 |
0.677 |
20 |
3 |
19 |
39 |
13 |
198 |
23 |
10881 |
|
6 |
Germany |
45 |
0.187 |
65 |
11 |
37 |
69 |
23 |
317 |
19 |
13521 |
|
7 |
India |
– |
– |
– |
– |
6* |
10* |
8* |
87* |
11 |
3518 |
|
8 |
Canada |
7 |
0.124 |
9 |
0.941 |
7* |
23 |
10* |
80 |
9 |
2288 |
|
9 |
Russia |
1* |
0.024* |
– |
– |
2* |
2* |
5* |
44* |
8 |
3475 |
|
10 |
Sweden |
8 |
0.215 |
5 |
0.580 |
3 |
6 |
10 |
88 |
7 |
1534 |
|
TFlops – ( Т rillion FL oating point OP eration TFlops = 1012 Flops Teraflops) – peak performance – theoretical performance limit (expressed through floating point operations) for the given processors. Letters of references: * The country is not among the leaders in the given year. ** Sorted out by Number in 2013. |
|||||||||||
Table 2. Number of patents in the field of ICT – the applications filed in accordance with the Patent Cooperation Treaty [2]
|
2000 |
2005 |
2006 |
2007 |
2008 |
2009 |
2010 |
|
|
Japan |
4761 |
11764 |
11986 |
11997 |
11001 |
12000 |
15189 |
|
USA |
18825 |
19514 |
20867 |
19238 |
15743 |
14714 |
15001 |
|
EU (27) |
12524 |
13233 |
13723 |
13939 |
13103 |
12232 |
11942 |
|
China |
231 |
1936 |
2671 |
3378 |
3207 |
4589 |
5932 |
|
Germany |
3960 |
3994 |
4038 |
4204 |
3896 |
3780 |
3817 |
|
France |
1498 |
2065 |
1890 |
1995 |
2022 |
1956 |
1995 |
|
Great Britain |
2171 |
2063 |
2238 |
2149 |
1922 |
1641 |
1561 |
|
Canada |
924 |
1139 |
1166 |
1310 |
1042 |
982 |
1046 |
|
Sweden |
1216 |
850 |
1085 |
1229 |
1180 |
1029 |
941 |
|
Russia |
179 |
210 |
211 |
191 |
173 |
187 |
203 |
|
2000 |
2005 |
2006 |
2007 |
2008 |
2009 |
2010 |
|
|
Sweden |
– |
1313.6 |
1305.5 |
1463.8 |
1340.1 |
1331.4 |
1399.7 |
|
USA |
949.4 |
1182.4 |
1259.8 |
1334.0 |
1318.4 |
1319.2 |
1330.6 |
|
Japan |
777.4 |
1082.7 |
1156.0 |
1164.7 |
1076.4 |
1100.7 |
– |
|
Germany |
636.9 |
851.2 |
899.8 |
998.2 |
1005.9 |
1055.3 |
1121.8 |
|
France |
542.8 |
661.6 |
690.0 |
725.8 |
767.4 |
770.3 |
796.2 |
|
Canada |
543.9 |
739.1 |
753 |
747.7 |
732.7 |
722.3 |
703.5 |
|
EU (27) |
381.7 |
512.5 |
544.2 |
588.3 |
595.2 |
607.8 |
632.9 |
|
Great Britain |
473.1 |
610.4 |
635.1 |
641.7 |
634.6 |
634.5 |
631.7 |
|
Russia |
71.6 |
159.8 |
185.9 |
210.6 |
234.7 |
229.5 |
235.9 |
|
China |
21.5 |
65.9 |
77.4 |
90.9 |
115.4 |
132.9 |
– |
|
Sorted by the year 2010. |
|||||||
The share of expenditures of private sector on R&D 3–5 times exceeds public spending in the developed countries of the Organization for Economic Cooperation and Development (OECD), and in China (fig. 1) . In Russia, on the contrary, this ratio is 1 to 2.5. This is inconsistent with the world trend (see fig. 1). The government finances more than half of the R&D carried out by the private sector. The indicator makes up only 7% for OECD, for China – less than 5%. The main reason of such a situation in the Russian Federation consists in the lack of incentives of the private capital to invest in research and development. The share of budget financing for the last 10 years has increased from 54.8% in 2000 to 67.1% in 2010. This indicates that business is not interested in technological innovation and does not play an important part in choosing and implementing the technologies in production, which is the core of innovation policy.
Methodological aspects of assessing the territories’ modernization level
In light of the above aspects, special importance is attached to the issues of innovation and modernization development of Russia and each of its regions. China, being rather successful in enhancing the economy and prestige of the country in recent years, at all costs attempts to come into the world leading markets, striving to shift from the agrarian-industrial society to the information knowledge-based society. In this regard, a lot of analytical and forecast research has been carried out by Chinese scientists. At the beginning of the 21st century the Chinese Academy of Sciences (CAS) paid special attention to the issues of modernization in the world and in China [14].
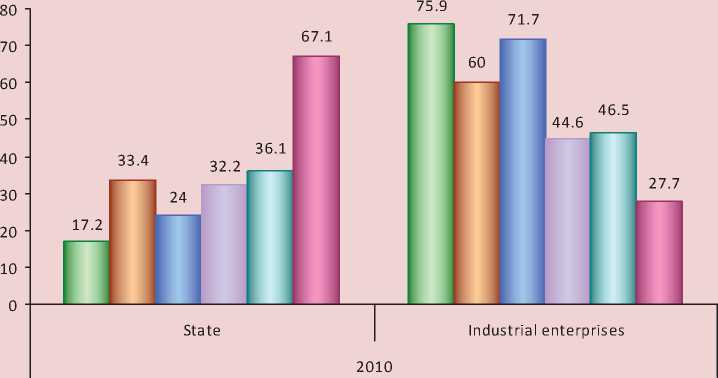
□ Japan* □ USA □ China* □ Great Britain □ Canada □ Russia
* Data for 2009.
Researchers at the China Center for Modernization Research (CCMR) of CAS proposed a comprehensive set of quantitative goals for development, according to the world level of economic modernization of the 20 most developed countries. Since 2001, CCMR annually calculates the indices and phases of the two stages of modernization and their integrated index for 131 countries (including Russia), ranks them and forecasts the main guidelines for the evolution of modernization in the world. The CCMR methodologies can be applied in the measurement of the state and dynamics of modernization processes in Russia’s regions. The Centre for the Study of Social and Cultural Change of the Institute of Philosophy of RAS (CSSCC IP RAS, N.I. Lapin) made the most significant contribution to the adaptation of Chinese scientists’ methodology for measuring the processes of modernization in Russia’s regions [7], supplementing the typology of qualitative states of modernization level of Russia’s regions with the types of modernization level, which include the measurement and evaluation of both the level and phase of each of the two stages of modernization – primary and secondary.
The scoring model of primary modernization (PM) was developed with regard to the indicators proposed by A. Inkeles and D. Smith [1]. It takes into account 10 indicators characterizing the three spheres of life of industrial society: economic sphere, social sphere, and the level of knowledge. The average values of indicators achieved by 1960 in the 19 most developed countries were adopted as standard. The ratio of actual value of the indicator to the standard value in a particular year is taken as the value of estimated indicator.
The scoring model of secondary modernization (SM) refers to the information society or knowledge-based society. The SM process began about 30 years ago, but its laws and specifics are still taking shape.
The assessment of SM includes four groups of indicators (innovation in knowledge, transfer of knowledge, quality of life, and quality of economy), comprising 16 separate parameters. Integrated modernization (IM) is understood as a set of state of the two above mentioned stages, which describes the nature of their mutual coordination in a particular country (region) and the difference from the advanced world level. The model of assessing IM takes into account 12 indicators: 10 of them are used in the models of PM and SM, and two were introduced in addition (tab. 4) .
Modernization level in Russia’s federal districts
According to calculations (performed by the authors using a specially developed and patented information analytical system “Modernization”, ISEDT RAS) the assessment of the primary modernization indices shows the positive dynamics in the growth of the index during the whole analyzed period (2000–2010) in four federal districts of Russia: the Central, Northwestern, Far Eastern and Ural. In 2009–2010 the PM index declined slightly (from 0.2 to 1.7 percentage points) in the Volga, Siberian, Southern, North-Caucasian federal districts, the reason for this lies apparently in the financial and economic crisis, marked by declining socio-economic indicators.
After 10 years, the gaps in the level of primary modernization between the districts remain steadily at 6 percentage points, while only in the Central Federal District the national level is exceeded. By 2008 the level of primary modernization in all the territories under consideration was above average (index ranged from 91 to 99.9), thus, the federal districts lack from 6.4 to 0.1 p.p to the full implementation of primary modernization. According to the conducted analysis, the implementation of the primary modernization in most districts is impeded by the low life span of the population.
Table 4. Set of indicators used when calculating the indices and phases of PM, SM and IM
|
No. |
Indicators |
Association with indices and phases |
|||||||||
|
PМ |
SМ |
IМ |
PМ-phase |
SМ-phase |
|||||||
|
KI |
KT |
LQ |
EQ |
EI |
SI |
KI |
PFM |
PSM |
|||
|
1. |
Gross regional product (GRP) per capita, US dollars |
+ |
+ |
+ |
|||||||
|
2. |
Share of persons, employed in agriculture, as a percentage of the total number of employed population* |
+ |
+ |
||||||||
|
3. |
Share of value added in agriculture in relation to GDP* |
+ |
+ |
||||||||
|
4. |
Share of value added in the services sector as a percentage of GDP |
+ |
+ |
||||||||
|
5. |
Share of urban population as a percentage of the total population |
+ |
+ |
+ |
|||||||
|
6. |
Number of doctors per 1000 population |
+ |
+ |
+ |
|||||||
|
7. |
Infant mortality (aged under 12 months), per 1000 births* |
+ |
+ |
||||||||
|
8. |
Life expectancy, years |
+ |
+ |
+ |
|||||||
|
9. |
Literacy rate among adults, % |
+ |
|||||||||
|
10. |
Share of students attending higher education institutions, among the population aged 18–22, % |
+ |
+ |
+ |
|||||||
|
11. |
Share of R&D expenditures in GRP (GDP), % |
+ |
+ |
+ |
|||||||
|
12. |
Number of scientists and engineers per 10 thousand people |
+ |
|||||||||
|
13. |
Number of persons who submitted patent applications, per 1 million people |
+ |
+ |
||||||||
|
14. |
Share of people attending vocational education institutions, among the population aged 12–17, % |
+ |
|||||||||
|
15. |
Number of TV-sets per 100 households |
+ |
|||||||||
|
16. |
Number of personal computers per 100 households |
+ |
+ |
||||||||
|
17. |
Energy efficiency: GDP (GRP) per capita/cost of energy consumption per capita, fold |
+ |
|||||||||
|
18. |
Gross national product (GNP) per capita at purchasing power parity, US dollars |
+ |
+ |
||||||||
|
19. |
Share of value added of the real sector (agriculture and industry) in GRP (GDP)*, % |
+ |
+ |
||||||||
|
20. |
Share of persons, employed in the real sector in the total employment*, % |
+ |
+ |
||||||||
|
21. |
Share of persons, employed in the services sphere in the total employment, % |
+ |
|||||||||
|
22. |
Ecological efficiency: GDP per capita/energy consumption per capita (price in US dollars), % |
+ |
|||||||||
|
23. |
Ratio of value added in agriculture to value added in industry, times |
+ |
|||||||||
|
24. |
Ration of employment in agriculture to employment in industry |
+ |
|||||||||
|
25. |
Share of innovation products, works, services, as a percentage of the total amount of shipped products, % |
+ |
|||||||||
Notes: + indicator participates in the calculation of the index.
Sub-indices SM and IM: KI – knowledge innovations, KT – knowledge transfer, LQ – life quality, EQ – economy quality, EI – economic index, SI – social index, KI – knowledge index.
* Reverse indicator.
Source: The table was worked out by the author on the basis of [7, 14].
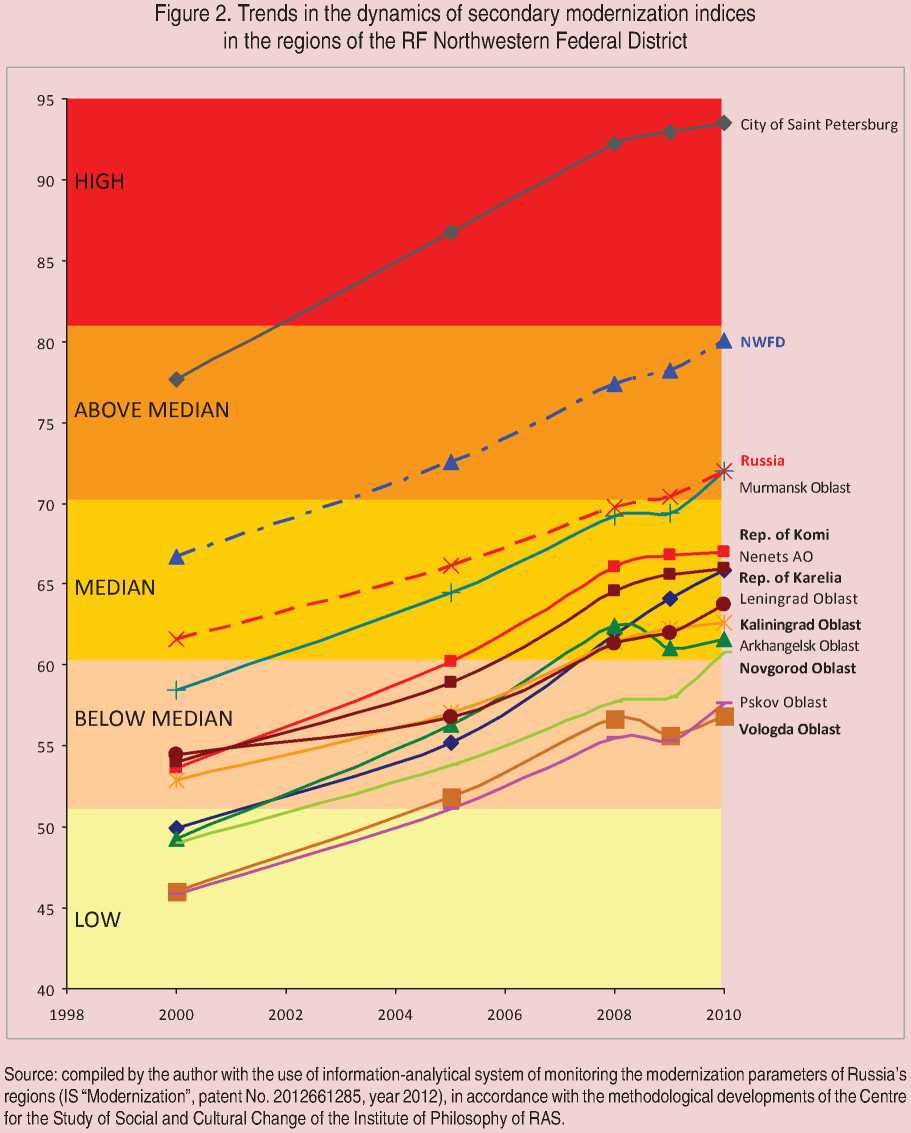
The analysis of the second period of regional modernization, which is more advanced and science-intensive and which involves greening and globalization, has revealed that most of the territories of Russia are not ready to meet the world standards. In 2000–2010 Russia’s trend of SM indices increased from 61 to 72, thereby it managed to overcome the medial threshold, and the Russian Federation caught up with the Czech Republic. The prolongation of the data shows that by 2020 Russia can join the group of developed countries, in which the SM index is in the range from 81 to 120. However, at the same time, the applied standards are being enhanced, because the indicative socioeconomic indicators of developed countries are increasing every year. Thus, considering the competition of countries in overcoming the threshold, the rate of growth in Russia may prove insufficient for modernization breakthrough. Regional gaps between the SM indices were more significant than those between the PM indexes. In 2010, as well as in PM, the leaders in the Russian Federation were the cities of Moscow and St. Petersburg, the list was supplemented with the Moscow, Tomsk oblasts and the Central Federal District. A significant part of the regions had the average level of SM, and in half of them it was below the median level (tab. 5) .
Thus, the process of regional modernization in Russia is uneven and asymmetrical, the index of secondary modernization often differs significantly even in adjacent territories.
For example, St. Petersburg outpaces the Leningrad Oblast by 29 points; Moscow is getting ahead of the Moscow Oblast by 23 points. It would seem that the difference is great in both cases, however, the Leningrad Oblast occupies only the 33rd place in the national rating and meets only the median level of SM (SM index is 63), while the Moscow Oblast – 3rd place (SM index is 84). In the first case, a lot of efforts will be required to increase the level of SM, namely:
– to increase the share of expenditures on research and development (R&D) in GRP (2–2.5 times);
– to increase the number of scientists and engineers, fully engaged in R&D per 10 thousand population (2–2.5 times);
– to increase the number of the country’s residents, who have filed patent applications, by 1 million people (6–8 times);
– to increase the number of personal computers per 100 households (2 times);
– to increase GRP per capita (4–5 times);
– to increase of GRP per capita at purchasing power parity (2.5–3 times);
– to reduce the share of value added in the material sphere (2 times);
– to reduce the share of persons employed in the material sphere (1.5–2 times).
Since integrated modernization is a coordinated interaction of both stages, the rating of Russia’s regions in many respects corresponds to their distribution in the two previous cases.
Table 5. Hierarchy of the levels of secondary modernization of Russia’s regions (2010)
|
Level |
Low |
Median |
High |
||
|
Below median |
Median |
Above median |
|||
|
Index |
30–50 |
51–60 |
61–70 |
71–80 |
Over 81 |
|
Federal District |
– |
Southern (59) North-Caucasian (54) |
Ural (66) Volga (64) Siberian (63) Far Eastern (62) |
Northwestern (79) |
Central (84) |
|
Number of RF regions |
3 |
38 |
30 |
9 |
4 |
|
Source: compiled by the author with the use of information-analytical system of monitoring the parameters of Russian regions’ modernization (IS “Modernization”, patent No. 2012661285, 2012), in accordance with the methodological developments of the Centre for the Study of Social and Cultural Change of the Institute of Philosophy of RAS. |
|||||
The Central and Northwestern federal districts became leaders again, reaching the average level (interval from 64 to 77) by 2005 and 2008, respectively. Starting from 2009, Russia is complying to this standard, and the other 6 federal districts (Ural, Far Eastern, Volga, Siberian, Southern, North-Caucasian) – to a level below average (interval from 48 to 63).
The definition of the phase of Russia’s primary modernization shows that in 10 years it has increased by 0.5, shifting from a phase of maturity to the phase of transition to the secondary modernization. Three more federal districts have the values similar to the national ones, however, their SM-phases are significantly differentiated: from 1.5 in the Central FD to 0 in the Ural FD. The national values and the values in the Northwestern FD are equal to 1, this corresponds to the starting phase. However, not all the federal districts made such a leap, a large part of them (Far Eastern, Volga, Siberian, Southern, North-Caucasian FD) are in the phase of maturity, i.e. primary modernization has not yet entered a phase of transition to the secondary modernization. A relatively high employment in agriculture, which does not comply with the standards of industrialized countries in the early 1960s, is a limitation impeding the onset of this phase.
Modernization level in the regions of the Northwestern Federal District
For obtaining a more detailed picture of modernization in the regions within the Federal District let us study and compare the level of primary, secondary and integrated modernization in the regions of the Northwestern Federal District. The index of primary modernization of NWFD has increased by nearly 8% for 10 years, and in 2010 it was 99.7 that corresponds to the second place in the general rating of Russia’s federal districts (the Central Federal District occupies the first place). By 2010, nine out of ten accounted indicators of PM have been realized by 100% in the district in general. Full implementation (achievement of 100%) is impeded by an insufficiently high life expectancy (LE) of population (mainly due to the mortality of working-age men). A similar situation is observed in the Murmansk Oblast. In the Vologda, Kaliningrad, Novgorod, Pskov oblasts and in the Republic of Karelia the limiting factor, besides LE, is low income per capita. The constraining factors in the Arkhangelsk, Leningrad oblasts, Nenets Autonomous Okrug and the Komi Republic are low life expectancy and a high share of value added in the services sector with regard to GDP (below 45% by the standards of PM). It is not until 2020 that these “hindrances to modernization” will be possible to eliminate, even with great effort. Saint Petersburg is the only territory, which has already achieved full implementation of PM by 2008.
Eight subjects of the district experienced a decrease in the PM indices by 0.1–0.7 units in 2010 compared with 2009. It should be noted that growth rates of the index, given its low values, in a number of regions (Pskov Oblast, Republic of Karelia, Nenets Autonomous Okrug) are also low. For example, the ‘outsider’ region, Nenets Autonomous Okrug, has the PM index equal to 92, and its growth for 10 years was only 1 point. If current trends are maintained, the speedy completion of this stage of modernization will be problematic, which can be seen from the forecast calculations (according to the inertia scenario, tab. 6 ).
While analyzing the NWFD regions, we should point out that another five territories have the median level of SM, the first region (Murmansk Oblast) is above the median level, Saint Petersburg has the high level, and the three regions of the Federal District have the level below median (fig. 2) .
The positive dynamics of the NWFD regions in the period from 2000 to 2010 is obvious; all the territories have enhanced their level of secondary modernization. As a result, five regions (Republic of Karelia, Arkhangelsk, Novgorod, Vologda, Pskov oblasts) recovered from the low level, and first approached the
Table 6. Prospects for the modernization of the regions in the Northwestern Federal District
A phase of modernization (primary and secondary) is of fundamental importance. According to the methodology that we use, the phase of SM can be defined only provided that the territory enters the transitional phase of PM. In 2000, NWFD on the whole and another 5 subjects corresponded to the phase of transition to SM, however every year their number was reducing, and by 2010 three regions have remained (fig. 3) . Such trends can be explained by the increase in the ratio of value added in agriculture to GDP, which should be less than 5%, and also by the increase in the rate of employment in agriculture (less than 10%). Thus, only the Komi Republic and Arkhangelsk Oblast, as well as NWFD as a whole, were in the preparatory phase of SM by the end of the analyzed period, Saint Petersburg was in a more advanced phase, i.e. in the phase of development.
The intentions to implement new megaprojects should make a powerful impetus in the leading branches of the oblast’s industry: mechanical engineering, metallurgy, wood processing, as well as in research institutions [9].
The strategy for the development of the Vologda Oblast should be based on the principle of growth and concentration of scientific knowledge, and production capacity as well, in the most promising spheres, which form the centres of socio-economic efficiency [15].
Figure 3. Phases of secondary modernization of the territories in the Northwestern Federal District, which have achieved the transition phase of primary modernization
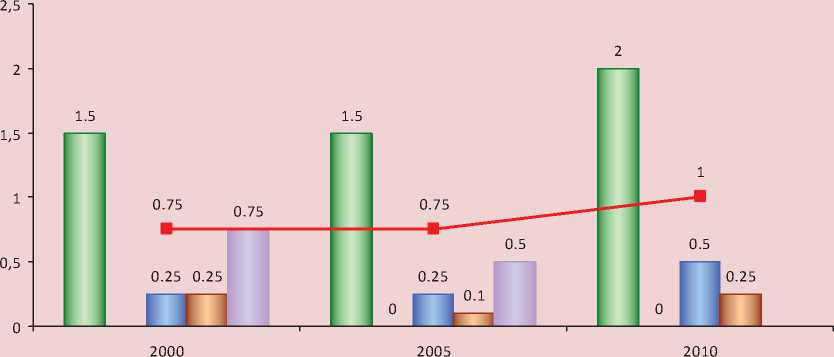
■ ■ Saint Petersburg I I Nenets Autonomous Okrug
E—] Komi Republic L -I Arkhangelsk Oblast
I__ Murmansk Oblast — ■ — NWFD
Source: compiled by the author with the use of information-analytical system of monitoring the modernization parameters of Russia’s regions (IS “Modernization”, patent No. 2012661285, year 2012), in accordance with the methodological developments of the Centre for the Study of Social and Cultural Change of the Institute of Philosophy of RAS.
The pace and orientation of innovation modernization in the Murmansk Oblast, where the industrial sector is formed by several large and medium-sized resource corporations, largely depend on the internal corporate policy. Here the success of innovation modernization depends on the joint actions of local authorities and business community. Financial resources for innovation modernization are the scarcest in the regions-recipients of financial assistance from the federal budget. Therefore, they should efficiently use the potential of Russian and international development institutions to implement the process of intellectual transformation of economic system [10]. It is necessary to create the programme for the development of Northern regions in the era of knowledge economy, which would be facing the challenges of innovation development, facilitate the exchange of information and knowledge within NWFD, between the centre and periphery.
Thus, all the constituent territories of NWFD (and Russia, for sure) have similar barriers, consisting in the low level of innovation modernization. Regional policy should be aimed first and foremost at creating conditions for extensive cooperation of regions in the development of territories, for working out the solutions to common problems and for the implementation of joint projects [10]. In order to succeed in the formation of innovation economy it is necessary to establish a national innovation system of institutions, social practices, strengthening the achieved results and creating the actual opportunities for moving along the innovation-driven path of development. In this case, it is possible to overcome the main obstacle, consisting in the absence of qualified managers rather than in the lack of finance, through the joint work of scientists, entrepreneurs, innovators and representatives of power.
Modernization is a strategic task of national and regional development. As the analysis shows, all the NWFD regions are lower than the national trend, except for Saint Petersburg, which on its own “pulls” the federal district to the position above the national average level. The shift from PM to SM should become the main principle of modernization of the NWFD constituent territories in the coming years. It is natural to assume that even the neighboring territories would require different time-frames for achieving it. Innovation, knowledge and human resources should become the main sources of energy, which should help in a difficult competition of the regions in the implementation of modernization [6]. Russia’s regions require the mixed-type modernization with efficient application of advanced foreign achievements and opportunities of national research and innovation potential.
Conclusion
The evaluation of modernization carried out in this study for each region and federal district of Russia shows that
– modernization processes in the country’s regions are going on very unevenly;
– primary modernization in most of the territories has been carried out by 95–99%;
– major difficulties are associated with secondary and integrated modernization. In these kinds of modernization the processes of economic and cultural-cognitive modernization are the weak spots.
Given the basic factors of Russia’s spatial development, the prospects of socio-economic transformation in Russia’s regions will have inertial character. There will be no rapid changes in the next decade due to the fact that the priorities of regional policy have not been established yet. The same territories will remain points of growth (Moscow, Saint Petersburg, the leading regions of the fuel and energy complex); they currently occupy a leading position in the spatial modernization of Russia. The numerous group of regions with a medium level of development will remain, with a possible slight movement up or down. Underdeveloped constituent entities of the Russian Federation will be a burden to the country’s budget. In general, the inequality among the regions will increase. Investments in more developed areas will facilitate the modernization development of Russia as a whole. The problems of lagging regions should be solved not only by stimulating regional policy, but primarily by social policy aimed at enhancing human capital.
References Opportunities for and constraints in the modernization development of the regions of the Northwestern federal district
- Inkeles A., Smith D. Becoming modern -individual changes in six developing societies. Cambridge, Mass.; Harvard University Press, 1974.
- OECD iLibrary. Available at: http://www.oecd-ilibrary.org/statistics
- TOP 500. Available at: http://top500.org/
- Glazyev S.Yu. Capabilities and limitations of the technological and economic development of Russia in the conditions of structural changes in the global economy. Available at: http://spkurdyumov.narod.ru/glaziev.htm
- Glazyev S.Yu. Theory of long-term technological and economic development. Moscow: Vladar, 1993.
- Gulin K.A. On the issue of socio-economic modernization of Russian regions. Economic and social changes: facts, trends, forecast. 2012. No. 4. P. 35-49.
- Lapin N.I. On the experience of the phased analysis of modernization. Obshchestvenniye nauki i sovremennost. 2012. No. 2. P. 53-57.
- Lastochkina M.A. Socio-cultural factors of region modernization. Fundamental research. 2012. No. 3 (2). P. 346-351.
- Pilyasov A.N. The outlines of the strategy for the development of Russia’s Arctic zone. Arctic: ecology and economics. 2011. No. 1. P. 38-47.
- Pilyasov A.N. Forecasted development of Russian Arctic regions: transformation of space, external relations and lessons of the foreign strategies. Arctic: ecology and economics. 2011. No. 2. P. 10-17.
- Semenova Ye.A. Role of the state in stimulating innovations. Problems of the national strategy. 2010. No. 4. P. 119-133.
- Decree No. 579 “On the Commission under the President of the Russian Federation on the modernization of the economy and innovation development of Russia” dated May 20, 2009. Available at: http://www.garant.ru/products/ipo/prime/doc/95621/
- Decree No. 878 “On the Council under the President of the Russian Federation on the modernization of the economy and innovation development of Russia” dated June 18, 2012. Available at: http://base.garant.ru/70190762/#block_1000
- Chuanqi He. Survey report on modernization in the world and in China (2001-2010). Translated from English, under general editorship of N.I. Lapin, foreword by N.I. Lapin, G.A. Tosunyan. Moscow: Ves Mir, 2011.
- Shabunova A.A., Lastochkina M.A. Through crisis to modernization. Philosophical sciences. 2012. No. 7. P. 20-31.
