Optimal operation of integrated energy system considering demand response under carbon trading mechanism

Author: Li Jie
Journal: Бюллетень науки и практики @bulletennauki
Section: Технические науки
Article in issue: 8 т.8, 2022.
Free access
The integrated energy system (IES) is an effective way to achieve the “carbon neutrality and emission peak” goal. In order to further explore the role of the adjustable potential of demand side on carbon emission reduction, an optimized operation model of IES considering the demand response under the carbon trading mechanism is proposed. Firstly, according to the characteristics of load response, the demand response is divided into two types: price-type and substitution-type. The price-type demand response model is established on the basis of price elasticity matrix, and the substitution-type demand response model is constructed by considering the conversion of electricity and heat. Secondly, base-line method is used to allocate free carbon emission quota for the system and considering the actual carbon emissions of gas turbine and gas boiler, a carbon trading mechanism for the IES is constructed. Finally, a low-carbon optimal operation model of IES is established, whose objective is to minimize the sum cost of energy purchase, cost of carbon transaction and cost of IES operation and maintenance. The effectiveness of the proposed model is verified through four typical scenarios. By analyzing the sensitivity of demand response, heat distribution ratio of gas turbine and the operating state of the system under different carbon trading prices, it is found that reasonable allocation of price-type and substitution-type demand response and heat production ratio of gas turbine is beneficial to improve the operating economy of the system. Making reasonable carbon trading price can realize the coordination of system economy and low carbon.
Carbon trading mechanism, demand response, integrated energy system, optimized operation
Short address: https://sciup.org/14125302
IDR: 14125302 | UDC: 629.064.5 | DOI: 10.33619/2414-2948/81/38
Оптимальная работа интегрированной энергетической системы с учетом реакции спроса в рамках механизма торговли квотами на выбросы углерода
Интегрированная энергетическая система является эффективным способом достижения цели «двойного углерода». Для дальнейшего изучения влияния ее регулируемого потенциала со стороны спроса на сокращение выбросов углерода была разработана оптимизированная модель работы интегрированной энергетической системы с учетом реакции на спрос в рамках механизма торговли выбросами углерода. Во-первых, в соответствии с характеристиками реакции на нагрузку, реакция спроса делится на два типа: тип цены и альтернативный тип, и, соответственно, устанавливается модель реакции спроса ценового типа на основе матрицы ценовой эластичности и модель реакции альтернативного спроса с учетом взаимного преобразования электрической энергии и тепловой энергии в энергетическом секторе. Во-вторых, использовать базовый метод для бесплатного распределения квот на выбросы углерода для системы и учитывать фактические выбросы углерода газовых турбин и газовых котлов для создания механизма торговли выбросами углерода для интегрированной энергетической системы; принимая минимальную сумму стоимости размеров в качестве целевой функции, устанавливается низкоуглеродная оптимизационная модель работы интегрированной энергетической системы, и обоснованность предложенной модели проверяется с помощью четырех типичных сценариев. Путем анализа чувствительности реакции спроса, коэффициента распределения тепла газовых турбин и рабочего состояния системы при различных торговых ценах на выбросы углерода было обнаружено, что разумное распределение основанных на цене и альтернативных ответов спроса и коэффициента производства тепла газовыми турбинами способствует улучшению операционной экономики системы и разработке разумной торговли выбросами углерода. Цена может реализовать синергию системной экономики и низкого уровня выбросов углерода.
Text of the scientific article Optimal operation of integrated energy system considering demand response under carbon trading mechanism
Бюллетень науки и практики / Bulletin of Science and Practice Т. 8. №8. 2022
UDC 629.064.5
Coal, as the raw material for industrial production and the most basic energy in my country, is the most economical and safest mineral resource that can be used cleanly and efficiently. The coal industry has always played an energy pillar role, not only providing guarantees for the stable and rapid development of the national economy and society, but also supporting national energy security and stable supply [1-2]. During the "Thirteenth Five-Year Plan" period, under the background of the continuous promotion of supply-side structural reform as the country's continuous promotion policy, the coal industry will fully implement the new energy security strategy, and promote its own consumption revolution, supply revolution, technological revolution, institutional revolution, and international cooperation. Fully implement the green mining and clean and efficient utilization of coal, support the comprehensive optimization of my country's energy structure and the construction of a modern energy system with complementary multi-energy, and promote the high-quality development of the national economy and society [3].
The carbon trading mechanism can optimize the allocation of system resources and promote energy conservation and emission reduction [4-6]. Reference [7] allocates initial carbon emission rights free of charge according to the actual output of nuclear power units, thermal power units and wind power units, and calculates carbon transaction costs by considering the actual carbon emissions of thermal power units, effectively balancing economic and low-carbon benefits; Reference [8] introduced the carbon trading mechanism into virtual power plants, based on the baseline method and allocated free initial carbon quotas to carbon sources according to the output of renewable energy units, which increased the total amount of renewable energy consumption. Demand response (DR) can enhance the two-way interaction between the energy supply side and the energy consumption side. Reference [9] introduces a price elasticity matrix to describe DR behavior, and analyzes the effectiveness of DR in alleviating system peak regulation pressure; Reference [10] established the DR model of electricity and gas loads based on the price elasticity matrix method, and established the DR model of heat load considering the fuzzy perception and delay of heat load, and verified that the model can improve energy utilization efficiency; Reference [11] divides the electrical load into three types: reduction, transfer, and replacement. The compensation cost is planned uniformly according to the response quantity, and the saturation and difference indexes are used to measure the user satisfaction. However, the above literatures only analyze the carbon trading mechanism, or only consider the demand response, which is not conducive to the coordination of low-carbon and economical systems.
To sum up the current situation and problems, this paper proposes an optimal operation model of the electric-heat integrated energy system considering DR under the carbon trading mechanism. First, demand response is divided into price type and substitution type; Secondly, construct a carbon trading mechanism for the integrated electric-heating energy system; Finally, through the simulation of the example, it is verified that the demand response is considered under the carbon trading mechanism, which can realize the economical and low-carbon performance of the integrated electricheating integrated energy system by shaving peaks and filling valleys. It provides a reference for the low-carbon economic operation of the electric heating integrated energy system.
IEHS can realize the complementary synergy of electric energy and thermal energy, improve energy utilization efficiency, and ensure continuous and reliable energy supply while satisfying users' cascade utilization of various energy sources.
This paper constructs an IEHS architecture with demand response, as shown in Figure 1. In this system, electric energy and gas energy are supplied by the upper-level power grid and gas network respectively, and gas purchased from the upper-level gas network is used to supply combined heat and power (CHP) and gas boiler (GB), and the remaining electric energy can be sold to the upper power grid; The energy coupling equipment includes CHP, heat pump (HP) and GB, which can realize bidirectional flow of electric and heat energy; CHP is composed of gas turbine (GT), waste heat boiler (WHB) and organic Rankine cycle (organic Rankine cycle). Rankine cycle, ORC) low temperature waste heat power generation device, the operation mode is thermo-electrolysis coupling, which can adapt to different operating conditions of the system; HP and GB absorb wind power and take part of the heat load. The introduction of DR can smooth the fluctuation of the load curve, realize the interactive coupling of electricity and heat, cut peaks and fill valleys, and reduce operating costs.
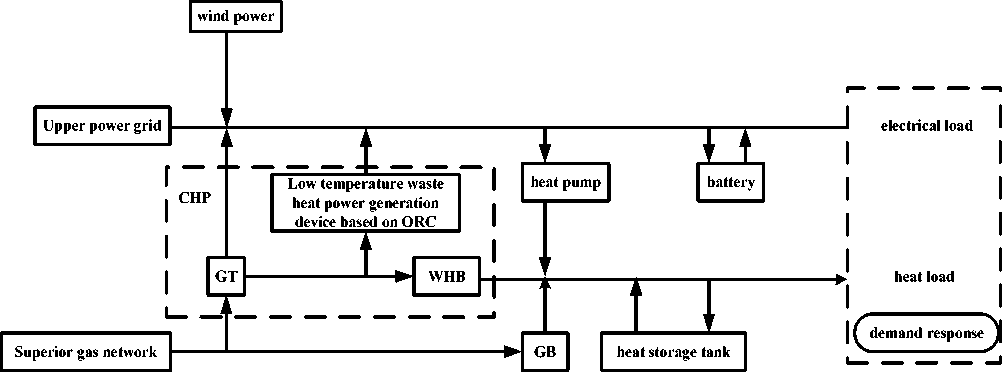
Figure 1. Structure of IEHS
DR means that users adjust their energy consumption behavior according to the electricity price or incentive mechanism, and participate in the interaction of the grid, so as to optimize the load curve and improve the operating efficiency of the system. According to the characteristics of load response, DR is divided into price demand response and substitution demand response.
Different types of loads have different sensitivities to the same electricity price signal. Pricebased demand-response electricity loads are divided into curtailable load (CL) and shiftable load (SL), and the two types of loads are modeled separately below.
-
1) CL characteristic analysis and modeling.
CL chooses whether to reduce its own load by comparing the changes in electricity prices in the current period before and after DR. The DR characteristics are described by the price demand elasticity matrix. The element in the tth row and the jth column in the elasticity matrix E(t , j), that is, the elasticity coefficient of the load at time t to the electricity price at time j, is defined as:
et,j =
^PUPQ bpj/pj
In the formula: is the load change at time t after DR; is the initial load at time t; is the change in electricity price at time j after demand response; is the initial electricity price at time j. Then, the curtailable load change at time t after DR is:
^PcL,t
0° = rCL,t
к
pj-pj ]
ECL ( t,J) p 0 ]
In the formula: is the initial load reduction at time t; is the CL price demand elasticity matrix, which is a diagonal matrix; ρ_j is the electricity price at time j.
-
2) SL characteristic analysis and modeling.
Transferable load refers to the load that users can flexibly adjust their working hours in response to electricity prices according to their own needs. Using the peak-to-valley time-of-use price as a signal, users can be guided to transfer the load from the peak period to the flat valley period. In the same way, using the price elasticity matrix to describe the DR characteristics, the transferable load change at time t after DR is:
^t
0°
= tSL,t
к
p pj-pj]
ESL(t,j) ° pj 1
In the formula: is the initial transferable load at time t; is the SL price demand elasticity matrix.
For a certain type of heat load that can be directly supplied by heat energy or electric energy, electricity can be consumed during low electricity price periods, and heat energy can be directly consumed during high electricity price periods to meet its own needs, thereby realizing the mutual substitution of electricity and heat energy. The replaceable load (RL) model is:
ALpe = Se^h
_ ^e P e
£e,h vhph
The negative sign in formula (4) indicates that the reduction of the replaceable electrical load corresponds to the increase of the replaced heat load. For this type of load, the maximum alternative load constraints need to be considered:
r,e r,e r,e min „t „max r,h r,h r,h min „t „max
In the formula: and are the minimum and maximum replacement quantities of the electrical load that can be replaced; and are the minimum and maximum replacement quantities of the heat load that can be replaced, respectively.
The carbon trading mechanism is a mechanism for trading carbon emission rights as a commodity in the carbon trading market. The implementation of the carbon trading mechanism can effectively promote carbon emission reduction.
A perfect carbon trading mechanism first needs to determine carbon emission quotas. There are two common allocation methods for carbon emission quotas: free distribution and paid distribution. Free allocation refers to pre-allocating free carbon emission credits to the system to increase the enthusiasm for system participation; paid allocation requires the system to pay corresponding fees for its own carbon emissions. According to the current actual situation in my country, carbon emission allowances are provided for the system based on the baseline method and free allocation. For the IEHS with DR established in this paper, the carbon emission sources are GT and GB, GT generates electricity and heat, and GB only generates heat, and carbon emission quotas are allocated to them according to the total equivalent heat generation. The carbon emission quota of the system at time t is is:
E p,t = ^(^ GT,t + V^ gt^ + Pgbx ) (7)
In the formula: k is the regional carbon emission allocation per unit of electricity, which is determined by the “2019 China Regional Power Grid Baseline Emission Factor for Emission Reduction Projects” stipulated by the National Development and Reform Commission. This paper adopts the operating margin (OM) emission of the system area. The weighted average of the factor and the build margin (BM) emission factor is obtained, taking 0.57 t/(MW·h); and are the electrical and thermal power output by GT at time t, respectively; φ is the conversion coefficient of electricity; is the thermal power output by GB at time t.
The actual carbon emission of the system at time t is the sum of GT and GB. According to the emission factor method, in this paper, it is approximately considered that the actual carbon emission of the unit is proportional to the output of the unit, then the actual carbon emission of the system at time t is:
^ ac,t = k GT (? GT,t + V^ GT,^ + ^ Gb P Ggbx (8)
In the formula: and are the carbon emission coefficients of GT and GB respectively [12], which is taken as 0.6101 t/(MW·h).
In order to encourage the system to actively participate in the carbon trading market, the carbon trading strategy constructed in this paper is as follows: users can trade carbon emission allowances by themselves, that is, the actual carbon emission is less than the carbon emission allowances, and the remaining carbon emission allowances can be sold at market prices to obtain profits; otherwise, Excess carbon credits need to be bought from the market. Therefore, the carbon transaction cost at time t is:
C ca,t = k ca (E ac,t - E p,t ) (9)
In the formula: is the carbon trading market price.
The IEHS optimal operation model considering DR under the carbon trading mechanism aims to achieve the best economics of the entire network under the premise of satisfying the system operation constraints. Taking the minimum sum of energy purchase cost, carbon transaction cost and operation and maintenance cost as the objective function:
minf = CBuy + Cca + C0P
-
1) Energy purchase cost . The system can trade electricity with the upper-level power grid, purchase electricity from the upper-level power grid when the power generation cannot meet its own needs, and accordingly, sell the excess power to the upper-level power grid when the power generation is surplus; in addition, the system needs to purchase natural gas to maintain CHP and GB operation . Therefore, the cost of purchasing energy is:
CBuy
т
= ^(Wf
L=1
- P^t + Q ,^
In the formula: T is an operation cycle; and are the power purchased and sold from the upper power grid at time t, respectively; and are the electricity purchase and sale prices at time t, respectively; is the amount of natural gas purchased at time t; is the unit price of natural gas.
-
2) Carbon trading cost . The carbon trading cost of a running cycle is the sum of all moment costs:
т
C ca
= \C ca.L
L=1
-
3) Operation and maintenance cost.
C0P
T
=11
i=i
^ i ^ i,L i=i
In the formula: i takes 1, 2, ..., 6, representing the fan CHP, HP, GB, ES and HS respectively; is the operation and maintenance coefficient of the equipment i; is the output of the equipment i.
The optimal operation constraints of IEHS considering DR under the carbon trading mechanism are: wind power output constraints, energy balance constraints, equipment energy conversion constraints, energy storage equipment constraints and user satisfaction constraints on electricity consumption.
-
1) Wind power output constraints.
The clean energy on the energy supply side mainly considers wind power. Due to factors such as wind power output uncertainty and power grid transmission capacity, the system is often unable to absorb all wind power, that is, the actual output of wind power is less than the predicted output.
Pe< Pe ^ WT,L — ^ WT,F
In the formula: and are the actual output and predicted output of wind power at time t, respectively.
-
2) Energy balance constraints.
The IEHS constructed in this paper includes electric energy flow, thermal energy flow and air energy flow, all of which need to meet the energy balance constraints, which are:
Бюллетень науки и практики / Bulletin of Science and Practice Т. 8. №8. 2022
Pbt-PSt + PwTt-PHPt + PcHPt + PEftS -P^ = PL°t+^PCLt + ^PlLt + ^Lrte (15)
U . v «J. С V V J . t Л P . v С 1 . t L ^ . t L ^ . t *^. “ C ^, t О ^ . “ t
p (b, + P Chp, + P sP.t + P^ - pH'S = P3+M!* (16)
Qb.t = Q csp.t + Q gb.c (17)
In the formula: and are the power consumption and heat production of HP at time t, respectively; are the electricity generation power, heat generation power and gas consumption of CHP at time t respectively; and are respectively is the discharge and charging power of the battery at time t; and are the heat release and heat storage power of the heat storage tank at time t, respectively; and are the electrical load and thermal load at time t before DR respectively; is the GB gas consumption at time t.
-
3) CHP constraints. Equations (18) and (19) are the constraints of CHP power generation and heat generation, respectively. CHP power generation is composed of GT power generation and low temperature waste heat power generation device power generation. CHP heat generation is WHB heat generation; formula (20), (21) are GT gas-to-electricity and gas-to-heat constraints, respectively.
P(CHP, t = P(CT, t + PC)RC, t
PCHP, t = PGT, tfttTWHB
P(CT, t = QcHP, tTGT^g
PG)RC, t = PGT, tat^ORC at+0t = 1(23)
0 In the formula: is the power generated by the low temperature waste heat device; is the ratio of the waste heat generated by GT to WHB for heat generation at time t; is the heat conversion efficiency of WHB; and is the gas-to-electricity and gas-to-heat efficiency of GT respectively; is the calorific value of natural gas, which is 9.88 kW h/m³; is the proportion of waste heat generated by GT to the waste heat power generation device at time t; is the power generation efficiency of the waste heat power generation device . For HP, GB energy conversion constraints, energy storage equipment constraints, and equipment energy consumption upper and lower limits, please refer to [11]. 4) User satisfaction constraints on electricity consumption. The user's feeling about the change of electricity consumption will affect the enthusiasm of the response, so consider the user's electricity consumption satisfaction constraint: s = 1 — L1 ^.L ^^.L J^.L L ^r Too — smin' ^t—1PL.t In the formula: and are the user's electricity consumption satisfaction and the minimum value of satisfaction, respectively. The problem in this paper is a mixed integer linear programming problem. First, the price-based demand response and the alternative demand response are analyzed to obtain the load curve after demand response; then, the carbon trading mechanism is introduced, and the carbon trading cost under the carbon trading mechanism is taken as the target. Finally, under the condition of satisfying wind power output constraints, energy balance constraints, equipment energy conversion constraints, energy storage device constraints and user satisfaction constraints on electricity consumption, the CPLEX solver is called based on MATLAB platform to solve. The solution process is shown in Figure 2. Based on MATLAB platform YALMIP toolbox to call CPLEX solver to solve Figure 2. Flow chart of solution Taking an industrial park in the north as the research object, 24h is an operating cycle, and the unit operating time is 1h. The installed equipment in the system includes CHP, HP, GB composed of GT, WHB and low-temperature waste heat power generation device based on ORC. The parameters are shown in Appendix A1; the price of natural gas is 2.55 yuan/m³; the time-of-use electricity price is shown in Appendix A2; The predicted output of electricity, heat load and wind power is shown in Figure A1. In order to verify the rationality of the proposed model, this paper compares and analyzes the following four scenarios. Scenario 1: Only carbon trading mechanisms are considered; Scenario 2: Considering demand response under the carbon trading mechanism; Scenario 3: Consider only demand response; Scenario 4: Carbon trading mechanisms are not considered and demand response is not considered. The cost and actual carbon emissions of each scenario are shown in Table 1. It can be seen from Table 1 that compared with Scenario 4, the carbon emission cost of Scenario 1 is reduced by 78.07%, and the actual carbon emission is reduced by 2417.46kg. This is because Scenario 1 considers the carbon emission mechanism so that the system has an initial carbon emission quota, which can offset part of it. The cost of carbon emissions, while Scenario 4 must consider the full cost of actual carbon emissions; Compared with Scenario 4, the cost of purchasing energy in Scenario 3 is reduced by 9.58%. Table 1 COST OF EACH SCENARIO Scenes Total running Purchase energy Carbon trading Operation and Actual carbon cost/yuan cost/yuan cost/yuan maintenance emissions/kg cost/yuan 1 2 3 4 20108.90 14079.62 679.26 5350.02 32246.62 19313.64 13771.19 603.99 4938.46 31972.44 20845.88 13231.96 3462.33 4151.59 35926.32 22331.62 14633.32 3096.72 4601.58 39601.22 This is due to the consideration of demand response, which reduces the electricity load during peak hours and increases the electricity load during valley hours, so that the system can choose a more economical way of purchasing energy; Comparing Scenarios 1 and 2, Scenario 3 has higher total operating costs, lower energy purchase costs, and higher carbon trading costs and actual carbon emissions, which indicates the role of the carbon trading mechanism in promoting energy conservation and emission reduction; The total operating cost, energy purchase cost, carbon transaction cost, operation and maintenance cost, and actual carbon emissions of Scenario 2 are all lower than those of Scenario 1. This is because the carbon trading mechanism considers demand response not only to transfer part of the load during the high electricity price period to the low electricity price It also realizes the mutual substitution of electric energy and thermal energy on the user side, and smoothes the load curve. Therefore, the system compares the power purchase, gas purchase cost and GT and GB output in different time periods, so as to choose a more economical and carbon-friendly It operates in a way with less emissions, effectively coordinating the operating economy and low carbon of the system. In each s Figure 3. PV and Wind power forecast curve In scenario 2, the electricity and heat loads before and after demand response are shown in Figures 4-5 res Figure 4. Electric load before and after demand response Figure 5. Heat load before and after demand response As can be seen from Figure 4 and Figure 5, compared with the obvious peak-to-valley distribution of the original load, CL responds to the peak-to-valley electricity price and reduces part of the load during high electricity price periods (09:00-12:00, 19:00-22:00); SL transfers part of the load during the high electricity price period (09:00-12:00, 19:00-22:00) to the low electricity price period (00:00-08:00), reducing the load during the high electricity price period and increasing the low electricity price period. During the electricity price period, the load curve is relatively smooth; RL converts part of the electricity load into heat load during the high electricity price period (09:0012:00, 19:00-22:00), and the low electricity price period (12:00-19:00: 00, 22:00-09:00) to convert part of the thermal load into electrical load. The synergistic effect of price-based demand response and alternative-based demand response makes the load curve smooth and realizes peak shaving and valley filling. Before and after demand response, electricity and heat prices are shown in the Figure. -----Initial Tariff -----Initial heat price --Time-of-use tariff--Time-of-use heat price 1.1 0.9 0.8 * 0.7 £ о.б 0.5 0.4 0.3 0.2 0 5 10 15 20 25 Time/h Figure 6. Electricity and heat prices before and after demand response It can be seen from Figure 6 that after the price-based demand response, electricity and heat prices will increase and decrease in various time periods during the entire dispatch cycle, which will stimulate load aggregators to use electric energy effectively and orderly. During the peak hours of load, especially the use of rigid loads, adjustments must be made to achieve orderly power consumption of the system. Therefore, for the electric-heat integrated energy system, flexible loads are included to improve the flexibility of the load side, and then It plays the role of peak-shaving and valley-filling for the entire electric and thermal integrated energy system. In Scenario 2, the electrical and thermal outputs of each device are shown in Figures 7-8 respectively. As can be seen from Figure 6 and Figure 7, the operation of the system equipment and the reasons are shown in Table 2 for specific analysis. In addition, the ES is charged during the low electricity price period and discharged during the high electricity price period, and the HS is conversely, which improves the flexibility of the system. Time/h Figure 7. Electrical Load Balancing Time/h Figure 8. Thermal Load Balancing Valley 00:00-08:00 The system relies on wind On the one hand, the operation and maintenance power output and the upper- cost of wind turbines is relatively small, and the level power grid to buy preferential use of wind power output is electricity to meet the conducive to reducing operating costs. When the charging and electrical load wind power output still cannot meet the electrical demands of HP and HS, so as load demand of the system and the electricity to maintain the electrical price is low during this period, the cost of power balance in this period. purchasing electricity from the upper power grid The thermal load is supplied is less than that from the upper power grid. On the by HP, GB and HS to achieve other hand, the heating efficiency of HP is higher thermal power balance. than that of CHP and GB, so HP heating is preferred. When HP cannot fully meet the heat load demand and CHP does not work hard during this period, GB heating is used. flat 08:00-09:00 12:00-19:00 22:00-24:00 The system relies on the During this period, the electricity price is output of wind power and relatively high, and the cost of purchasing CHP to meet the demand of electricity from the upper-level power grid is HP and electric load, and the greater than the cost of purchasing gas from the heat load is supplied by HP upper-level gas grid. and CHP peak 09:00-12:00 19:00-22:00 The system relies on wind The electricity price is relatively high during this power, CHP output and HS period, and it is more economical to purchase gas discharge to meet HP and from the upper-level gas grid than to purchase electrical load demands, electricity from the upper-level grid. while heat load and HS heat storage are supplied by HP and CHP Conclusion Aiming at the electric heat integrated energy system, this paper establishes an optimal operation model considering demand response under the carbon trading mechanism, compares and analyzes the costs of four scenarios, and studies the impact of carbon trading prices on the operation of the system, and draws the following conclusions: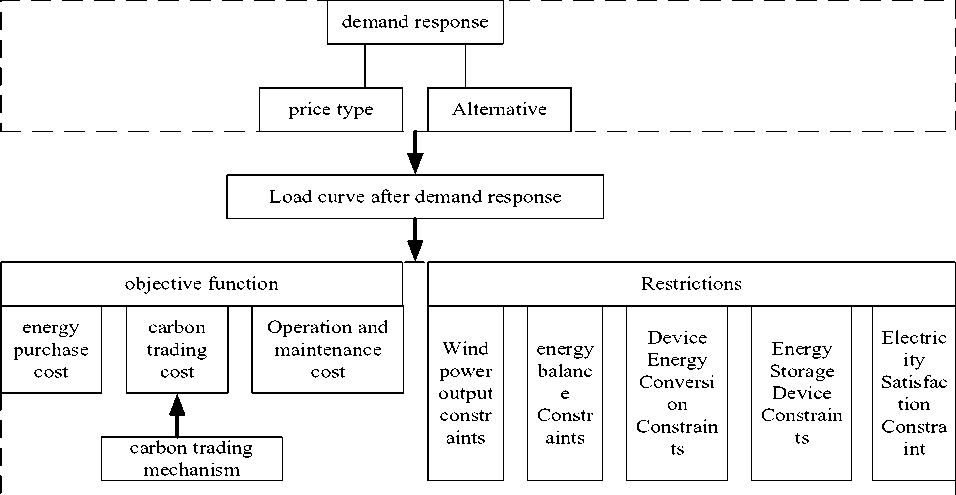
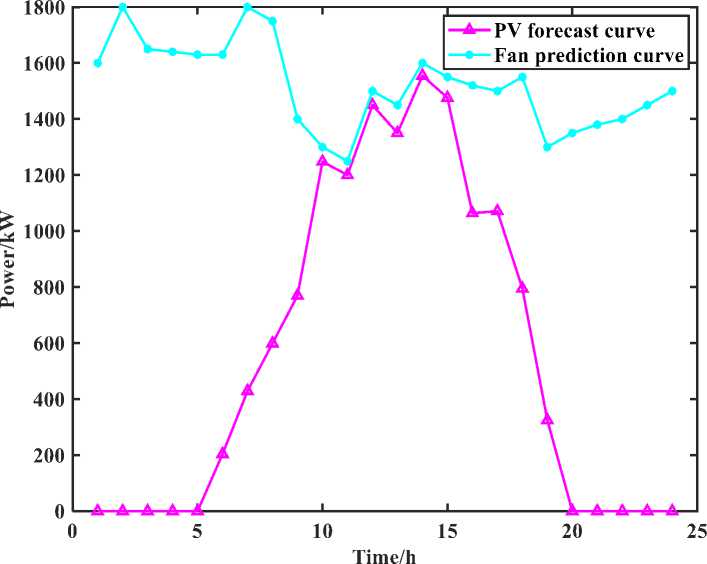
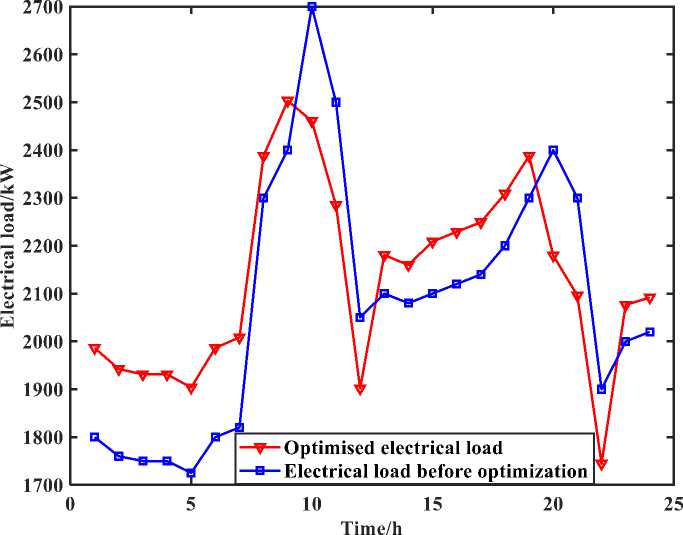
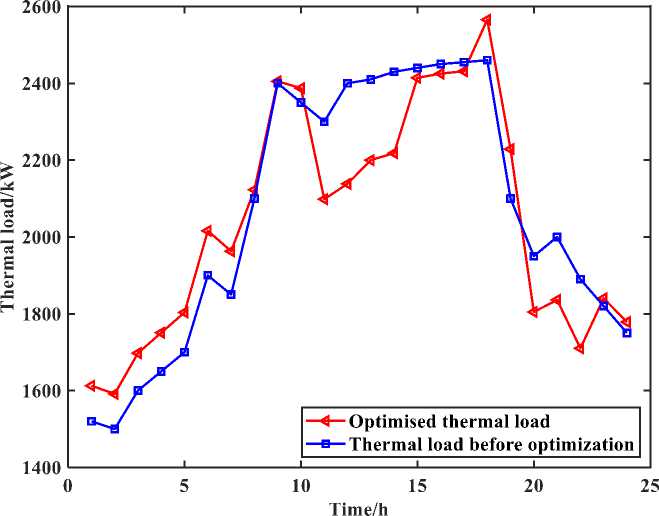
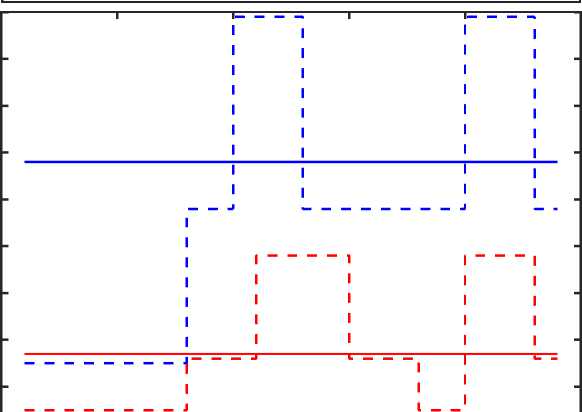
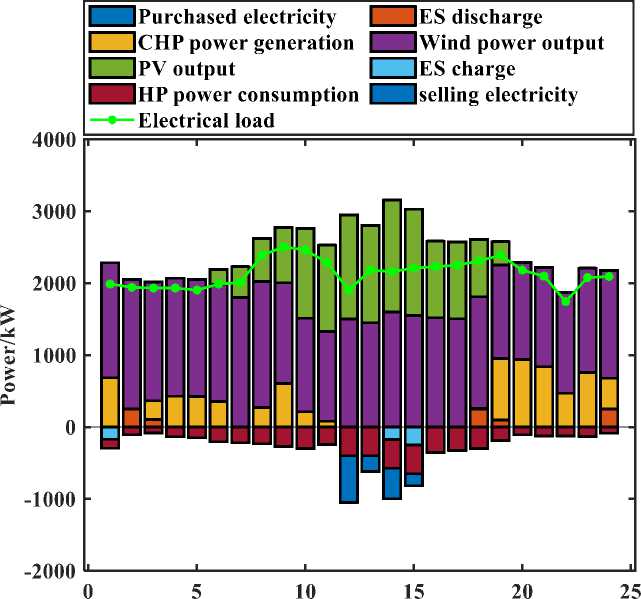
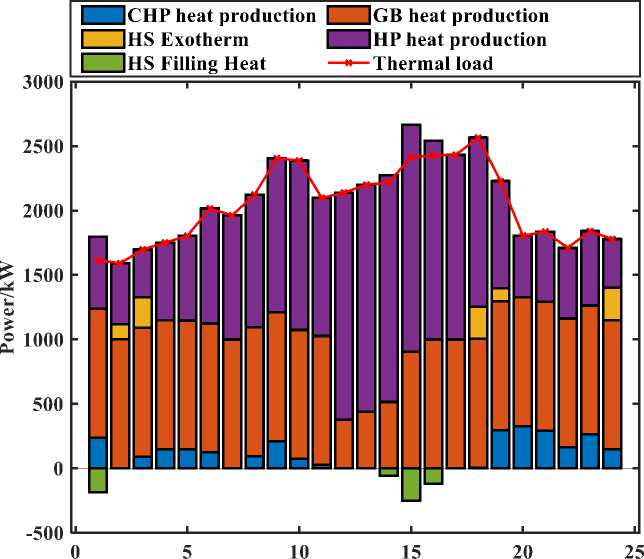
Table 2
SYSTEM OPERATION ANALYSIS IN CASE 2
Period period
System equipment operation reason
type
References Optimal operation of integrated energy system considering demand response under carbon trading mechanism
- Xie, H. P., Wu, L. X., & Zheng, D. Z. (2019). Prediction on the energy consumption and coal demand of China in 2025. Journal of China Coal Society, 44(7), 1949-1960.
- Wang Guofa, Liu Feng, Meng Xiangjun, Fan Jingdao, Wu Qunying, Ren Huaiwei, ... & Zhang Kun (MMXIX). Research et Practice of Coal Meo Intelligentia (primarium). Coal Science & Technology (0253-2336), 47(8).
- Ma, Yurong (2021). Ecological Civilization Construction and Post-epidemic Green Recovery. China Development Observatory, (05), 5-7.
- Hou, Q., Guan, Y., & Yu, S. (2020). Stochastic differential game model analysis of emission-reduction technology under cost-sharing contracts in the carbon trading market. Ieee Access, 8, 167328-167340. https://doi.org/10.1109/ACCESS.2020.3023391
- Wang, J., Liu, W., Li, S., Liu, Z., Yang, M., & Guo, H. (2020). A Method to Evaluate Economic Benefits of Power Side Battery Energy Storage Frequency/Peak Regulation Considering the Benefits of Reducing Thermal Power Unit Losses. Power System Technology, 44(11), 4236-4245.
- Wang, R., Wen, X., Wang, X., Fu, Y., & Zhang, Y. (2022). Low carbon optimal operation of integrated energy system based on carbon capture technology, LCA carbon emissions and ladder-type carbon trading. Applied Energy, 311, 118664. https://doi.org/10.10167j.apenergy.2022.118664
- Li, X., Ai, X., Hu, J., Zhou, B., & Lin, Z. (2019). Three-stage combined peak regulation strategy for nuclear-thermal-virtual power plant considering carbon trading mechanism. Power Syst. Technol, 43, 2460-2470.
- Guiju, L., Hongguang, H., & Qin, S. (2019). Evaluation method for node importance in power telecommunication network based on interdependent network theory. Power System Protection and Control, 47(11), 143-150..
- Li, M., Wang, Y., Tian, Y., & Liu, H. (2020, December). Deep Peak Shaving Model of Fire-storage Combination under High Permeability Wind Power Conditions. In 2020 IEEE 3rd Student Conference on Electrical Machines and Systems (SCEMS) (pp. 674-679). IEEE. https://doi.org/10.1109/SCEMS48876.2020.9352333
- Guo, Z., Zhang, R., Wang, L., Zeng, S., & Li, Y. (2021). Optimal operation of regional integrated energy system considering demand response. Applied Thermal Engineering, 191, 116860. https://doi.org/10.1016/j. applthermaleng.2021.116860
- Wang, L., Dong, H., Lin, J., & Zeng, M. (2022). Multi-objective optimal scheduling model with IGDT method of integrated energy system considering ladder-type carbon trading mechanism. International Journal of Electrical Power & Energy Systems, 143, 108386. https://doi.org/10.1016/j.ijepes.2022.108386
- Gao Gao, Liu Gengyuan, & Chen Caocao (2022), Probatio-Orientata Framework rationum ratiocinandi pro Urbano Conservatorium Gas emissiones in patria mea, 1. https://doi.org/10.13776/j.cnki.resourcesindustries.20220527.014
