Optimal operation of integrated energy systems based on multi-energy complementarity

Author: Kang Chuanzhi, Zhang Zongnan, Kudashev Sergei, Liu Meinan, Zhang Qianwei, Pan Jiashuang
Journal: Бюллетень науки и практики @bulletennauki
Section: Технические науки
Article in issue: 8 т.8, 2022.
Free access
Complementary multi-energy operation is an inevitable trend in the development of integrated energy systems, and the construction of a fair and reasonable distribution method among multiple stakeholders is the key to realizing complementary multi-energy operation. Integrated energy systems have important applications for achieving sustainable energy development and building a green, low-carbon society, while the complex internal energy structures and equipment coupling relationships pose challenges for their operational optimization. Taking advantage of the interactive and complementary relationship between power and heat on both the supply and demand sides, energy storage devices are used on the supply side to realize the thermo-electrolytic coupling of the combined supply equipment and to enhance the multi-energy supply capacity of the system through each energy conversion device. On the demand side, load types are classified, and the elasticity of electrical loads and the diversity of system heating methods are used to construct a comprehensive energy demand response model with time shifting and curtailment responses of electrical loads and responses of heating load supply methods, and to propose a response compensation mechanism. On this basis, with the objective of minimizing the sum of system operation cost and response compensation cost, the mathematical model for optimal operation of integrated energy systems based on multi-energy complementarity is established, taking into account the equipment operation and dispatchable load resource constraints on both the supply and demand sides. Simulation results and comparative analyses based on arithmetic examples show that: synergistic optimization of both supply and demand, taking into account multi-energy complementarities, can effectively improve the flexibility and operational economy of the system.
Multi-energy complementarity, integrated energy systems, thermal electrolytic coupling, integrated demand response
Short address: https://sciup.org/14125301
IDR: 14125301 | UDC: 629.064.5 | DOI: 10.33619/2414-2948/81/37
Оптимальная работа интегрированных энергетических систем на основе мультиэнергетической взаимодополняемости
Взаимодополняющая мультиэнергетическая работа является неизбежной тенденцией в развитии интегрированных энергетических систем. Построение справедливого и разумного метода распределения среди множества заинтересованных сторон является ключом к реализации взаимодополняющей мультиэнергетической работы. Интегрированные энергетические системы имеют важные приложения для достижения устойчивого развития энергетики и построения зеленого общества с низким уровнем выбросов углерода, в то время как сложные внутренние энергетические структуры и взаимосвязь оборудования создают проблемы для их операционной оптимизации. Используя интерактивные и взаимодополняющие отношения между мощностью и теплом как на стороне предложения, так и на стороне потребления, устройства накопления энергии используются на стороне предложения для реализации термоэлектролитической связи комбинированного оборудования подачи и увеличения мощности подачи нескольких источников энергии системы через каждое устройство преобразования энергии. Со стороны спроса классифицируются типы нагрузки, а эластичность электрических нагрузок и разнообразие методов нагрева системы используются для построения комплексной модели реагирования на спрос на энергию со сдвигом во времени и реакцией сокращения электрических нагрузок и реакцией методов снабжения отопительной нагрузки, и предложить механизм компенсации ответа. На этой основе с целью минимизации суммы стоимости эксплуатации системы и стоимости компенсации срабатывания устанавливается математическая модель оптимальной работы интегрированных энергетических систем на основе мультиэнергетической комплементарности с учетом ограничений по ресурсам работы оборудования и диспетчерской нагрузки как со стороны предложения, так и со стороны спроса. Результаты моделирования и сравнительный анализ, основанный на арифметических примерах, показывают, что: синергетическая оптимизация спроса и предложения с учетом взаимодополняемости нескольких источников энергии может эффективно повысить гибкость и экономичность системы.
Text of the scientific article Optimal operation of integrated energy systems based on multi-energy complementarity
Бюллетень науки и практики / Bulletin of Science and Practice Т. 8. №8. 2022
UDC 629.064.5
Based on the concept of energy cascade utilization, the integrated energy system breaks the pattern of separation between energy systems and effectively improves the energy utilization rate [1]. How to break through the constraints of thermoelectric coupling through the collaborative optimization of energy storage and distributed production capacity/energy conversion equipment, make full use of the complementary relationship of multiple loads on the demand side, and establish a scientific and reasonable economic dispatch model with multi-energy coordination on both sides of supply and demand is a comprehensive energy Important research content of system optimization operation [2-3]. In recent years, a series of pioneering research have been made on the unit modeling, planning and energy management of integrated energy systems at home and abroad. References [45] provide a planning model at the equipment planning level of an integrated energy system. The former establishes a nonlinear programming model aiming at reducing the total cost of the system, and the latter takes into account economic indicators and carbon emission indicators and establishes a multi-objective mixed integer linear programming. Model. Reference [6] established the economic dispatch model of cogeneration and solved it by using the crossover algorithm. On this basis, in order to deal with the uncertainty of power price, wind energy, PV and load, literatures [7-8] use stochastic
Бюллетень науки и практики / Bulletin of Science and Practice Т. 8. №8. 2022 programming and robust optimization methods to establish an integrated energy system dispatch optimization model. References [9-11] use the steam storage system, the power-to-gas technology, and the heat storage capacity of the heat supply pipeline and the heat accumulator to realize the thermo-decoupling of the cogeneration unit, which improves the energy supply flexibility of the system. In the literature [12], considering the heat network node flow balance, thermal energy-flow constraints and heat loss balance constraints, a mixed integer linear programming model for the coordinated optimal configuration of the multi-region integrated energy system capacity was established to make the scheduling results closer to reality. The above-mentioned literatures have made relatively complete research on the output optimization of equipment on the supply side of the integrated energy system around the planning and scheduling problem but have not considered the schedulability of the resources on the demand side. In order to further stimulate the flexibility of the integrated energy system, it is necessary to carry out reasonable dispatch management on its demand side.
Demand side management was proposed by the American Electric Power Academy in the 1980s [13], and now it is developing towards demand response that can better reflect market competition and demand elasticity. Demand Response (DR) emphasizes the two-way interaction between the supply side and the demand side and is an important means for users to participate in system scheduling. Users change their load demands according to energy market prices and system requirements to obtain certain benefits. At present, DR research mostly stays in the power aspect. In order to solve the influence of wind power uncertainty on the stable operation of the system, the literature [14] constructed a wind power energy storage stage scheduling optimization model that takes into account demand response. Reference [15] adopts an incentive mechanism to provide users with coupon incentives to guide electricity demand. The multi-energy complementary integrated energy system can further reduce the energy cost by reasonably changing the heat load. Reference [16] provides users with a heat demand market mechanism for the multi-energy complementary system and establishes a heat demand response model. Successfully reduced system operating costs. Based on the thermal storage characteristics of buildings, the literature [17] proposes an optimal scheduling method for combined cooling, heating, and power (CCHP) building microgrids that integrates demand-side virtual energy storage systems. Reference [18] studied the influence of the operation mode of ice storage air conditioner on the comprehensive benefit of the integrated energy system. The above studies mainly achieve DR through two methods of load reduction and load time shift, but these methods are achieved at the expense of user comfort. There are many types of energy in the integrated energy system, which provides a new way for demand response, that is, users can not only use curtailment and time-shift response during peak electricity consumption periods, but also adjust the participation of electric and heat loads based on the complementary characteristics between loads. Response adjustment.
This paper mainly studies the optimal operation of the integrated energy system including heat, electricity and gas. The micro-source equipment of the system mainly includes wind power generation, micro gas turbine and gas boiler; The energy storage device includes a battery and a heat storage tank; Energy conversion equipment includes heat exchangers, electric heating equipment, etc. Its structure is shown in Figure 1, and there is bidirectional power flow between this system and the external large power grid and energy storage system.
Power thermal energy
Charge discharge electricity sales purchase electricity
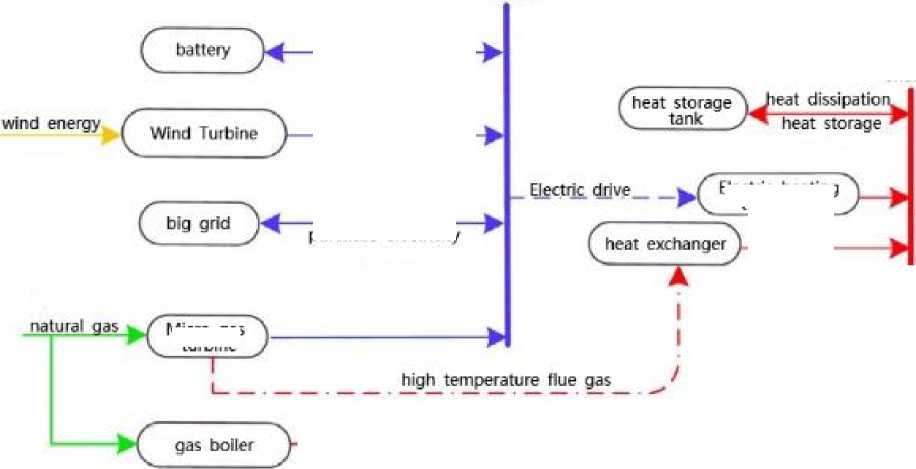
Figure 1. Integrated energy system structure diagram
Electric heating equipment
Micro gas turbine
In this paper, a mathematical model of thermoelectric relationship is established based on Capstone's C65 MT, ignoring the influence of external environment and combustion efficiency, and the exhaust heat power Q MT ( t ) is expressed as [22-23] Equation (1).
Qmt( t )
^ Ml ( t ) ( 1 П МТ( t ) n L )
n MT ( t )
where: P mt( t ), n MT( t ) are the power generation power and power generation efficiency of the MT in the period t ; n L is the heat dissipation loss coefficient. During operation, MT must satisfy the operating power and ramp rate constraints shown in equations (2) and (3), namely:
U MT ( t ) P MT .min

The waste heat discharged from the MT is passed through the heat exchanger to meet the user's gas heat energy demand.
QmtA t) = Оt) COP^ (4)
where: 0 MT.h( t ) is the heating power of the heat exchanger in the period t; COP ho and n rec are the heating coefficient and flue gas recovery coefficient of the heat exchanger, respectively.
When HE and TST cannot meet the user's gas heat load demand, GB can provide the insufficient part. During operation, GB must satisfy the operating constraints and ramp rate constraints shown in Equation (5) and Equation (6).
Q
B.min
- Qb. (t) - Qb.. max
QBdown* Qb. (t) - Qb. (t — 1) - QB.up
Electric heating equipment obtains thermal energy through electrical energy, such as electric air conditioners, electric boilers, etc. This paper adopts the mathematical model in the literature [22].
Qh (t ) = PEH (t ) Veh
where: Q EH( t ) and P EH( t ) are the heating power and electric power of the electric heating equipment in the period t, respectively; I n eh is the conversion coefficient.
By decoupling the thermoelectric connection through the energy storage device, the system can be separated from the modes of “determining heat by electricity” and “determining electricity by heat”. The system can operate with low-cost energy at various time periods, reducing system operating costs. The integrated energy system in this paper includes BT and TST. Under the guidance of electricity price, BT improves the economy of system operation by “shaving peaks and filling valleys”, and the constraints of the remaining electric power E EES( t ) and charging and discharging power P EES.ch( t )/ P EES.dis( t ) of BT in the period t are shown in equations (8–11).
—
0.2E - E (t) - 0.8EPP4 (11)
EES.max EES EES.max where: PEES.ch.min / PEES.ch.max and PEES.dis.up / PEES.dis.down are the maximum/minimum ramp rate of BT charging/discharging; EEES. max is the maximum capacity of BT; UESS.ch(t)/UESS.dis(t) are the charge/discharge status flag bits of BT in the time period t, 0 means outage, 1 means running; And satisfy the mutual exclusion constraint and the charge-discharge frequency constraint, namely
The state of charge at the daily start and end of BT must satisfy:
E:ES ( 0 ) = EeES ( 24 )
Usually, the peak of electricity consumption occurs during the day, while the peak of heat consumption occurs in the morning and evening [23]. Therefore, TST can be used to realize the time shift of the gas heat load, so as to alleviate the problem of mismatch between the electric heat output of the CHP system and the load demand and realize the unified and coordinated management of the electric heat energy. The residual thermal power H TST (t) and storage Q TST.ch ( t )/discharge Q TST.dis ( t ) thermal power constraints of the TST in the period t are shown in equations (15-18).
H tst ( t ) = (1 - A ) H tst ( t - 1) +| Q TSTch ( t )% .ch - QS к ^ h.dis J
Pees, ch,down - Pess, ch (t) — Pess, ch (t — 1) - Pess, ch,up
PEES, dis,down - PESS, dis (t) - PESS, dis (t — 1) - PESS, dis,up
QTST, ch (t) - QTST, ch (t - 1) - QTST, ch,up
QTST, dis,down — QTST, dis (t) - QTST, dis (t -I) - Qtst, dis,up where: P /P and P /P are the maximum/minimum ramp rates of
BT charging/discharging.
Adding energy equipment also needs to consider the impact of the increased investment cost on the long-term benefits of the system. In order to analyze the feasibility of adding energy equipment, this paper considers the static investment payback period, that is, the total time required for the relative income of the investment project to offset the original investment of the project.
J H m

j = 1 m = 1
where: C vest. j is the investment of equipment j; L NCF. m is the net income of the mth year; H m is the static investment payback period; J is the total amount of equipment. The smaller the H m , the stronger the return on investment, and the more feasible it is.
There are various types of loads in IDSR. Depending on the role of the supply-side electrothermal coupling equipment, it can not only motivate power users to reduce and time-shift electrical loads according to the electricity price, but also realize the transfer of electrical heating loads and gas heating loads.
The electrical loads are divided into three categories according to the operating characteristics such as use time and power: Fixed, time-shifted and controllable loads; The heat load is divided into two categories according to the user’s heat energy acquisition method: Gas heat load and electric heat load. It is assumed that the following policies exist when the user selects the response mode:
-
1) In the presence of electric heating, for user i, the demand response can be performed by adjusting the demand for electric heating and gas heating.
-
2) In the presence of electric heating, for user i, demand response can be performed by adjusting the power consumption of the controllable load and shifting the time-shifted load usage period.
-
3) In the presence of gas heating, for user i, demand response can be performed by adjusting the electricity consumption of the controllable load and shifting the time-shifted load usage period.
Adjusting the Electric Load Response
-
1) time shift load
Time-shifted load refers to the load whose power consumption time can be changed according to the needs of users, and the duration of different load types is different.
M 1
M 1
M 1
i = 1
teTin teTout where: Pmo.i(t) is the time-shifted load power of the i-th user in the period t before the IDSR adjustment; Pmo.in.i(t) and Pmo.out.i(t) are the load power of the i-th user in the period t after being adjusted by the IDSR; M1 is The number of users participating in the time-shifted load response.
-
2) controllable load
Controllable load refers to the load that the system partially reduces the user's electricity load, and usually provides price compensation for the reduced user. Let the expression for reducing load P fle.i ( t ) in period t be:
M 2
P le ( * ) = Z ( P ei ( ‘ ) "Д Р lei ( * ) ) (27)
-
i = 1
where: Pfle.i(t) is the power consumption of the controllable load of the i -th user before the IDSR adjustment in the period t ; Pfle..i( t ) is the power consumption of the i -th user after the IDSR adjustment in the period t ; M2 is the participation in the controllable load response. number of users.
And when the controllable load is scheduled, its regulated power should be kept within a certain limit, as shown in equation.
where: P is the minimum power consumption of the i- th user.
Adjust the response of heating mode
The peak hours of loads such as air conditioners and electric furnaces can basically be consistent with the peak hours of grid power supply. In IDSR regulation, qualified users can give up heating methods such as air conditioners and electric furnaces, and use centralized heating methods instead, which can maintain the user's thermal energy demand. Under the condition of unchanged, relieve the pressure of grid power supply.
In the period t , the replacement response power of the i- th user adjusted by IDSR is A Q e i ( t ) , then the electric heating load Q e( t ) of the system adjusted by IDSR is:
M 3
Qe( t) =E(Qei( t)-A Qe,( t))
i = 1
The gas heat load Q g ( t ) and electrical load P load ( t ) of the system adjusted by IDSR are:
M 3
Qg( t)=L(Qg( t)+a a Qei( t))
i = 1
M
Poad (‘) = Poad( t) "ZAQ., (t)(31)
i = 1
where: Q g.i ( t ) is the gas heat load demand power before the IDSR adjustment of the i- th user in the period t ; a e is the replacement coefficient; P load ( t ) is the electric power of the system before the IDSR adjustment in the period t .
In order to motivate users to more actively participate in demand response, a fee compensation mechanism is adopted for users, and the compensation fee is borne by the energy supply system, and the compensation cost is shown in formula (32).
C d = S A P.(t ) C ci ( t ) + f P moU t ) C J t )
24 ' = 1 "1 (32)
+^a q c ( t ) C ., ( t )
t = 1
where: C e1 ( t) , C e2 ( t ), and C e3 ( t ) are the unit prices of reducing electric power, transferring electric power, and adjusting electric heating power in the period t , respectively, and the price is related to the benefit obtained by the system before and after participating in the response.
The optimal operation model of the integrated energy system with IDSR, decoupling the thermoelectric connection through the ESS, considering the multi-energy complementary characteristics, and jointly formulating the optimal output plan of each co-supply equipment from both sides of supply and demand.
The day-ahead planning model of the integrated energy system is a mixed integer linear programming problem, and the objective function is to minimize the operating cost, namely min F = Cgrld+ Cng + Ce + C, + Cd (35)
Бюллетень науки и практики / Bulletin of Science and Practice Т. 8. №8. 2022
Analysis of operating results under different schemes
In order to verify the advantages of considering multi-energy complementarity on both sides of supply and demand, the following five operating modes are selected for comparison.
plan 1: The heat and electricity are operated separately, and the output of the equipment on the supply side of the system is optimized.
plan 2: In the operation of cogeneration, the ESS is used to decouple the thermoelectric connection to optimize the output of the equipment on the supply side of the system.
plan 3: In the operation of cogeneration, the ESS is used to decouple the thermoelectric connection, and the user side only participates in the reduction of the electrical load and the time-shift response to optimize the output of the equipment on the supply side of the system.
plan 4: In the operation of cogeneration, the ESS is used to decouple the thermoelectric connection, and the user side only participates in the energy supply selection response of the heat load, optimizing the output of the equipment on the supply side of the system.
plan 5: In the operation of cogeneration, the ESS is used to decouple the thermoelectric connection, and the user side participates in the reduction and time-shift response of the electrical load, as well as the energy supply selection response of the thermal load, so as to optimize the output of the equipment on the supply side of the system.
The operation of the integrated energy system under the five operating schemes is shown in Table 1. Under scheme 1, power and thermal energy operate independently, electric energy is mainly satisfied by external large power grid and power generation equipment, and thermal energy is mainly satisfied by GB, the waste heat of MT cannot be effectively utilized, and the fuel cost of GB is relatively high, therefore, the operation under this scheme The higher cost is 80,005,000 yuan; Scheme 2 is based on scheme 1. On the supply side, the multi-energy supply capacity of the system is improved through energy conversion equipment, so that the thermal energy can be satisfied by GB, HE and electric heating equipment. Therefore, the exchange cost and boiler cost are reduced, and its economical operation cost 77.123 million yuan; Scheme 3, on the basis of scheme 2, incorporates demand-side management into the economic operation of the system, adjusts the power consumption of controllable loads and time-shifted loads during peak hours, reduces the power purchase cost of the system, and reduces the total system operating cost to 76.608 million yuan; Scheme 4, on the basis of scheme 2, utilizes the complementary characteristics between loads to enable users to perform alternative demand response and reduce the power purchase during peak hours, but the boiler cost has increased, and its total operating cost is 76.511 million yuan; Scheme 5 integrates two demand response methods. Compared with Schemes 3 and 4, the boiler cost increases, but the power purchased during peak hours is reduced, and the total operating cost is optimized to 76.096 million yuan. After optimization, the electric load of each scheme is shown in Figure 2. Compared with the original electric load, the total electric load of schemes 3, 4, and 5 has been effectively reduced during peak hours. Features, tap user response potential, and will not have much impact on the system operation in the rest of the period.
Table 1 OPTIMAL RUNNING RESULTS UNDER DIFFERENT RUNNING SCHEMES
|
case |
Boiler cost/10,000 yuan |
Power generation cost/10,000 yuan |
Exchange fee/10,000 yuan c |
Demand side ompensation/10,000 yu |
Total operating an cost/10,000 yuan |
|
1 |
1321.9 |
1184.8 |
5477.3 |
0 |
8000.5 |
|
2 |
806.9 |
2104.4 |
4782.6 |
0 |
7712.3 |
|
3 |
779.3 |
2230.3 |
4220.0 |
412.8 |
7660.8 |
|
4 |
844.7 |
2223.0 |
4185.4 |
379.6 |
7651.1 |
|
5 |
851.5 |
2230.9 |
3791.8 |
717.0 |
7609.6 |
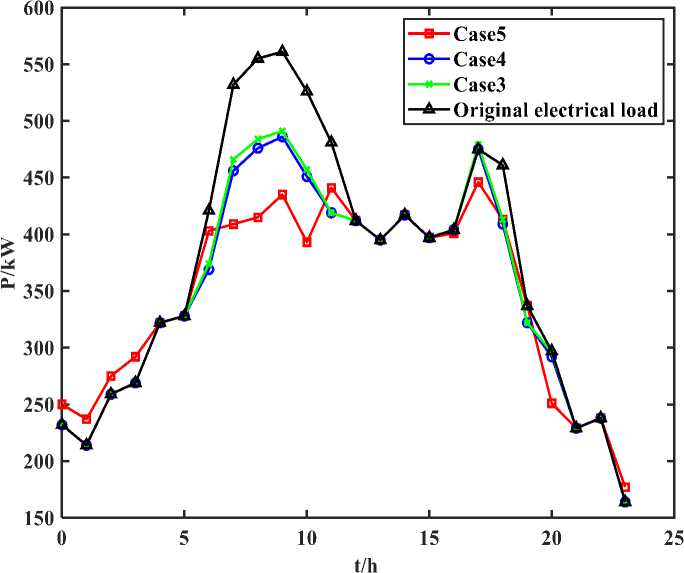
Figure 2. Electric load operation curve
Schemes 2, 3, 4, and 5 add energy storage equipment to Scheme 1, including heat storage tanks and batteries. See Table 2 [20-21] for their construction costs and service life. This paper analyzes the heating season (120 days/year) and compares the scheme 1 and scheme 5 in the heating season. The annual operating cost can be saved by 469 million yuan, and the static investment payback period of the integrated energy system energy storage equipment is 7.26 years, indicating that Although option 5 increases investment and maintenance costs compared to option 1, it can recover costs and make profits within the operating cycle.
Table 2
ENERGY CONVERSION EQUIPMENT COST AND LIFESPAN
|
Equipment |
Construction cost/10,000 yuan |
Annual maintenance cost/10,000 yuan |
life/year |
|
heat storage tank |
15.2 |
0.076 |
30 |
|
battery |
17.8 |
0.067 |
20 |
Analysis of power operation results
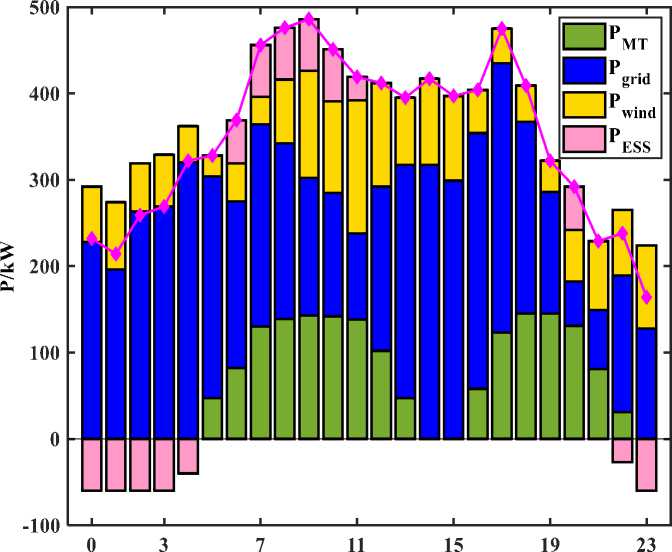
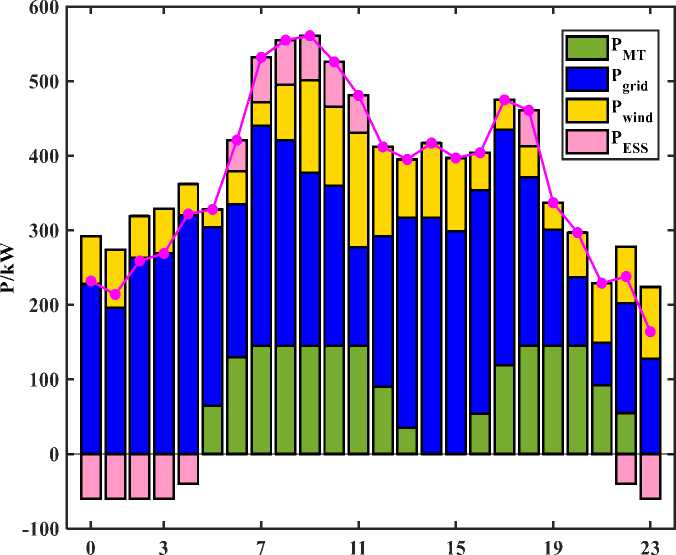
The power operation results of schemes 3, 4, and 5 are shown in Figure 3, Figure 4, and Figure 5, respectively. The results show that during the electricity price valley period from 22:00 to 6:00, the electricity load is mainly borne by the power grid and wind power generation. In schemes 3, 4, and 5, the MT is started at 4:00, and the electric energy storage is in the charging state. In scheme 4, scheme 3 and 5, part of the electrical load is transferred to this during this period, so the power purchased during this period is relatively large; During the peak period of electricity price from 6:00 to 12:00, with the gradual increase of electricity load and electricity price, MT output increased, electric energy storage discharge and system power purchase power decreased in each scheme.
Бюллетень науки и практики / Bulletin of Science and Practice Т. 8. №8. 2022
Compared with schemes 3 and 4, Scenario 5 not only reduces and transfers electric power during this period, but also guides the user to adjust the energy supply mode, so the power purchase during this period decreases greatly, and compared with scheme 4, the discharge power of electric energy storage during this period is also less in scheme 5; During the electricity price period from 12:00 to 18:00, the electricity load and electricity price are reduced. In each scenario, the output of MT is reduced, and the power purchase power is increased; During the period of 18:00-22:00 is the second peak period of electricity price, the working condition of the system is similar to that of the first peak period of 6:00-12:00; However, in the second half of the second peak period, the electric load has decreased, so the power storage and discharge power and frequency of each scheme are less.
Compared with Schemes 3 and 4, the purchase power of Scheme 5 during the two load peak periods is significantly smaller, which indicates that the application of IDSR can improve the peak regulation capability of the integrated energy system to a certain extent.
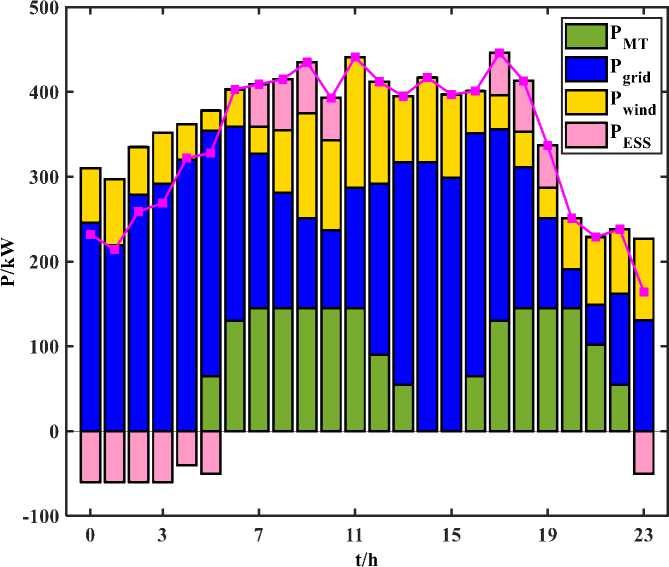
Figure 3. Power operation result of scheme 5
t/h
Figure 4. Power operation result of scheme 4
t/h
Figure 5. Power operation result of scheme 3
Figures 6, 7, and 8 show the gas-thermal energy operation results of schemes 3, 4, and 5, respectively. During the electricity price valley period from 22:00 to 6:00, the gas heat load in each scheme is mainly borne by GB and TST.
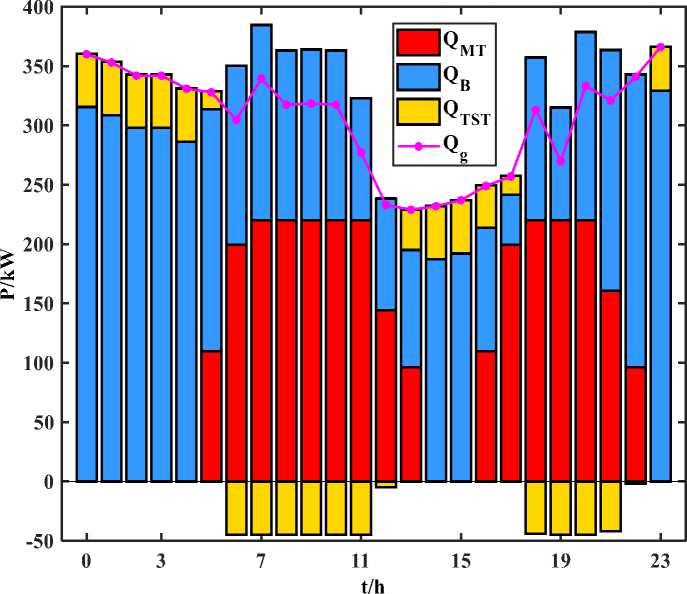
Figure 6.
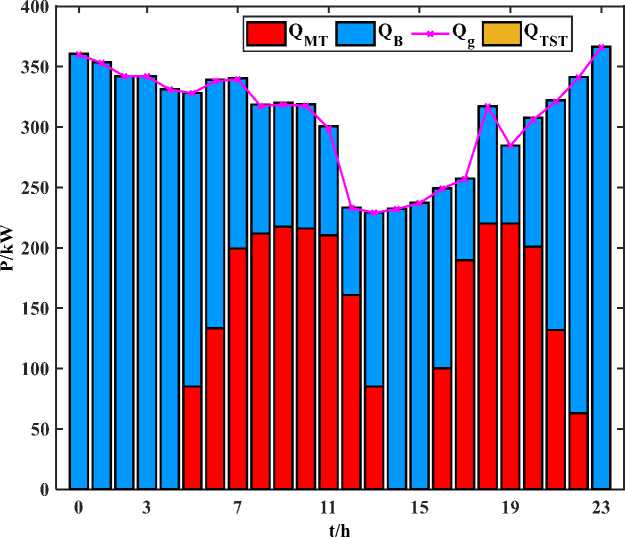
Figure 7. Thermal Energy Operation Results of Scenario 4
Compared with schemes 3 and 4, in scheme 5, more heat energy is released from energy storage, and GB output is smaller; During the period from 6:00 to 12:00, the thermal energy provided by the MT in each scheme gradually increases, and the excess thermal energy is stored by the TST. Compared with the scheme 3, the operating power of the electric thermal equipment in schemes 4 and 5 is reduced during this period, so the gas heat load power has increased, so the power of GB has increased, and scheme 5 has a longer heat storage time and more storage power than scheme 4 during this period; During the period from 12:00 to 18:00, the thermal energy provided by MT in each scheme decreases, and at this time, TST begins to release energy power; The period from 18:00 to 22:00 is the second peak period of the electricity price, and the operating conditions of the system are similar to those of the period from 6:00 to 12:00, so the power of the gas and heat load has increased, and the operati

t/h
Figure 8. Thermal Energy Operation Results of Scenario 5
Compared with Scheme 3, the GB output of Schemes 4 and 5 increases significantly during the two load peak periods. Combined with the power operation curve, it is mainly because the user has adjusted the energy supply method. In addition, the energy storage of scheme 5 changes with the load, and the charge is low, and the discharge is high, which effectively alleviates the mismatch between the supply and demand of the system.
Conclusion
In this paper, aiming at the integrated energy system with renewable distributed generation, decoupling the thermoelectric connection through the ESS, establishes an optimized operation model of the integrated energy system based on multi-energy complementation, so that the supply side can expand the energy supply capacity through the conversion equipment, so that the user can change the choice of energy consumption. To improve the demand-side responsiveness and provide optimization space for the heat and electricity production of the microgrid. Through the analysis of the results, the following conclusions can be drawn:
References Optimal operation of integrated energy systems based on multi-energy complementarity
- Li, H., Liu, D., & Yao, D. Y. (2021). Analysis and reflection on the development of power system towards the goal of carbon emission peak and carbon neutrality. Proc. CSEE, 41, 6245-6259.
- Li, X., Ai, X., Hu, J., Zhou, B., & Lin, Z. (2019). Three-stage combined peak regulation strategy for nuclear-thermal-virtual power plant considering carbon trading mechanism. Power Syst. Technol, 43, 2460-2470.
- Wu, C., Lin, S., Xia, C., & Guan, L. (2020). Distributed optimal dispatch of microgrid cluster based on model predictive control. Power Syst. Technol., 44(2), 530-538.
- Khan, M. R. B., Jidin, R., & Pasupuleti, J. (2016). Multi-agent based distributed control architecture for microgrid energy management and optimization. Energy Conversion and Management, 112, 288-307. https://doi.org/10.1016Zj.enconman.2016.01.011
- Dou, C., Jia, X., & Heng, L. I. (2016). Multi-agent-system-based market bidding strategy for distributed generation in microgrid. Power System Technology, 40(2), 579-586.
- Lee, J., Guo, J., Choi, J. K., & Zukerman, M. (2015). Distributed energy trading in microgrids: A game-theoretic model and its equilibrium analysis. IEEE Transactions on Industrial Electronics, 62(6), 3524-3533. https://doi.org/10.1109/TIE.2014.2387340
- Jadhav, A. M., & Patne, N. R. (2017). Priority-based energy scheduling in a smart distributed network with multiple microgrids. IEEE Transactions on Industrial Informatics, 13(6), 3134-3143. https://doi.org/10.1109/TII.2017.2671923
- Jadhav, A. M., Patne, N. R., & Guerrero, J. M. (2018). A novel approach to neighborhood fair energy trading in a distribution network of multiple microgrid clusters. IEEE Transactions on Industrial Electronics, 66(2), 1520-1531. https://doi.org/10.1109/TIE.2018.2815945
- Zhong, W., Xie, S., Xie, K., Yang, Q., & Xie, L. (2020). Cooperative P2P energy trading in active distribution networks: An MILP-based Nash bargaining solution. IEEE Transactions on Smart Grid, 12(2), 1264-1276. https://doi.org/10.1109/TSG.2020.3031013
- Sheng, W., Wu, M., Ji, Y., Kou, L., Pan, J., Shi, H., ... & Wang, Z. G. (2019, April). Key techniques and engineering practice of distributed renewable generation clusters integration. In Proceedings of the CSEE (Vol. 39, No. 8, pp. 2175-2186).
- Mu, C., Ding, T., Dong, J., Ning, K., Dong, X., & He, Y. (2021). Development of decentralized peer-to-peer multi-energy trading system based on private blockchain technology. Journal of Proceedings of the CSEE..
- Doan, H. T., Cho, J., & Kim, D. (2021). Peer-to-peer energy trading in smart grid through blockchain: A double auction-based game theoretic approach. Ieee Access, 9, 49206-49218. https://doi.org/10.1109/ACCESS.2021.3068730
- Yang, Z., Peng, S., Liao, Q., Liu, D., Xu, Y., & Zhang, Y. J. (2018). Non-cooperative trading method for three market entities in integrated community energy system. Autom. Electr. Power Syst, 42(14), 32-39.
- Park, S., Lee, J., Bae, S., Hwang, G., & Choi, J. K. (2016). Contribution-based energy-trading mechanism in microgrids for future smart grid: A game theoretic approach. IEEE Transactions on Industrial Electronics, 63(7), 4255-4265. https://doi.org/10.1109/TIE.2016.2532842
- Liu, N., Cheng, M., Yu, X., Zhong, J., & Lei, J. (2018). Energy-sharing provider for PV prosumer clusters: A hybrid approach using stochastic programming and stackelberg game. IEEE Transactions on Industrial Electronics, 65(8), 6740-6750. https://doi.org/10.1109/TIE.2018.2793181
- Cui, S., Wang, Y. W., Shi, Y., & Xiao, J. W. (2020). Community energy cooperation with the presence of cheating behaviors. IEEE Transactions on Smart Grid, 12(1), 561-573. https://doi.org/10.1109/TSG.2020.3022792
- Mei, S., Liu, F., & Wei, W. (2016). Engineering game theory and power system application [M]. Beijing, the Science Publishing Compan.
- Paudel, A., Chaudhari, K., Long, C., & Gooi, H. B. (2018). Peer-to-peer energy trading in a prosumer-based community microgrid: A game-theoretic model. IEEE Transactions on Industrial electronics, 66(8), 6087-6097. https://doi.org/10.1109/TIE.2018.2874578
- Liu, N., Yu, X., Wang, C., Li, C., Ma, L., & Lei, J. (2017). Energy-sharing model with price-based demand response for microgrids of peer-to-peer prosumers. IEEE Transactions on Power Systems, 32(5), 3569-3583. https://doi.org/10.1109/TPWRS.2017.2649558
- Xu, Y., Liao, Q., Liu, D., Peng, S., Yang, Z., Zou, H., & Zhang, L. (2019). Multi-player intraday optimal dispatch of integrated energy system based on integrated demand response and games. Power System Technology, 43(7), 2506-2518.
- Tushar, W., Saha, T. K., Yuen, C., Morstyn, T., Poor, H. V., & Bean, R. (2019). Grid influenced peer-to-peer energy trading. IEEE Transactions on Smart Grid, 11(2), 1407-1418.
