Optimality Test for Multi-Sever Queuing Model with Homogenous Server in the Out-Patient Department (OPD) of Nigeria Teaching Hospitals
 of Nigeria Teaching Hospitals")
Author: Tochukwu A. Ikwunne, Moses O. Onyesolu
Journal: International Journal of Modern Education and Computer Science (IJMECS) @ijmecs
Article in issue: 4 vol.8, 2016.
Free access
Queuing by patients in the out-patients department to access hospital services in Nigeria teaching hospitals is a teething concern to most healthcare providers. This causes inconvenience to patients and economic costs to the hospitals. Patients waiting for minutes, hours, days or months to receive medical services could result in waiting costs to them. Providing too much service could result in excessive costs. Also not providing adequate services could result in excessive waiting and costs. This study sought to determine an optimal server level and at a minimum total cost which include waiting and service costs in homogenous servers in order to reduce patients' congestions in the hospital as low as reasonably practicable. The queuing characteristics in all the twenty-three (23) teaching hospitals in Nigeria were analysed using a Multi-server Queuing Model and the waiting and service costs determined with a view to ascertaining the optimal service level. The data for this study were collected through observations and interviews. The data was analysed using Quantitative Methods, Production and Operations Management (POM QM) and Queuing Theory Calculator Software as well as using descriptive analysis. The results of the analysis demonstrated that average queue length, waiting time of patients as well as over utilization of specialist doctors at the teaching hospitals could be reduced at an optimal server level and at a minimum total cost as against their present server level with high total cost which include waiting and service costs. Therefore, this call for refocusing so as to improve the overall patient care in our cultural context and meet the patient needs in our environment.
Multi-Server, Out-patient, Total Cost, Trade-off, Utilization factor
Short address: https://sciup.org/15014853
IDR: 15014853
Text of the scientific article Optimality Test for Multi-Sever Queuing Model with Homogenous Server in the Out-Patient Department (OPD) of Nigeria Teaching Hospitals
Published Online April 2016 in MECS DOI: 10.5815/ijmecs.2016.04.02
Queues are formed when the demand for a service exceeds its supply [1]. Queuing up for services is a common phenomenon; we queue up for services in the restaurants, banks, schools, supermarkets, filling stations, hospitals, etc. Literature on queuing indicates that Queuing Theory is used as a tool in directing the allocations of increasingly scarce resources. Queuing has the advantage of producing simple models using less data while including randomness [2] and it also helps managers to determine the optimal supply of fixed resources necessary to meet a variable demand. Health policy formulators and hospital administrators have sought to apply queuing model in all facets of healthcare system [3] [4]. The use of queuing network techniques allows us to capture the stochastic nature of arrivals and service time that is typical in healthcare system [5] [3] [6] [2]. However, the most proposed queuing methods lack real world validation and perhaps for this reason are yet to be embraced by most physicians and hospital administrators [3]. The total patient’s demand requiring a service from time to time constitute the size of arrival and the provision of service using certain rule and discharge of patients is referred to as departure process [7]. Departure in hospitals means home discharge, admission or death [8]. The effect of queuing in relation to time spent for patients to access treatment is increasing becoming a major source of concern to a modern society that is currently exposes to great significant progress in technological advancement and speed in healthcare institutions [9].
Therefore, the flow of patients at the out-patient department (OPD) in each of the twenty-three (23) teaching hospitals that the researchers investigated is outrageous. OPD is largely visited by large section of communities and it is the first contact between a patient and a hospital staff. The major problem faced by the patients in that department is overcrowding as a result of delay in consultation. In many hospitals, patients come to the OPD without prior appointment and they have to wait for a long time to receive medical service. A few of the factors that are responsible for long waiting line in providing services are: overloading of available doctors, doctors attending to patients in more than one hospitals, lack of passion and commitment to work on the part of hospital staff, etc. The danger of keeping patients waiting could result in excessive cost to them. This is because the time wasted on the queue would have been judiciously utilized elsewhere, that is the opportunity cost of time spent in queuing. In a hospital system, healthcare providers must decide on what level of service to offer. In the short run, a low level service may be inexpensive, but, may incur high costs that could lead to patient dissatisfaction. On the other hand, a high level service will reduce the cost of patients waiting time, but will cost more to provide. Thus, a trade-off is determine between the costs in providing better service and waiting time of patients. The objective of this study is to minimize the total cost to the system. Having considered these points mentioned above, this research proposes to evaluate the patients waiting costs in terms of the performance measures and also determine the optimal level of service that reduces the total cost of service and cost of waiting as low as reasonably practicable.
-
II. Related Work
While several papers have been written on queuing related issues, they usually deal with a queuing problem when people have to wait in a queue, especially when the waiting time is longer than their [10] individual waiting time threshold , Lean Six Sigma methodologies utilization to redesign patient flow[11] processes, patients arrival time and service time unknown in advance [12] and the factors that influence the behaviour of the arriving customers and the service points which include [13] utilization of the capacity, defined as the percentage of the total service time that the hospitals are actively providing the service, variability of the arrival of customers and of the service times, and the level of inventory, defined here as the number of people in the queue and the people that get served. The queuing theory in healthcare organizations is very beneficial. Queuing models are useful in that they provide solutions to problems of waiting that are particularly relevant in health care. More generally, they illustrate the strengths of modelling in health care research [14] and service delivery. Studies in [15] and [16] described the contributions and applications of queuing theory in the field of healthcare. However, another study identified that Rapid Cycle Changes, specifically the Plan-Do-Study-Act (PDSA) cycle, have been an effective tool [17] for patient flow improvement. The tools for healthcare analysis have been developed over decades by researchers [14] in Operations Research (OR). A study [18] surveys the potential of OR in helping reduce hospital delays, with an emphasis on queuing models [19] and a new electronic data collection system for capturing physician delays. Another study [20] examined OR to reduce the waiting time in the hospital-admitting department. They conducted their studies in five faces, from the collection of data to actual improvement in the quality of the health care delivery system. It follows to say that with greater capability in this field, operational research and management science can play a significant role in global health [21] and that Operation research embodies wide range of techniques [22] that can improve the way we plan and organize health services. According to Martha and Sarah [23] smoothing the flow of patients in and out of hospitals and other health care settings can help to reduce overcrowding, prevent poor handoffs, and avoid delays, all of which may worsen as more people gain access to insurance coverage and care and [24] the study of health care delay is an application of the discipline of queuing theory. Another study [25] analysed that the cost of a dissatisfied customer is not negligible, the study described that waiting in line is a primary source of dissatisfaction.
-
III. Materials and Methods
The study area is Nigeria and the data for this study were collected from the twenty-three (23) teaching hospitals located in different parts of Nigeria. The data were collected for four (4) weeks in each teaching hospital and the method employed during data collection were direct observation and personal interview from the staffs and the patients who visited the OPD. In this queuing system, the arrivals of patients are assumed to follow Poisson Process and service times are assumed to follow Exponential Distribution. The number of server is assumed to be C, providing service independently of each other. Servers here represent only available doctors but no other medical personnel. The queue discipline is First Come, First Served (FCFS) basis by any of the server and there is no limit to the number of the queue. No server stays idle as long as there are patients to serve. It was assumed that the service providers are working at their full capacity and the average number of arrival is greater than average time. It is also assumed that the arriving patients form a queue and the one at the head of the waiting line enters into service as soon as a server is free.
-
A. The Queueing Model
The model adopted in this research is the (M/M/C): (∞/∞/FCFS)-Multi-server Queuing Model. It is assumed that patients’ arrivals follow a Poisson Probability Distribution at an average number of λ patients per hour. The service times are distributed exponentially; with an average of μ per hour and number of server C. It is also assumed that the queuing discipline is First Come, First Served basis by any of the Servers (Specialist Doctors). If there are n patients in the queuing system at any given time, then the following two cases may arise:
-
I. If n < C, (number of patients in the system is less than the number of server(s)), then there will be no queue. However, (C-n) number of servers will not be busy. Then, the combined service time will be μn= nμ; n < C.
-
II. If n > =C, (number of patients in the system is more than or equal to the number of servers) then all servers will be busy and the maximum number of patients in the queue will be (n-C).
The combined service time will be μn= Cμ; n>=C.
From the model, the probabilities are given below [26] [27]. The probability of having n patients in the system is given by
Pn= ( ( ' ) ! );;n>C .(1)
The probability that there is no patient in the system, that is, the servers are idle P 0 is
P = (∑ 1⁄ п!(л⁄и)+1⁄С!( ; ) ⁄См -л ) .
Next are the formulas for performance measures of the queuing system. The expected number of the patients waiting on the queue (queue length) is given as
Lq = (1⁄( с- 1)!(д ⁄ “ ) ( /|С—л ) ) P > .
Expected number of the patients in the system is
Ls = Lq + я⁄и․(4)
Expected waiting time of patients in the queue is
Wq = .(5)
Expected time a patient spends in the system is
Ws = .(6)
System utilization (fraction of time the servers are busy) are
ρ = (7)
Where X = the average number of patients per hour, μ= the service time per hour, C = the number of doctors/servers, P 0 = the probability that there are no patients in the system, Lq = expected number of patients in the queue, Ls = expected number of patients in the system, Wq = expected time a patient spends in the queue and Ws = expected time a patient spend in the system.
-
B. Cost Analysis Model
Two opposing costs must be considered in order to evaluate and determine the optimum cost and number of servers in the system. They are: service costs and waiting time costs of patients. The analysis of these costs help the management to make a trade-off between the increased costs of providing better service by the specialists and the decreased waiting time costs of patients derived from providing that service. Therefore, Expected Service Cost (Esc) is given as
Esc =CCc. (8)
Where, C= number of servers, Cc = service costs of each server. Expected Waiting Costs in the system is given by
EWc = ( ЛИ/s) Cw [28]. (9)
Where X = number of arrivals, Ws = expected time a patient spends in the system, Cw = Opportunity Cost of waiting by patients.
Adding “(8),” and “(9),” to compute the Expected Total Costs (ETc) is given below as,
ETc = CCc + (лWs) Cw (10)
-
IV. Analysis of Data
Table 1 displays the number of patients’ arrival per hour ( X ), service time ( ц ) and server (C) of the twenty-three (23) teaching hospitals surveyed. Tables 2-6 show the Performance measures of Multi-Server Queuing Model and optimality cost in OPD at the twenty three (23) teaching hospitals surveyed by the researchers. It should be noted that we used the average values for X and ц where they have the same servers (C) and they are grouped together in a table because they display homogenous characteristics within the range of the twenty-three (23) hospitals. We use Quantitative Methods, Production and Operations Management (POM QM) and Queuing Theory Calculator Software to compute their performance measures and total costs of the multi-server queuing system at the twenty three (23) teaching hospitals.
-
V. Results
Table 2 to Table 6 show the performance measures of multi-server queuing model and optimality cost in OPD at the twenty-three teaching hospitals surveyed by the researchers. It should be noted that the researchers used the average values for the number of patients’ arrivals and the service time where they have homogenous servers and grouped them together separately as shown in Table 2 to Table 6 because they have homogenous servers within the twenty-three (23) teaching hospitals. There are five groups of teaching hospitals according to their servers. Group-A has four teaching hospitals as shown in table 2, they include EBSUTH, ISTH, ESUTH and IMSUTH; group-B has four teaching hospitals namely as shown in table 3 which include JUTH, UUTH, UBTH and LAUTH; group-C has four teaching hospitals which are OOUTH, DELSUTH, UNTH and NAUTH; group-D has five teaching hospitals, the list includes UITH, UCTH, UDUTH ,OAUTH and UPHTH; finally group-E has six teaching hospitals namely LUTH, UCH, UMTH, ABUTH, AKTH and LASUTH.
group-A teaching hospitals with homogenous server 24 which include EBSUTH, ISTH, ESUTH and IMSUTH.
Table 1. Number of arrival (л), service time ( М- ) and server/doctors (C) of the twenty three (23) teaching hospitals surveyed.
Table 2 summarizes the performance measures of multi-server queuing model and optimality cost of the
|
Scenario |
Teaching Hospitals |
State |
л (hour) |
Iм ( hour ) |
C |
|
1. |
Delta State University Teaching Hospital (DELSUTH) Oghara |
Delta |
300 |
12 |
26 |
|
2. |
Lagos University Teaching Hospital (LUTH) Idiaraba |
Lagos |
500 |
20 |
28 |
|
3. |
Olabisi Onabanjo University Teaching Hospital (OOUTH) Sagamu |
Ogun |
300 |
12 |
26 |
|
4. |
University College Hospital (UCH) Ibadan |
Oyo |
500 |
20 |
28 |
|
5. |
University Teaching Hospital, (UNTH) Enugu |
Enugu |
299 |
11 |
26 |
|
6. |
University of Ilorin Teaching Hospital (UITH) Ilorin, |
Kwara |
355 |
12 |
27 |
|
7. |
University of Maiduguri Teaching Hospital (UMTH) Maiduguri |
Borno |
500 |
16 |
28 |
|
8. |
Jos University Teaching Hospital (JUTH) Jos |
Plateau |
368 |
13 |
25 |
|
9. |
Usmanu Danfodiyo University Teaching Hospital (UDUTH) Sokoto |
360 |
13 |
27 |
|
|
10. |
University of Uyo Teaching Hospital (UUTH) Uyo |
Akwa-Ibom |
372 |
17 |
25 |
|
11. |
Nnamdi Azikiwe University Teaching Hospital (NAUTH) Nnewi |
Anambra |
301 |
13 |
26 |
|
12. |
University of Calabar Teaching Hospital (UCTH) Calabar |
Cross-River |
365 |
15 |
27 |
|
13. |
Ebonyi State University Teaching Hospital (EBSUTH) |
Ebonyi |
348 |
14 |
24 |
|
14. |
University of Benin Teaching Hospital(UBTH) Benin City |
Edo |
371 |
16 |
25 |
|
15. |
Irrua Specialist Teaching Hospital (ISTH) Irrua |
Delta |
350 |
16 |
24 |
|
16. |
Enugu State University Teaching Hospital (ESUTH) Parklane |
Enugu |
352 |
16 |
24 |
|
17. |
Imo State University Teaching Hospital (IMSUTH) Orlu |
Imo |
350 |
14 |
24 |
|
18. |
Ahmadu Bello University Teaching Hospital(ABUTH) Shika |
Kaduna |
500 |
16 |
28 |
|
19. |
Aminu Kano Teaching Hospital (AKTH )Kano |
Kano |
550 |
21 |
28 |
|
20. |
Lagos State University Teaching Hospital (LASUTH) Ikeja |
Lagos |
450 |
15 |
28 |
|
21. |
Ladoke Akintola University Teaching Hospital (LAUTH) Osogbo |
Osun |
369 |
14 |
25 |
|
22. |
University of Port Harcourt teaching Hospital (UPHTH) Port Harcourt |
Rivers |
370 |
15 |
27 |
|
23. |
Obafemi Awolowo University Teaching Hospital (OAUTH)Ile-Ife |
Osun |
375 |
15 |
27 |
|
Table 2. Performance measures of Multi-Server Queuing Model and optimality cost in |
OPD of group-A. |
||||
|
Server (C) |
System Utilization Factor (ρ) |
P 0 |
Ls |
Ws |
Lq |
Wq |
ETc(₦) |
|
24 |
97.2 |
0 |
52.937 |
0.1512 |
29.6036 |
0.0846 |
225,873.9 |
|
25 |
92.3 |
0 |
32.423 |
0.0926 |
9.0899 |
0.026 |
189,846.5 |
|
26 |
89.7 |
0 |
27.6219 |
0.0789 |
4.2886 |
0.0123 |
185,243.9 |
|
27 |
86.4 |
0 |
25.6465 |
0.0733 |
2.3132 |
0.0066 |
186,293.1 |
|
28 |
83.3 |
0 |
26.6565 |
0.0704 |
1.3232 |
0.0038 |
189313.0 |
|
EWc= N 2000 |
, ESc = N 5000, Лavg =350, Iм avg = |
15, C |
24 |
Fig.1 to Fig. 4 is the graphical representation of Table 2. In Fig. 1, we describe the Expected Total Cost (ETc) against the number of doctors(C). As observed, ETc initially decreases and at a point started increasing with increasing number of doctors.
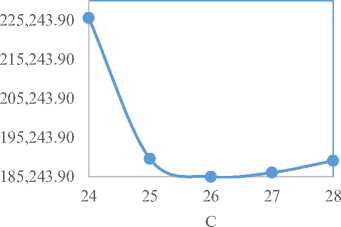
Fig.1. Total Cost (ETc) against Number of Server(C)
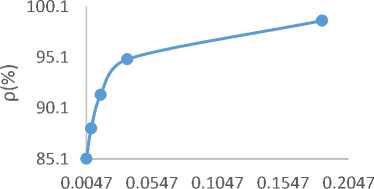
0.0038 0.0238 0.0438 0.0638 0.0838 0.1038
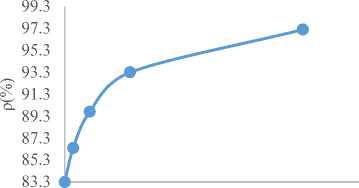
Wq
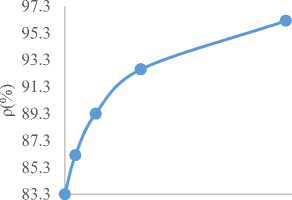
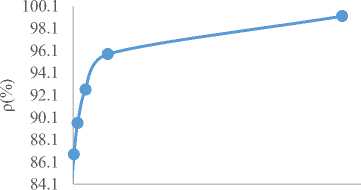
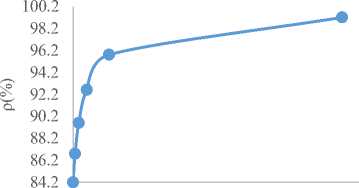
Fig.2. Utilization Factor (ρ) against Average Waiting Time in the queue (Wq)
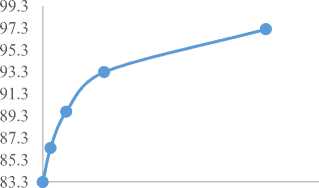
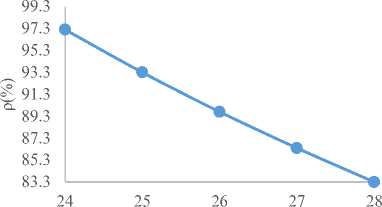
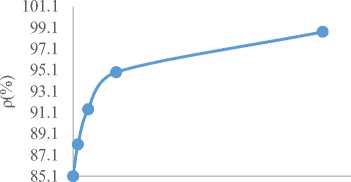
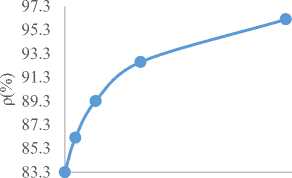
It is also noticed in Fig. 2 that the utilization factor (ρ) decreases with increasing patients’ waiting time in the queue and the utilization factor falls downwards as the number of doctors rise up in Fig. 3 as shown below. The utilization factor (ρ) and average waiting time in the system (Ws) increase as shown in Fig. 4.
C
Fig.3. Utilization Factor (ρ) against Number of Server(C)
0.0704 0.0904 0.1104 0.1304 0.1504 0.1704
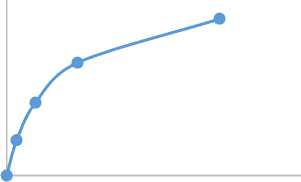
Ws
Fig.4. Utilization Factor (ρ) against Average Waiting Time in the System (Ws)
Similarly, Table 3 to Table 6 summarizes the optimality cost in the OPD at the remaining nineteen (19) performance measures of multi-server queuing model and teaching hospitals.
|
Table 3. Performance measures of Multi-Server Queuing Model and optimality cost in OPD of group-B. |
|
|
Server (C) |
System Utilization Factor(ρ) P 0 Ls Ws Lq Wq ETc(₦) |
|
25 26 27 28 29 |
98.7 0 92.9304 0.2512 68.2637 0.1845 378,791.2 94.9 0 37.9309 0.1025 13.2643 0.0358 217,792.8 91.4 0 30.4665 0.0823 5.7999 0.0157 199,399.6 88.1 0 27.7225 0.0749 3.0558 0.0083 195,167.5 85.1 0 26.4056 0.0714 1.7389 0.0047 195,216.7 |
EWc= N 3000, ESc = N 4000, лavg =370, Iм avg =15, C=25
Table 4. Performance measures of Multi-Server Queuing Model and optimality cost in OPD of group-C.
|
Server (C) |
System Utilization Factor(ρ) |
P 0 |
Ls |
Ws |
Lq |
Wq |
ETc(₦) |
|
26 |
96.2 |
0 |
44.56 |
0.1485 |
19.56 |
0.0652 |
219,120.0 |
|
27 |
92.6 |
0 |
32.537 |
0.1085 |
7.537 |
0.0251 |
200,074.0 |
|
28 |
89.3 |
0 |
28.8108 |
0.096 |
3.8108 |
0.0127 |
197,621.7 |
|
29 |
86.2 |
0 |
27.1315 |
0.0904 |
2.1315 |
0.0071 |
199,263.0 |
|
30 |
83.3 |
0 |
26.2495 |
0.0875 |
1.2495 |
0.0042 |
202,498.9 |
EWc= N 2000, ESc = N 5000, лavg =300, Iм avg =12, C=26
Table 5. Performance measures of Multi-Server Queuing Model and optimality cost in OPD of grou- D.
|
Server (C) |
System Utilization Factor(ρ) |
P 0 |
Ls |
Ws |
Lq |
Wq |
ETc(₦) |
|
27 |
96.6 |
0 |
48.5415 |
0.133 |
22.47 |
0.0616 |
232,082.9 |
|
28 |
93.1 |
0 |
34.4645 |
0.0944 |
8.393 |
0.023 |
208,928.9 |
|
29 |
89.9 |
0 |
30.2941 |
0.083 |
4.2227 |
0.0116 |
205,588.2 |
|
30 |
86.9 |
0 |
28.4379 |
0.0779 |
2.3664 |
0.0065 |
206,875.7 |
|
31 |
84.1 |
0 |
27.4658 |
0.0752 |
1.3943 |
0.0038 |
209,931.6 |
EWc= N 2000, ESc = N 5000, лavg =365, Iм avg =14, C=27
|
Table 6. Performance measures of Multi-Server Queuing Model and optimality cost in OPD of group-E. |
|
|
Server (C) |
System Utilization Factor(ρ) P 0 Ls Ws Lq Wq ETc(₦) |
|
28 29 30 31 32 33 |
99.2 0 146.6039 0.2932 118.8261 0.2377 433,207.7 95.8 0 44.8399 0.0897 17.0621 0.0341 234,679.8 92.6 0 35.0866 0.0702 7.3089 0.0146 220,173.3 89.6 0 31.6466 0.0633 3.8688 0.0077 218,293.2 86.8 0 30.0093 0.06 2.2316 0.0045 220,018.6 84.2 0 29.1197 0.0582 1.3419 0.0027 223,239.4 |
EWc= N 2000, ESc = N 5000, лavg =500, Iм avg =18, C=28
Fig.5 to Fig. 20 are the graphical representations of Table 3 to Table 6. Fig.5 to Fig. 20 follow the same pattern with Fig.1 to Fig. 4 of group-A. However, from the Fig. 1 to Fig. 20, it is evident that ETc is optimum at a given number of server (C) and that patient’s congestion and expected waiting time in the system are less than at the optimum server level. From Fig. 5 to Fig.8 of group-B, it is noticed that in Fig. 5, the ETc initially decreases and at a given point started increasing with increasing number of doctors. It is also noticed in Fig. 6 that utilization factor decreases with increasing patients’ waiting time in the queue and utilization factor decreases as the number of doctors increasing in Fig. 7 respectively. Fig. 8 showed that the utilization factor increases as the average waiting time in the system increases.
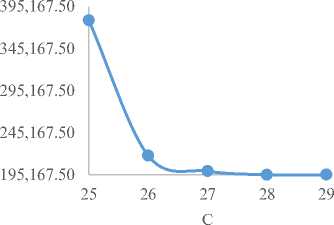
Fig.5. Total Cost (ETc) against Number of Server(C)
Wq
Fig.6. Utilization Factor (ρ) against Average Waiting Time in the queue (Wq)
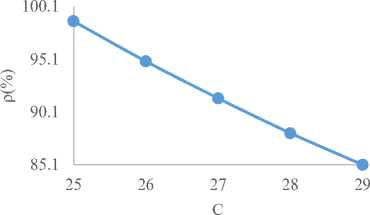
Fig.7. Utilization Factor (ρ) against Number of Server(C)
0.0714 0.1214 0.1714 0.2214 0.2714
Ws
Fig.8. Utilization Factor (ρ) against Average Waiting Time in the System (Ws)
Similarly, from Fig. 9 to Fig. 12 of group-C as shown below, it is shown that in Fig. 9, the ETc initially falls downwards and at a given point started increasing with increasing number of doctors. It is also showed in Fig. 10 that the utilization factor decreases with increasing patients’ waiting time in the queue, utilization factor falls downwards as the number of doctors increasing in Fig. 11 and Fig. 12 showed that the utilization factor increases as the average waiting time in the system increases respectively.
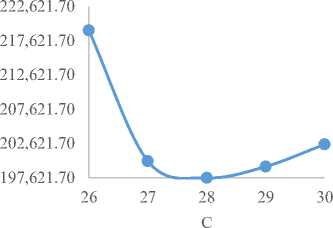
Fig.9. Expected Total Cost (ETc) against Number of Server(C)
0.0042 0.0242 0.0442 0.0642
Wq
0.0842
Fig.10. Utilization Factor (ρ) against Average Waiting Time in the queue (Wq)
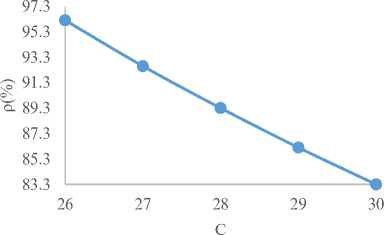
Fig.11. Utilization Factor (ρ) against Number of Server(C)
0.0875 0.1075 0.1275 0.1475
Ws
0.1675
Fig.12. Utilization Factor (ρ) against Average
In the same vein, from Fig.13 to Fig. 16 of group-D as shown, it shows that Fig. 13 below initially decreases and after a given optimum point started increasing with increasing number of doctors. It is also showed in Fig. 14 below that utilization factor decreases with increasing patients’ waiting time in the queue, utilization factor decreases as the number of doctors increasing in Fig. 15 and Fig. 16 showed that the utilization factor increases as the average waiting time in the system increases respectively.
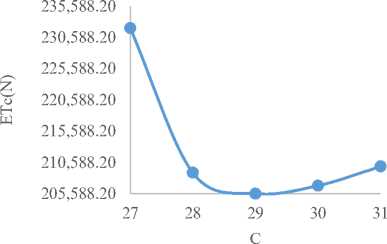
Fig.13. Expected Total Cost (ETc) against Number of Server(C)
98.1
96.1
94.1
92.1
90.1
88.1
86.1
84.1
0.0752 0.0952 0.1152 0.1352 0.1552
Ws
Fig.16. Utilization Factor (ρ) against Average Waiting Time in the System (Ws)
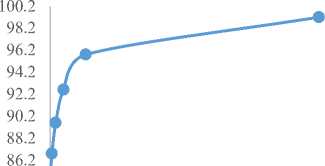
Similarly, in Fig.17 to Fig. 20 of group-E as shown below, Fig. 17 demonstrated that the ETc initially reduces and after a given optimum point started increasing with increasing number of doctors. It is also shown in Fig. 18 below that utilization factor decreases with increasing patients’ waiting time in the queue and utilization factor decreases as the number of doctors increasing in Fig. 19 respectively. Fig. 20 showed that the utilization factor increases as the average waiting time in the system increases respectively.
0.0038 0.0538 0.1038 0.1538 0.2038 0.2538
Wq
Fig.14. Utilization Factor (ρ) against Average Waiting Time in the queue (Wq)
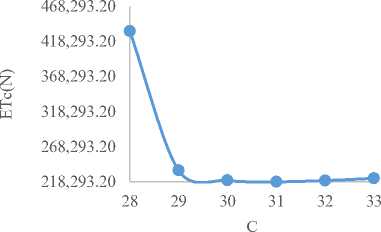
Fig.17. Expected Total Cost (ETc) against Number of Server(C)
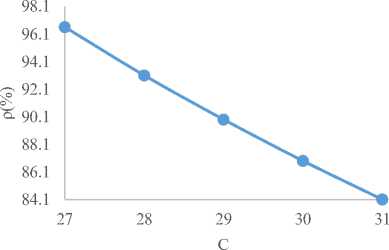
Fig.15. Utilization Factor (ρ) against Number of Server(C)
0.0027 0.0527 0.1027 0.1527 0.2027 0.2527
Wq
Fig.18. Utilization Factor (ρ) against Average Waiting Time in the queue (Wq)
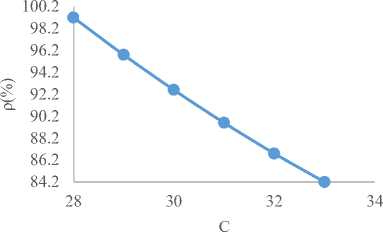
Fig.19. Utilization Factor (ρ) against Number of Server(C)
84.2 *
0.0582 0.1082 0.1582 0.2082 0.2582 0.3082
Ws
Fig.20. Utilization Factor (ρ) against Average Waiting Time in the System (Ws)
-
VI. Discussion
Table 2 of group-A teaching hospitals depicts that a 26-number of doctors is better than a 24-number of doctors in terms of the performance criteria used. With regard to cost considerations, a 26-number of doctors in the system records the lowest cost of N 185,243.9 compared to a 24-number of doctors that records N 225,873.9. These costs included the waiting cost and the service costs in the hospital. The average time a patient spends in the system and the queue are 0.0789 and 0.0123 hours respectively for a 26-number of doctors. Table 3 shows that optimal server level at the four teaching hospitals of group-B is achieved when the number of servers is 28 with a lowest expected total cost of N 195,167.5 per hour, having 0.0749 hour average patient time spends in the system and 0.0083 hour in the queue respectively .Table 4 indicates that optimum server level at the four (4) teaching hospitals of group-C, OOUTH, DELSUTH, UNTH and NAUTH is achieved when the number of servers is 28 with a lowest expected total cost of N 197,621.7 per hour, having 0.096 hour average patient time spends in the system and 0.0127 hour in the queue. Similarly, 29 and 31 number of doctors/servers with a minimum total cost of N 205,588.2 and N 218,293.2 per hour are indicated in Table 5 and Table 6 of group-D and group-E respectively. It should be noted that their patients’ average wait time in the system and queue at their optimal server levels are 0.083, 0.0116 hour and 0.0633 and 0.0077 hour respectively. The present study has shown that the time patients spend on
the queue before seeing a doctor affects their satisfaction significantly.
-
VII. Conclusion
The results of the analysis showed that average queue length, congestion and waiting time of patients in the system and queue could be cut down when the service capacity level of doctors at the twenty three(23) teaching hospitals are increased at a lowest expected total costs(which include waiting and service costs) as shown in tables 1-6. The study also recognizes the trade-off between the costs of rendering effective services and the costs of patients waiting time. As the hospitals attempt to raise its level of service, service costs increases which decrease the costs of patients’ waiting time. Whereas, this could be possible by using operation research models that look at optimality cost and should meet six aim to cross quality chasm of research [29] via: safe, effective, efficient, timely, economic, and targeted with clear need .
Acknowledgement
The authors sincerely wish to thank all concerned staffs of the twenty three teaching hospitals for their cooperation during the data collection for this research. The authors wish to thank International Journal for Information Technology and Computer Science.
References Optimality Test for Multi-Sever Queuing Model with Homogenous Server in the Out-Patient Department (OPD) of Nigeria Teaching Hospitals
- Kandemir-Cavas, C., Cavas, L, "Application of Queuing Theory to the Relationships between Insulin Level and Number of Insulin Receptors," Turkish Journal of Biochemistry, 32 (1): 32-38 (2007).
- Osorio and Bielaire, Describing Network Congestion with an Analytic Queuing to Network Model, Swiss Transport Research Conference, 2007.
- Costa, A. X., Riddely, S. A., Shahani, A. K., Harper, P.R., Desenna, V., and Nielsen, M,S., Mathematical Modelliing and Simulation for Planning Critical Care Capacity, Anaesthesia; 2003, 58, (1), 320-329.
- Bagust, A, place, M. and Posnett, J.W., Dynamics of Bed use in Accommodating Emergency Admissions; Stochastic Simulation Model. BMJ, 1999, 329: 155-163.
- Bitran, G., and Tirupat, D., Multi-product Queuing Networks with Deterministic Routing: Decomposition Approach and the Notion Interference, Management Science, 1988, Volume 34, PP 75-100.
- Koizumi, N., Kuno E and Smith, E. T., A Queuing Network Model with blocking: Analysis of Congested Patient Flow in Mental Health System, Health Care Management Science, 2002, 8(1): 49-60.
- Tutumi Y. and Newlands, D., Hospital Bed Capacity and Mix Problem for State Supported Public and Fee Paying Private Wards, Economic and Management, IESEG, School of Management, 2009, CNRS-LEM (UME 8129)
- Smith, D., and Mayhew, L., Using Queuing Theory to Analyze Governments Completion Time Target in Accident and Emergency Departments, Health Care Management Science, 2008, 11:11-21.
- Stakutis C., Boyle T., "Your Health, Your Way: Human enabled Health Care. CA Emerging Technologies," 2009, pp. 1-10.
- Chambers, Chester, and Panagiotis Kouvelis, "Modeling and Managing the Percentage of Satisfied Customers in Hidden and Revealed Waiting Line Systems". Production and Operations Management, 15(1), 103-116 (2006).
- Institute for Healthcare Improvement, Going Lean in Health Care. IHI Innovation Series. 2005 Available at: www.IHI.org - See more at:http://www.centrallogic.com/resources/patient-flow-journal /scholarship-recipient-strategies-to-enhance patient-flow#sthash.MdZVDEW7.dpuf
- Adeleke, A.R., Adebiyi, C.E. and Akinyemi, O., "Application of Queuing Theory to Omega Bank PLC, Ado Ekiti," International Journal of Numerical Mathematics, I(122):129 (2005)
- Klassen, R. D. and L. J. Menor., "The process management triangle: An empirical investigation of process trade- offs," Journal of Operations Management 25, 1015–1034 (2007).
- Foster E Michael, Hosking Michael R and Ziya Serhan," A Spoonful of Math helps the medicine Go Down : An Illustration of How Healthcare benefit from mathematical modeling and analysis", BMC Medical Research Methodology 2010, 10:60http://www.biomedcentral.com/1471-2288/10/60.
- Singh Vikas , "Use of Queueing Models in Health Care" 2006,www.scansims.org/sims2008/
- 02.pdf.
- Fomundam Samuel, Herrmann Jeffery, "A Survey of Queuing theory Applications in Healthcare" 2007, drum.lib.umd.edu/bitstream/1903/7222/1/tr_2007-24.pdf.
- Wilson MJ, Nguyen K., Bursting at the Seams: Improving Patient Flow to Help America's Emergency Departments. Urgent Matters ⁄ George Washington University Medical Center, 2004. Available at http://urgentmatters.org/media/file/reports_UM_WhitePaper_ BurstingAtTheSeams.pdf.
- Green L.V., "Using Operational Research to reduce Delays for Healthcare," In tutorials in Operational Research (Z,-L. Chen and S. Raghavan eds), 2008, 1-16. INFORMS.
- Green L., Soares J., Giulio J., and Green R., Using Queueing Theory to Increase the Effectiveness of Physician Staffing in the Emergency Department. Academic Emergency Medicine (January), 2006, 61–68.
- Georgievskiy igor, Georgievskiy Zhanna, Pinney William, "Using Analysis and Computer Simulation Modeling to Reduce Wating Time in the Hospital Admitting Department", 2002, http://www.flexsim.com/products/healthcare/docs/Reduce_Admissions_wait_times.pdf
- Royston Geoff , "Meeting global health challenges through operational research and management science", Bull World Health Organ 2011;89:683–688 | doi:10.2471/BLT.11.086066, Submitted: 19 January 2011 – Revised version received: 26 April 2011 – Accepted: 23 May 2011 – Published online: 5 July 2011.
- Mehandiratta Reetu, "Application of Queueing theory in Health Care", International Journal of Computing and Business Research, ISSN (online): 2229-6166, May 2011.
- Martha Hostetter and Sarah Klein , "In Focus: Improving Patient Flow—In and Out of Hospitals and Beyond: Commonwealth fund newsletters," 2013 , available at http://www.commonwealthfund.org/publications/newsletters/quality-matters/2013/october-november/in-focus-improving-patient-flow
- Hall, R. W., ed., Patient Flow: Reducing Delay in Healthcare Delivery. Springer, 2006, 1-44.
- Fink Ross and Gillett John, "Queuing Theory and the Taguchi Loss Function: The Cost of Customer Dissatisfaction in Waiting Lines", International Journal of Strategic Cost Management. Spring, 2006.
- Bolch, G.; Greiner, S.; de Meer, H.; Trivedi, K. S, Queueing Networks and Markov Chains: Modeling and Performance Evaluation with Computer Science Applications. John Wiley & Sons, 2001, pp. 209–262.
- Barbeau, Michel; Kranakis, Evangelos (2007, Principles of Ad-hoc Networking, John Wiley & Sons, 2007 pp. 42
- Kembe, M. M, Onah, E. S, Iorkegh, S. (2012). A Study of Waiting and Service Costs of a Multi-Server Queuing Model in a Specialist Hospital. Int. J. of Scientific & Tech. Research; 2012, 8:3.
- Naasir K., Saleh R., "Impact of Information Technology in Medicinal Research Evidence based Planning ", IJITCS, vol.15, no.1, pp.2091-1610, 2014.
