Optimization control actions for the electrolytic method of aluminium production

Author: Makeev A. V., Piskazhova T. V., Gofman P. M.
Journal: Siberian Aerospace Journal @vestnik-sibsau-en
Section: Informatics, computer technology and management
Article in issue: 3 vol.21, 2020.
Free access
The most common indicator of the aluminium production process managing efficiency is the cost of the metal production, but this concept includes a lot of components. First, this is the cost of raw materials and electricity in this region, as well as the labour cost per ton of products, consumption coefficients of raw materials and energy, capital costs for construction and repairs, waste disposal cost, environmental payments, etc. At the same time, there is no single functional of the process quality, depending on technological parameters, that is, the problem of complete and relatively strict mathematical process optimization as a whole is currently not solvable, not only because of its volume, but because of the lack of a complete efficiency model. In this study, particular efficiency criteria are considered, the improvement of which is aimed at the optimization model of control actions developed by the authors, which are selected based on the possible levers of the current automated process control system (APCS) for aluminium electrolysis. All tests were carried out on Virtual cell software without transfer to a real control object.
Aluminium production, process parameter optimization, automated process control system (APCS), Virtual cell.
Short address: https://sciup.org/148321752
IDR: 148321752 | UDC: 519.873 | DOI: 10.31772/2587-6066-2020-21-3-314-322
Text of the scientific article Optimization control actions for the electrolytic method of aluminium production
Introduction. Mathematical optimization procedures are used in control systems to select the best one or more actions from the range of their admissible values. The best impacts are understood as allowing achieving the minimum or maximum of the objective function, that is, when choosing the best complex impact on the process, it is necessary to consider three components:
-
– selection of specific impacts and restrictions on them;
-
– optimization method;
-
– target function.
There are a huge number of optimization methods, ranging from simple methods – brute force, coordinate descent, passing to methods of medium complexity – gradient, simplex and ending with genetic algorithms [1; 2]. It should be noted that this study does not provide an accepted scientific classification of methods, but only talks about methods that can be applied to the current task – optimization of control actions in the electrolytic method of aluminium production.
The technical and economic indicators of the electrolysis process efficiency are the power consumption per ton of aluminium produced the specific consumption of carbon and fluorides, as well as the current efficiency [3– 7]. Consumption factors are related to the current efficiency – the closer the amount of actually obtained metal to the theoretically possible, the lower the consumption of raw materials and energy in conditions of the same design and technology, but there may be some peculiarities, for example, the design may have a high current efficiency with good MHD index, but a large energy consumption due to increased heat loss.
We can consider such goals to achieve as a given melt temperature and cryolite ratio (CR) – an indicator of the electrolyte chemical composition, assuming that the technological personnel have already determined the effectiveness of the assigned values, and the optimization goal can be set to reduce the CR root-mean-square deviation (RMSD) and the electrolyte temperature from these target values.
Based on the foregoing, groups of criteria have been identified, according to which optimization is possible:
-
– RMSD of electrolyte temperature from a given target value;
-
– CR RMSD from a given target value;
-
– technological parameter target value achievement at the end of the optimization period;
-
– specific energy consumption for aluminium production minimization;
-
– current output maximization.
There is a division into multi-criteria and singlecriteria optimization with different methods of finding a local or global extremum, but we will assume that the objective function is composed in such a way that it has one minimum or maximum and includes our requirements for the technological process.
Description of the optimization method. To search for optimal influences, a gradient optimization method was chosen – the Cauchy method [8], which is based on the formula:
x ( k + 1) = x (k) - a -V f ( x ( k ) ), (1)
where the descent step α is a given positive parameter. Descent direction is determined by the components of the gradient vector V f ( x ( k ) ). Formula (1) assumes descent in the case of an n-dimensional vector of actions:
x ( k ) = ( x k , x k , x 3 k ), (2) where x ik – various control actions, at each descent step or when finding a gradient. The gradient for the case of three variables (in our case, three influences) is written as follows:
5f 5f 1 f
-
V f ( x ) = i -T^ + j —- + k . (3) d x 1 d x 2 d x 3
The method has two disadvantages: it becomes necessary to choose a suitable descent step, and the method is also characterized by slow convergence to the minimum point due to the smallness of the gradient in the vicinity of this point.
The main advantage of this method is its stability – with a sufficiently small length of the iteration step, the inequality f ( x ( k + 1)) < f ( x ( k ) ). There is a theorem on sufficient conditions for the convergence of the method with a constant step [9]. Taking this property into account, the Cauchy method can significantly reduce the value of the objective function when moving from points located at significant distances from the minimum point.
In our case, the advantage of this method prevails over its disadvantages. The optimization model based on the coordinate descent method was implemented earlier, the operation of which revealed drawbacks: low search speed and going to the local extremum, in addition, with an increase in the number of impacts, the speed of work significantly slows down, since the method goes through steps separately for each impact, therefore the gradient method is more appropriate.
The step was chosen experimentally according to the sensitivity of the objective function, and a very close approach to the minimum point is not needed – the calculation accuracy should not significantly exceed the measurement accuracy. Often, one descent (in the direction of the initial gradient) is sufficient to obtain the minimum of the objective function with sufficient accuracy.
Formula (1) assumes that the gradient can be calculated at each step of descent, but the following method is practically implemented – the gradient is calculated on the multidimensional initial cross of actions and then descent is carried out in the direction of the calculated antigradient vector until the optimized technological parameter reaches the goal, or until the RMSD of this parameter from the target stops decreasing. In the first case, the procedure is exited, and the optimization is considered to be successfully completed; in the second case, at the last point of descent, where there was a minimum RMSD, a new cross for all influences is built and a search for a new gradient is performed.
The control actions, on the basis of which the optimization procedure can be performed, are as follows:
-
– aluminium fluoride addition;
-
– set voltage;
-
– series current;
-
– metal level;
-
– electrolyte level.
The first three actions can be carried out by the automated process control system; the levels of melts are regulated by the technological personnel on the APCS instructions.
Virtual cell software method implementation. Virtual cell software is a physical and mathematical model that simulates the operation of an electrolytic cell for the aluminium production and is designed to study the dynamics of processes occurring in it [10–13]. This program is intended for process support personnel in order to assess the reaction of the reduction cell to control actions adequately.
The developed optimization procedure implementation was carried out in Virtual cell software in order not to harm the real control object, to evaluate all transient processes of technological parameters under complex influences and to eliminate all possible shortcomings before the implementation of this model in APCS.
At the moment, the control system already has an Electrolyte composition stabilization module [14; 15], which includes optimization for controlling the cryolite ratio (CR), but we want to expand the functionality with additional control actions and parameters for optimization, as well as target functions.
Let us describe the practical implementation of the method in Virtual cell software in terms of two influences – the addition of AlF 3 and the specified voltage; the calculation of the remaining effects in the software implementation is carried out similarly.
Fig. 1 shows a menu of initial conditions for the calculation which are requested from the APCS database for a specific reduction cell. After all calculations, the recommendations will also be transferred for the same reduction cell to the upper APCS level.
In the optimization interface (fig. 2) there is a choice between two methods – Coordinate method and Gradient method. The electrolyte temperature was chosen as the optimized parameter. The initial control actions values for fluorine and voltage additions, as well as the criterion for the completion of the optimization, are also set by the user in the interface. In this case, the following additives were selected: 5 kg of AlF 3 and 50 mV of the set voltage, as well as the criterion for exiting the optimization – reaching the minimum RMSD temperature from the target, respectively.
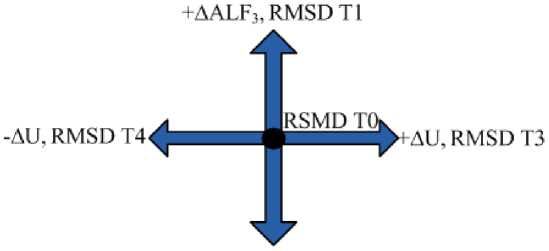
The calculation begins with the construction of a cross (fig. 3), on the vertices of which are the selected impacts with a given value. During the descent, the steps in the directions will change, but the cross always counts with the initially specified additions. Next, the root-meansquare deviation of the electrolyte temperature from the target (RMSD T) is calculated at cross four points, as well as in its middle.
Then, we calculate the gradient consisting of partial derivatives numerically (using the finite difference method):
DIF _ AlF3 = ( RMSD (Т1)- RMSD (Т2)) / (2 ■ A A1F 3 ); (4)
DIF _ U = ( RMSD (Т3)- RMSD (Т4))/(2 ■A U ). (5)
We check the difference of the gradient from zero with the specified accuracy. The vector length must be nonzero
Modgrad = V ( DIF _ AlF 3)2 + ( DIF _ U )2 .
If it is not zero, we calculate the direction of descent to the minimum in the inner loop, otherwise, exit from optimization. Inner loop:
AA AlF3 k =AA AlF3 k - 1 - step ■ DIF _ AlF3 ■A AlF3; (6)
AA U k =AA U k - 1 - step ■ DIF _ U ■A U . (7)
ΔΔAlF 3 , ΔΔU are the steps of the internal descent, at the first descent step they are equal to ΔΔAlF 3 and ΔU, or zero, then they are recalculated. Deltas of actions, found by formulas (6)–(7), are added to the current values of raw materials and stress addition
AlF3 k = AlF 3 0 + AA AlF3 k ; (8)
U k = U 0 +AA U k (9)
and we calculate RMSD T, working out these actions during the set optimization days in Virtual cell software. RMSD T should decrease and during the first calculation using formulas (8) – (9) it should be less than RMSD T0. Compare with the previous value in this inner loop, it should be done:
RMSD ( Т k ) < RMSD(Т k - 1). (10)
We set Step to 1 / Modgrad. Further, during debugging for use in the control system algorithms, the step for each action can be set separately.
There are two ways to exit the inner loop:
-
– RMSD has ceased to decrease, then we need to turn to formulas (4) and (5) and recalculate the cross, gradient, and start the inner cycle again, but the cross will be in a new place, that is, in the middle of the cross, point T0 is now the initial values of AlF 3 0 and U0 will be assigned to the last values found by formulas (8) and (9);
– the temperature deviation from the target value is within the specified accuracy, for example, less than 0.5 degrees, then the optimization are completed.
There should be an exit from the loop optimization procedure: the RMSD in the middle of the last crosses are compared, or the last three RMSD in the descent, if they are equal, then it is necessary to exit the optimization and stop at the last effect calculation. The looping is associated with the fact that the procedure, when choosing the actions, reaches the imposed restrictions, for example, the addition of aluminium fluoride cannot be less than zero, and this is required to increase the calculated CR.
Visualization of the optimization block in Virtual cell software. When optimization is activated, a new implemented method: the gradient method (fig. 4) and the Optimization tab with two graphs become available in the results display interface window.
The optimization progress is shown on the left graph: the magnitudes of impacts and the achieved values of the optimized parameter for each experiment are displayed. On this graph, we can observe which side the optimization is moving, calculating the impact magnitude to achieve the target value of the optimized parameter.
For example, according to fig. 2, the optimized parameter was chosen: electrolyte temperature (target 952 ° C), and the effects: AlF 3 addition and voltage setting . In experiment No. 1 (according to fig. 4), the impact values were as follows: AlF 3 addition = 35 kg and voltage setting = 4.23 V, while the optimized parameter (electrolyte temperature) reached 958 ° C; in experiment No. 2, the values of the actions were: AlF 3 addition = 35 kg and voltage setting = 4.28 V, the optimized parameter reached 960 ° C, etc. The cross calculation ended in experiment 5, and experiments 6 and 7 were steps towards the descent.
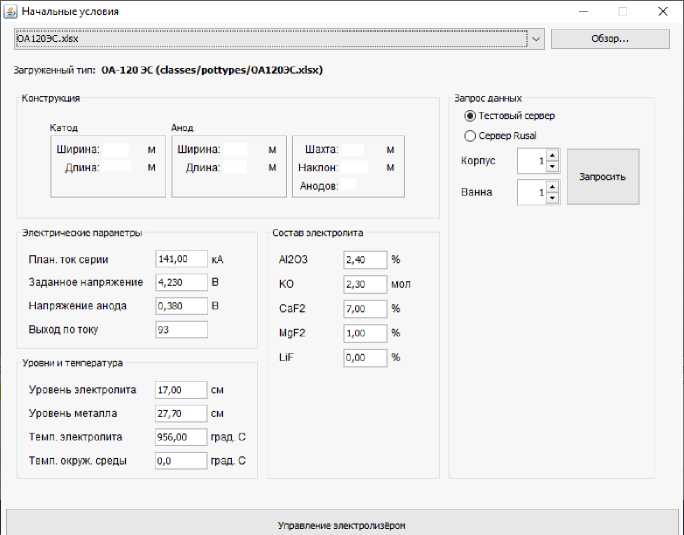
Fig. 1. Initial conditions interface
Рис. 1. Интерфейс начальных условий
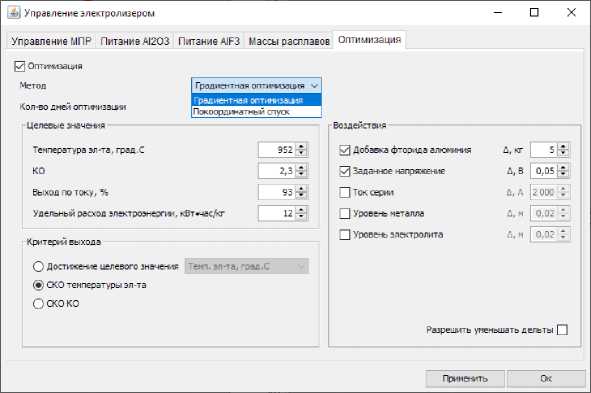
Fig. 2. Optimization interface in the Virtual cell software
Рис. 2. Интерфейс оптимизации в ПО «Виртуальный электролизёр»
-AALF;, RMS I) T2
Fig. 3. Cross impacts for optimization
Рис. 3. Крест воздействий для оптимизации
6А88888$188696А6Я$6Й88$818Й$ЙЙ888
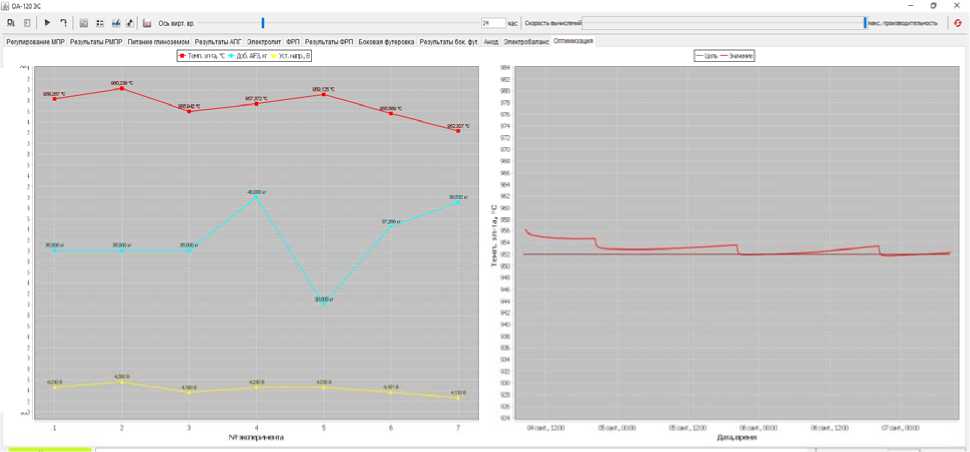
Fig. 4. Optimization tab
Рис. 4. Вкладка «Оптимизация»
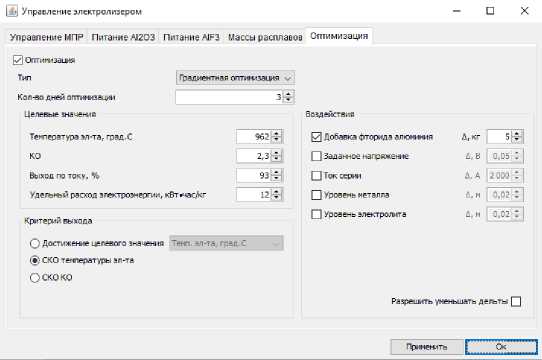
Fig. 5. Optimization conditions in the test No. 2
Рис. 5. Условия оптимизации в тесте № 2
The graph is drawn and supplemented until the optimization reaches the goal, while in the case of gradient optimization, the goal can be achieved, for example, in experiment No. 7, but the optimization will continue a few more steps forward. If the optimization indicators do not improve, all subsequent experiments after the 7th will be removed from the graph and the optimal values of the parameters for achieving the goal will be seen in the last experiment No. 7.
The right graph displays the transient process of the optimized parameter (fig. 4). The graph is redrawn for each experiment, and at the end of the optimization, a transient process is displayed on it, corresponding to the experiment in which the optimization goal was achieved. We can see in detail the value of the graph at any time point in virtual time by hovering the mouse cursor over the desired location.
All subsequent tests are performed under the initial conditions indicated in fig. 5–7, the goals and optimization parameters change. In the next test No. 2, we will perform the optimal increase in the electrolyte tempera- ture only due to the AlF3 addition. Fig. 5 shows optimization conditions.
In fig. 6 and 7 shows the choice of reducing the daily AlF3 addition from 35 to 15 kg to increase the electrolyte temperature from 956 to 962 degrees. In contrast to test No. 1, the daily consumption and daily supplement at the beginning of the calculation was 35 kg. On the left graph in fig. 4, in experiments 1 and 2, the algorithm determined where to go, and then, in 3 steps of descent, we reached the set temperature.
Test No. 3 represents optimization with three control actions. In fig. 8 shows the selected effects to reduce the electrolyte temperature from 956 to 950 degrees. Unlike test No. 1, the program here reduced the dose of aluminium fluoride, reduced the voltage and raised the height of the metal by 4 cm, which can be seen in the results output in fig. 9. In fig. 10 the first seven calculations (experiments) made a three-dimensional cross, and then down to point 11 were carried out, then the program began to build a new cross, and at one of the new cross points it reached the specified accuracy.
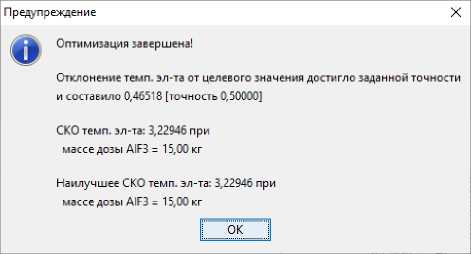
Fig. 6. Optimization results for the test No. 2
Рис. 6. Результаты оптимизации по тесту № 2
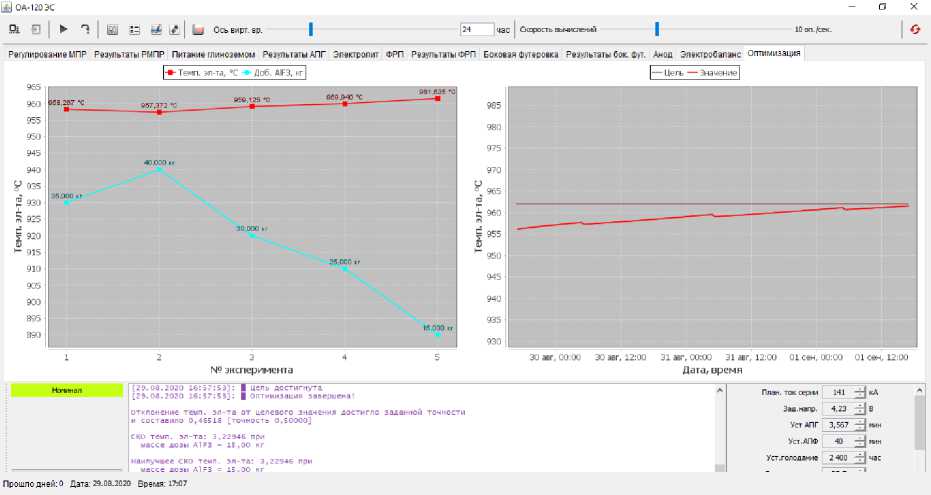
Fig. 7. Optimization procedure visualization in the calculation No. 2
Рис. 7. Визуализация процедуры оптимизации при расчете № 2
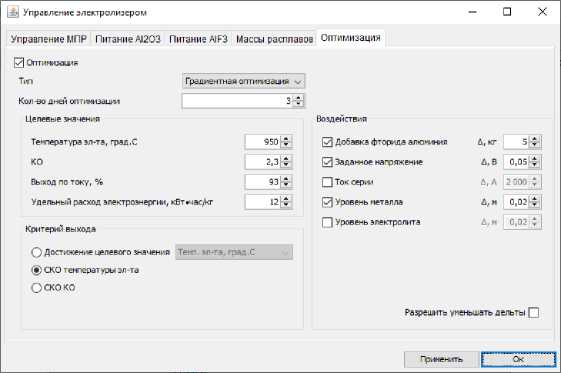
Fig. 8. Optimization conditions in the test No. 3
Рис. 8. Условия оптимизации в тесте № 3
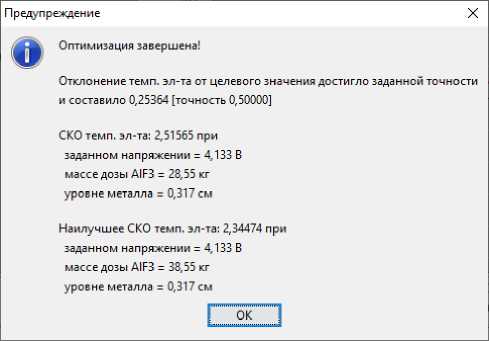
Fig. 9. Optimization result for three control actions
Рис. 9. Результат оптимизации при трех управляющих воздействиях
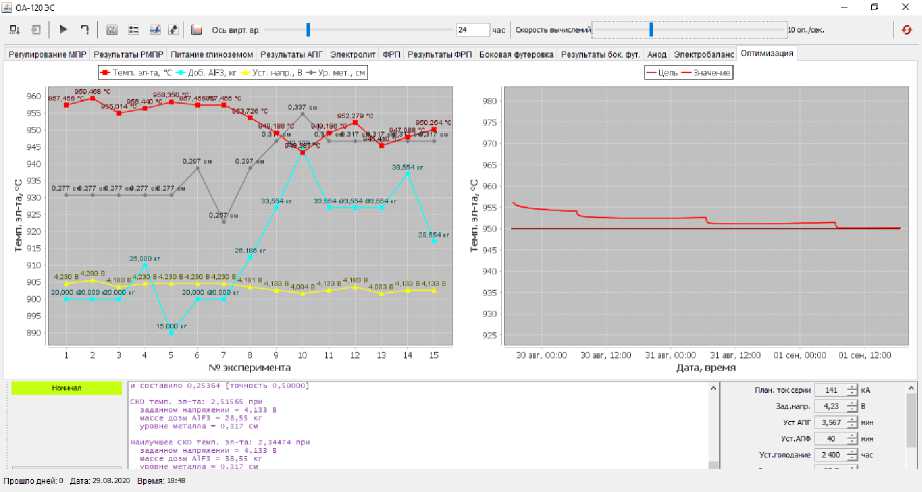
Fig. 10. Interface of optimization results with three influences, test No. 3
Рис. 10. Интерфейс результатов оптимизации при трех воздействиях, тест № 3
Conclusion. In the study, the new algorithm for calculating the complex control action by the gradient descent method was developed, software implemented and tested to improve the speed and accuracy of calculations in Virtual cell software. An interface for visualizing the operation of the optimization unit and its settings was developed. The progress of the optimization calculations is visible to the user, as well as the optimized parameter behaviour.
The developed optimization model, when introduced into the control system, will improve the control quality of the technological process of aluminium production by the electrolytic method, reduce the specific power consumption and reduce the number of electrolysers with a disturbed technological operation mode. The group of the described target functions adds variability in possible ways to optimize certain technological parameters, but for practical use in the control system algorithms, it is more important to achieve the target parameter and this will be taken into account during implementation.
References Optimization control actions for the electrolytic method of aluminium production
- Glebov N. I., Kochetkov Yu. A., Plyasunov A. V. Metody optimizacii [Optimization Methods]. Novosibirsk, NGU Publ., 2000, 312 p.
- Nogin V. D., Protod'yakonov I. O., Evlampiev I. I. Osnovy teorii optimizacii [Fundamentals of optimization theory]. Moscow, Vysshaya shkola Publ., 2000, 214 p.
- Galevskij G. V., Kulagin N. M., Mincis M. Ya., Sirazutdinov G. A. Metallurgiya alyuminiya. Tekhnologiya, elektrosnabzhenie, avtomatizaciya [Metallurgy of aluminium. Technology, power supply, automation]. Moscow, Flinta, Nauka Publ., 2008, 529 p.
- Vetyukov M. M., Tsyplakov A. M., Shkolnikov S. N. Elektrometallurgiya alyuminiya i magniya [Electrometallurgy of aluminum and magnesium]. Moscow, Metallurgiya Publ., 1987, 320 p.
- Mintsis M. Ya., Polyakov P. V., Sirazutdinova G. A. Elektrometallurgiya alyuminiya [Electrometallurgy of aluminum]. Novosibirsk, Nauka Publ., 2001, 368 p.
- Bonnardel O., Homsi P. Process for regulating the temperature of the bath of an electrolytic pot for the production of aluminium. U.S. Patent Nо. 5,882,499. 1999.
- Marois Marc-Andre, Bertrand Clement, Desilets Martin, Coulombe Marie-Michelle, Lacroix Marcel. Comparision of two different numerical methods for prediction the formation of the side ledge in aluminium electrolysis cell. Light Metals. 2009, P. 563–568.
- Goncharov V. A. Metody optimizacii [Optimization methods]. Moscow, Yurayt, Vysshee obrazovanie Publ., 2010, 186 p.
- Spirin N. A., Lavrov V. V., Rybolovlev V. Yu. et al. Matematicheskoe modelirovanie metallurgicheskih processov v ASU TP [Mathematical modeling of metallurgical processes in automated process control systems]. Ekaterinburg, UIPC Publ., 2014, 558 p.
- Belolipeckiy V. M., Piskazhova T. V. Matematicheskoe modelirovanie processa elektroliticheskogo polucheniya alyuminiya dlya resheniya zadach upravleniya tekhnologiey [Mathematical modeling of the process of electrolytic production of aluminum for solving problems of technology management]. Krasnoyarsk, Sibirskiy federal'nyy universitet Publ., 2013, 271 p.
- Certificate No. 2017612828 on state registration of a computer program. Educational and consulting program "Virtual electrolyzer", version 2.0. / Piskazhova T. V., Zavadyak A.V., Puzanov I. I., Tolkachev N. M., Makeev A. V.; zareg. in the register of computer programs 03 March 2017.
- Piskazhova T. V. [Method for optimal control of the chemical composition of the electrolyte in the production of aluminum]. Vestnik SibGAU. 2010, No. 3 (29), P. 153–158.
- Stevens McFadden Fiona J., Geoffrey P. B., Austin P. C., Welch B. J. Application of advanced process control to aluminium reduction cell – a review. Light Metals. 2002, P. 1213–1220.
- Dupuis M., Lacroix R. Development of a 2D+ dynamic model of an aluminum reduction cell. Proc. 38th conf. Light Metals, CIM, Quebec. 1999. P. 41.
- Wang Z. et al. Studies on waste heat recovery in aluminum electrolysis. Book of papers of the ninth international congress “Non-ferrous metalsand minerals”. 2017. P. 209–226.
