Optimum Features selection by fusion using Genetic Algorithm in CBIR

Author: Chandrashekhar G.Patil, Mahesh.T.Kolte, Prashant N.Chatur, Devendra S. Chaudhari
Journal: International Journal of Image, Graphics and Signal Processing(IJIGSP) @ijigsp
Article in issue: 1 vol.7, 2014.
Free access
The evaluation of the performance of the Content Based Image Retrieval is undertaken for the consideration in this paper. Here the point of the discussion is the performance of the CBIR system using object oriented image segmentation and the evolutionary computational technique. The visual characteristics of the objects such as color, intensity and texture are extracted by the conventional methods. Object oriented image segmentation along with the evolutionary computational technique is proposed here for Image Retrieval Algorithm. Unsupervised Curve evolution method is used for object oriented segmentation of the Image and genetic Algorithm is used for the Optimum Classification and reduction in the Feature dimensionality. The Algorithm is tested on the images which are characterized by the low depth. The Berkeley database is found to be suitable for this purpose. The experimental result shows that the Genetic Algorithm enhances the performance of this Content Based Image Retrieval and found to be suitable for optimization of features selection and compression technique for Feature space.
CBIR system, color histogram, edge histogram descriptor, Feature vector, genetic algorithm, Image retrieval, texture feature, query image
Short address: https://sciup.org/15013466
IDR: 15013466
Text of the scientific article Optimum Features selection by fusion using Genetic Algorithm in CBIR
Published Online December 2014 in MECS
The content- based image retrieval (CBIR) has recently gained more attention from the researcher around the world for image management and search of image of user's interest. The increasing advancements in the field of multimedia applications demand the more and more efforts in the image management applications. The areas like academia, photography, hospitals, research, governance etc are dealing with growing number of digital images that are being created by their daily routine processes. Efficient Image Segmentation has the great importance since it leads to the excellence in Image interpretation. The applications, based on Image semantics are hence still drawing more and more attention of the researchers on image segmentation [1]–[5].
The partition of finite number of non-overlapping regions of the image is the major objective of the segmentation process. The criterion on which the image regions may be separated is the coherency of the characteristics or properties of the pixels belonging to those regions. The color, intensity, or texture is the major characteristics of the pixels under consideration [5], [6]. The earlier popular methods used for image retrieval were metadata like tags, keyword indexing or just browsing. The major disadvantages of such methods were 1.creation of a lot of garbage while searching and 2. Need of tagging of all images manually. Fig. 1 shows the typical block diagram CBIR system. The user has freedom to select any query image and CBIR system presents the group of similar images in response to this query. In 1992, T. Kato had introduced the first Content-based image retrieval. The enormous growth in images due to easy and cheaper availability of cameras, wide inclusion of images in governance and corporate processes, demands an efficient CBIR systems. QBIC, Virage, Retrieval Ware, Photobook, WebSeek, VisualSeek, Chabot, MARS system, Netra, and CANDID are some of the successful and popular CBIR systems which are fruits of the efforts of the researchers. These CBIR systems include general and specialized system like medical images retrieval system. Most visual features of an image are only performance controlling parameters of the Retrieval systems. To retrieve the correct Image from the system which is maximally correlated with the query image provided by the user, the system must have the storage of the sufficient amount of the database of images in advance.
The proper set of features is required to be extracted from these images with the conventional and classical image analysis methods from the Image processing techniques. The color, shape, texture, region or spatial features may be the major components of this set of features. The Feature vector may be used in two ways-either separately or in the combined form for semantic representation of the image. Segmentation of the image for object detection in the image is another good approach for semantic representation of the image. A considerable amount of efforts were taken by the researchers on such image segmentation with respect to these simple features. [3]– [5]
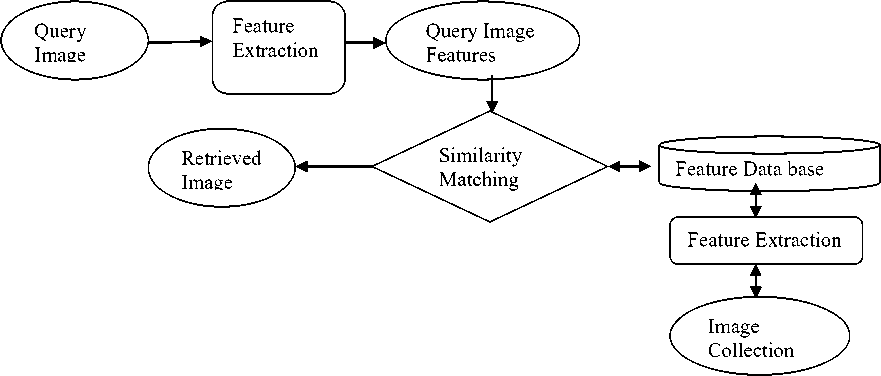
Fig 1. The CBIR system-general approach
Generally it has been observed that the different objects in the image with the similar class of features viz. color, intensity or texture, etc. are very rarely available. The major reason for this is the non-uniform focusing of the camera lenses at the time of capturing the images. Depth of the Field may be used for clear distinguishing between the objects of interest in the image and the corresponding background. [6]
The Images from Berkeley Dataset are selected here to explore the visual characteristics in better way. Fig. 2 shows an example of such images. The user may provide directly the features of the query image (query features) instead of the image. The query features (either extracted from the query image or directly available) may be compared with the features of the images from the data base. The comparison based on the distance between the two feature vectors may provide the image from the data base with the least distance with respect to the query feature vector. Depending upon the distance, the set of similar images may be presented as a "retrieved indexed images".
This paper focuses on the technique for selection of the appropriate feature elements from the combined feature vector using the evolutionary computation method based on genetic algorithm. The experimental results presented in this paper shows that this optimum feature selection technique enhances the image retrieval system performance.
The remaining sections of this paper are arranged as follows. The next section takes a small review of the relevant work done in the area of CBIR. Section 3 deals with the detailed methodology for extraction and formation of combined feature vector. This extraction of feature mainly consists of the two methods. One with conventional method to extract the basic low level features and second is based on object detection. Section 4 elaborates the evolutionary computation method for fusion of these features to form a combined feature vector. The experimental results of image retrieval system are depicted in Section 5 along with the discussion and the Section 6 concludes the paper.
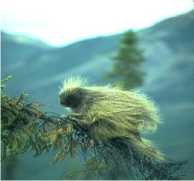
Fig 2. A Low depth Image
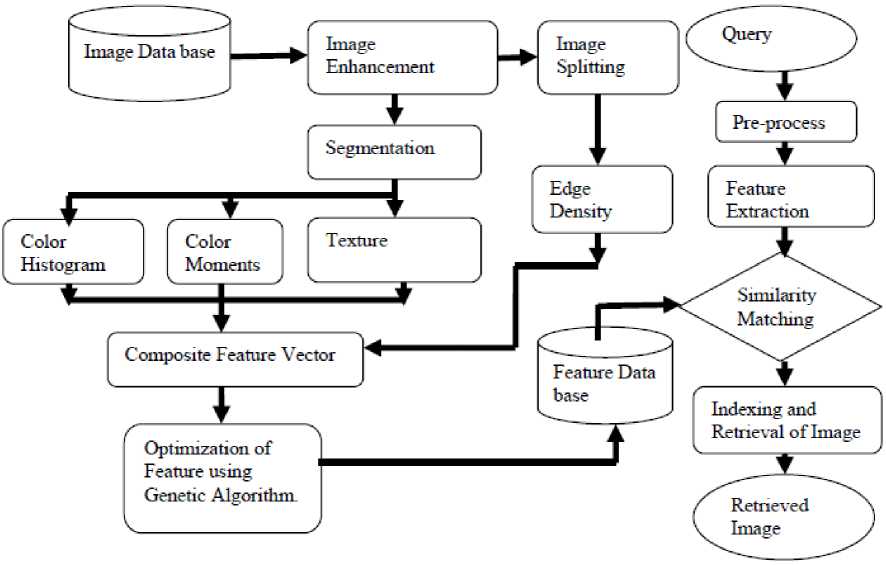
Fig 3. Block schematic - proposed approach.
-
II. Relevant Work
The dominant features from the images that are generally used for CBIR system are color, texture and shape information. These features have been used in various combinations form also. The color feature is the most effective, significant and common feature that has been used. The usefulness of the color feature in object identification was demonstrated for the first time by Swain and Ballard [7]. Afterword it was transformed into its variants like a color histogram, color moments [8], and color correlogram [9] and further exploited in [10] for the CBIR system where efficient combination of multi-resolution color and texture features were used.
Amato [11] has explored the detection techniques and effectiveness of the Edge feature which is second significant feature of the image. The average precision for each image class was found by using color, texture and shape features and is depicted in [ 12 ] . Zhang in [13] had adopted a little different approach where artificial neural network was deployed for eliminating unlikely candidates rather than pin-pointing the targets directly. The dedicated and special class of CBIR system that uses Blood-cell analysis method is described in [14]. The localized system is considered for the retrieval of the relevant portions of the image and demonstrated exclusively [15], whereas the relevant feedback based CBIR system is presented in [16, 17].
-
III. System Methodology
For the feature extraction from an image, a conventional method may be adopted. According to this the decomposition of an image into the non-overlapping blocks and then extraction of edge information in the form of edge histogram is employed here on each of the block.
An anisotropic diffusion method described in [12] is used before applying segmentation technique. The Curve Evolution method is used here for segmentation of the
Image [6, 18] the functional block diagram of proposed CBIR system is shown in Fig. 3.
The steps of the methodology are as described below
-
1. Querying: In put Sample Image provided from the user as the query for the system
-
2. Extraction of Edge information: Edge Histogram Descriptor is calculated and extracted for obtaining edge information from the image
-
3. The Object Detection/Image Segmentation: The hybrid active contour model is used to get the object wise image segmentation
-
4. Spectral Feature Extraction: The Spectral features such as Color moments and Texture information is extracted from these segments.
-
5. Formation of Combined feature vector: The evolutionary computation technique based on Genetic algorithm is employed for selection of optimum features.
-
6. Correlation computation: The system computes the similarity or the correlation between the query images and the database images features using Euclidean distance algorithm.
-
7. Retrieval: Based on the correlation computation, a sequence of images in decreasing order of similarity is presented. The most similar images will help the user to find relevant images.
-
A. Edge Histogram Descriptor
Edges information is most significant and important feature of an image that may be used for description of
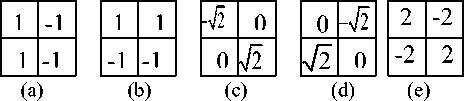
Fig 4. Masks for (a) vertical, (b) horizontal, (c) 45 degrees, (d) 135 degrees, and (e) non-directional edges the image Content. Human vision system for Content Retrieval is very sensitive to edge features for image perception. This edge information may be represented in many ways. Histogram is one of the most popular and efficient method for its representation. The frequency and the directionality of the brightness changes in the image are the major components of an edge histogram. The edge histogram descriptor (EHD) may be used here to describe edge distribution with a histogram based on local edge distribution in an image. The various stages in an extraction process of EHD are depicted as follows
-
1. Image Splitting/Partitioning-The image is divided into small non-overlapping 4 × 4 sub image blocks.
-
2. Categorization of the Edges in the sub Image into five types: vertical, horizontal, 450 diagonal, 135 0
-
3. Filtration using masks (filters) as shown in Fig. 4.Thus, the histogram for each sub image represents the relative frequency of occurrence of the five types of edges in the corresponding sub image.
-
4. Normalization of the five-bin values obtained by the histograms of all the sub images
-
5. Quantization for the binary representation.
diagonal, and non-directional edges.
These normalized and quantized bins constitute the EHD.
-
B. Segmentation
The images of the objects are formed by the camera lenses and are different for near and far distanced objects. The image distance is defined as the distance from the Image to the lens. The object distance and the Focal length of the lenses decide the Image distance. The object that is to be separated from the background has more sharpness as compared to the background region because of the unevenness in the focusing of the lenses. Therefore such objects can easily be separated from the background by using de-blurring models . t he w iener and g aussian kernels are most popularly used de-blurring kernels. The original image along with this de blurred image may be used to find out the contours that surrounds the focused objects. The hybrid active contour model, suggested by Jiangyuan Mei, Yulin Si, and Huijun Gao [6] can be used for this purpose.
This active hybrid contour model uses an energy function which is composed of global and local terms. The curve evolution is carried out by using this energy function. This is an unsupervised curve initialization method that reduces the number of curve evolution iterations.
The Image with the Non-uniform Depth of Field can be modeled as f I (x,y)=f LD(x,y) . f HD (x,y) (1)
where LD(x,y) = Low Depth region of the image and HD(x,y)=High Depth region of the image
The unsupervised segmentation is to separate out the LD region from the HD region of the image without any human interference. The Objects are represented by the LD regions.
The HD image region is greatly influenced by the space-invariant blurring function, which is usually assumed as the Gaussian function with a blur parameter σh..Besides this blurring function the entire image is also affected by the noise that is also Gaussian in nature. Therefore the general mathematical model of the noisy image can be depicted as f I(x,y)=[f LD(x,y) + v(x,y)] и f DD(x,y) + y(x,y)] (2)
where, ψ(x ,y) represents the Gaussian Noise with zero mean and σ2 as variance. As the de-focused region is also influenced by the space-invariant blurring function, it can be shown as f HD (x, y)= [f HD (x , y)] +y(x, y)]*S(x, y)] (3)
where, S(x,y) represents blurring function due to space-invariance. In order to separate the LD region and HD region it is necessary to apply a simple distinguishing function which is binary in nature and as described below
D(x, y) =
1, V (x, y) € f LD (x, y)
0, V (x, y) e f LD(x, y)
Therefore the mathematical model for low DOF images as proposed by [19] is f!(x,y) =D(x, y)*[ f LD(x,y) + у(х,у)]+ [1 - D(x,y) *
fHD(x,y)+ v (x,y)]* S(x,y) (5)
For separating the Focused region and de-focused region of the image it is necessary to apply the blurring function to this image. Since Focused region exhibits more sharpness than the de-focused region of the image, the only Focused region will be dominantly observed in the re-blurred image, that will help us to find out the objects from the background region of the image. The Gaussian Kernel is employed here as blurring function with σ g is the blurring parameter.
I blurred (x,y) = f I(X, y) *G(x,y) (6)
where G(x,y) is Gaussian Kernel.
The Focused Image Object Map (FIOM) is obtained when the re-blurred image is subtracted from the LDF image.
FIOM(x,y) = | J I(x,y) * I biurred (x, y) | (7)
The selection of the blurring parameter due to the space invariance and the blurring parameter due to the Gaussian kernel has significant impact in the form of holes and cavities in the segmented result and hence on the detection of the object especially in case of some smooth region of the image. It has been observed that a small value of Gaussian Kernel blurring parameter found to be very effective for clear and sharp details in the Focused region of the Image. On the other hand for the smooth regions, a larger value of Gaussian Kernel blurring parameter is suggested to widen the size of the Gaussian kernel. To overcome this problem a multi-scale method for re-blurring the image is suggested. A 2D Gabor transformation proposed in [20] is employed here for the multi-scale and multi-orientation data fusion process. This helps in automatic selection of the blurring parameter.
Gabor filters are basically band pass filters. The major application of such types of filters is in image processing. Feature extraction, Texture analysis, and Stereo Disparity estimation are few of the tasks in image processing that can be efficiently evaluated using this Gabor Filters.
To get an impulse response of these filters, an Gaussian envelope function is multiplied by a complex oscillation. Gabor [9] showed that these elementary functions minimize the space (time)-uncertainty product. The general formula of 2D Gabor filters is described as
G(u, X, 9, a, Y) = e" A (8)
Where
A= 〔
[(U2 + Y V2 ) ] [12 n [U]] s ( 2 g 2 ) + X
Where
U=u cos ( θ ) +v sin ( θ ) and
V= - u sin ( θ ) +v cos ( θ );
λ =wavelength of sinusoidal factor;
θ =the orientation of the normal to the parallel stripes of a Gabor function;
σ =standard deviation of the Gaussian envelope and
γ = the spatial aspect ratio.
The multi-scale and multi orientation data fusion process is then carried out to reconstruct the original image after 2D Gabor filtering. In detail, pixel at the position of (x, y), when it get filtered by the 2D Gabor filter function will become a plurality with amplitude
Mi,j= 7[R ea К F) + Imag (/)]
Where
The data Fusion rule can be set as
Gabor_I=maxi,j[M i,j ](11)
Hence, the blurry image (Fig. 6) that is to be extracted from a low DOF image is
Blurred_I(x,y)=[I(x,y)-Reg[Gabor_I](12)
where Reg[ ] denotes the regulazition of the image after the translation and scaling.
Re-Blurred Image
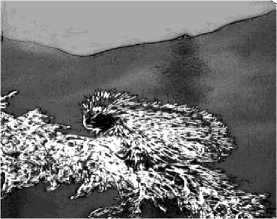
Fig 6. Re-blurred image
-
C. Energy Minimization with Active Contour Model
The general and widely acceptable technique of matching a deformable model to an image is an active contour models (snakes).The Contours are obtained by using energy minimization method. Any starting point can be selected from the image space. For any specific constraints, the snake will deform in to alignment with the nearest salient feature in that image from the starting point. The local minima in the energy generated by image processing may be the features of the image to which the snake will try to deform in to alignment. In deformation process the snake will be guided by the high-level mechanisms by the way of interaction. This interaction will lead the snake towards the features of interest.
As compared to most of the other image segmentation techniques, the snakes are continuously active. The energy minimization process takes place as a result of the changes in high-level interpretations. Even in the absence of such changes the models will respond to moving image features. Image processing techniques may be used to estimate the locations of interesting features, which are then refined using snakes.
An energy minimizing contour with the controlling parameters which may be used for deformation of a initial curve in order to segment the image is called as a “snake”. This deformation process takes place over a series of the time instances. The elements along the contour depend on two parameters. The first one is the Space and the second one is the Time. The variation range of the parameter “Space” may be considered as 0 to N-1 for N discrete points.
Mathematically it can be expressed as
Y= [I(x,y)*G(i,j)]2
s → S ∈ { 0,N-1 }
whereas the Time parameter may be taken in terms of the number of cycles or the iterations. Considering these parameters, it is possible to define the mathematical model of the contour “snake” U as
U (s, t) = ( x (s, t), y(s, t) ) (14)
The mapping of the points from the parameter space domain with the points from intensity image domain at the given time will be carried out. The sum of the energy of the individual snake elements constitutes the total energy E snake of the model is
E snake = ^ 1 E elements(U(s,t))ds (15)
The energy equation depicted in eq.15 represents the energy for an open loop snake. When the first and the last elements of this open loop snake are joined together then the snake will become a closed loop snake [21].
The total energy is constituted by three basic energy terms:
E element = E internal ( U ) + E external( U ) + E image ( U ) (16)
The internal constraints such as tension and stiffness to the model will be provided by the internal energy E internal that incorporates regularizing constraints. Mathematically it can be expressed as
E internal = a (s) I , 1 2 + P (s) I । 2 (17)
The first term which is a first-order energy term is controlled by a ( 5 ), and a second term which is a second-order term of an energy is controlled by P (s).
The contraction of the snake curve is possible by minimizing the first-order energy term. It is possible because of the introduction of tension parameter in this contour equation. On the other hand if the second-order term in the Internal Energy equation is minimized then the capability of the snake to resist for bends may be improved by producing the necessary stiffness .
The high level external constraints such as human interaction or automatic curve initialization process are represented by an external energy denoted by E external . These external forces may be used to control external attraction and repulsion forces. The active contour model will be forced either towards the image features or away from the image features. This movement of the active contour is governed by these forces.
The attraction and repulsion force works like spring. It exists between a snake element U and a point I in an image using the following external energy term:
E external ( U ) = * | i - U | 2 (18)
When a snake element U is found to be equal to that of Image point I, then energy becomes zero. On the other hand if the difference between U and I is +/- 1, then energy will be equal to k.
Eimage is the image (potential) energy that forces the contour model towards salient features of the image. The total image energy can be expressed as a weighted combination of these functions.
E image ( U ) = X* E line ( U ) + Y* E edge ( U ) +Z* E term ( U )
where X,Y and Z are the weight required for scaling of the corresponding energy function viz. line, edge and corners. For example, E line (U) represents weights for energy function for lines in the images. This energy fuction along with the force in the form of weight forces the contour towards the line. A greedy approach is used for this algorithm. It will help to select locally optimal solutions. The final solution will be globally optimum. The stiffness and tension in the energy model makes it work like a rubber band with a noticeable elasticity. Continuous stretching and release of the snake around the object to be segmented is observed during the process.
The algorithm for this contour deformation may be explained as follows.
-
1. Pre-processing -Convert the image in intensity form.
-
2. Define No. of iterations
-
3. Energy determination- For each point in the local neighborhood is calculated i.e for each pi , for V i = 1, . . , N , from image space find its M x M neighborhood to get the location that minimizes the energy functional;
-
4. Shifting to local minima-The point is moved to the next point with lowest energy function Move pi to that location.
-
5. Estimation of the curve- Estimate the curvature of the snake at each point and look for local maxima (i.e., corners);
-
6. Stiffness setting -Set the stiffness controller P j to zero to eliminate the corners. For each p j at which the curvature is a local maximum and exceeds a threshold.
-
7. Repeat steps 1-6 until only a very small fraction of snake points move in iteration and stability of the position of the points is achieved.
The Segmented image after application of this algorithm is as shown in Fig. 7.
-
D. Color feature extraction
The most popular tool used for segmentation of an image is to use a Color histogram. A histogram of a grayscale image represents the frequencies of occurrence of discrete gray level whereas, a color histogram contains occurrences of each color. The color histogram is obtained by counting all pixels of a color image having the same color. The conventional color histogram, generally represents the pixels of the color image in their respective bins or groups. The grouping is based on the color of an individual pixel and not on the inter color relationship to other pixels.
This method has been found to be disadvantageous as the discrepancies related to variation in illumination and quantization errors are significantly recorded and data storage and processing problems are being observed due to large number of colors. Therefore, it may be beneficial if any other logical and fine approach for color histogram formation is adopted for optimum results. The algorithm mainly focuses on rearranging the bins that may have fewer quantization levels which represent the similarities between the colors. The segments extracted by following the above algorithm are used to find the histogram of the segments. Three color features are extracted i.e. mean, standard deviation and median from the histogram,. In this way it may be possible to get three features and three planes per cluster or 3x3 features per segment or cluster, per image.
740 Iterations
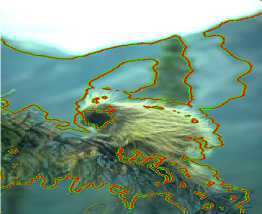
Fig 7. Segmented Image
-
E. Texture feature extraction
The surface property of an object and their relationship with the surrounding environment or Texture Feature is an important image content descriptor. The performance of the CBIR system may be improved by selecting the proper texture descriptor. Generally a gray level co-occurrence matrix (GLCM), which is a simple and effective method for representing texture, is widely used.
The co-occurrence matrix is statistical way to describe texture by taking random samples of the certain grey-levels that are occurring in relation to other grey-levels. It is calculated for each segment. For a position operator p, we can define a matrix P ( m , n ) that counts the number of times a pixel with grey-level m occurs at position p from a pixel with grey-level n . For e.g. consider image I of dimensions i x j with x=1,2,…i & y=1,2,…j. Then suppose position p stands for one element to the right, if i = I ( x , y ) and j = I ( x + 1, y ) , then the co-occurrence matrix, P ( m , n ) = P ( m , n ) + 1. Energy, Entropy, Contrast and Homogeneity are the major components that generally are used to characterize the Texture. These values are readily obtained from the co-occurrence matrix by the following equations.
Energy = ZZ P 2 ( m , n ) (20) mn
Entropy=W P ( m , n ) log P ( m , n )
mn
Contrast= ZE ( m — n ) P ( m , n )
mn
Homogenity= VV P ( m , n )
m n 1 + 1 m - n |
Here four positions are being used for calculation of the above values. These are one step right, one step left, one step up, and one step down. So for each images, 4x4 = 16 values per segment which contribute to the texture feature may be obtained
-
F. Composite feature vector
Finally a single Composite feature vector is formed by combining edge histogram and segment wise color and texture features. This feature vector may be used to find out the correlation and similarity between the query image and database images.
-
IV. .Genetic algorithm
Continuous efforts have been observed to be taken by the worldwide researchers in order to achieve an evolutionary model in the CBIR system. As the Genetic Algorithm is found to be one of the good optimizer, it may be deployed at the level of the feature elements selection. By this approach one can preserve important and most significant features of the image. The feature elements from the composite feature vector may be very sensitive to additive noise due to intra class variations. This deteriorates drastically the recognition accuracy. So it is important to remove or suppress the effect of the feature elements which are sensitive to the noise and echo to optimize the recognition performance in high intra-class variation environment. Genetic algorithm may handle this optimization problem efficiently. The flow-chart of the Genetic Algorithm is shown in Fig.8.
The major objective behind the application of genetic algorithm in this work is to find important feature elements that contribute more to classifier for distinguishing one word from others. This enhances the recognition accuracy of an image classifier. At the same time, the number of feature elements is also reduced. This reflects in to the reduced length or size of the feature vector. It is possible by designing a dummy Feature vector of the same size and selects the values of the feature vector optimally. The major factor that decides the status of the feature vector bit whether it is suitable or not depends on the noise incurred in it. Generally the White Gaussian noise will be observed that have the adverse effect on the Feature vector and its usage. Therefore if we consider the values of the Dummy feature vector that lies within the range to that of the mixture of the Gaussian Noise values and the actual feature value and compare them with the required fitness function for similarity, than we will get the values of the Dummy feature vector which will be considered as optimum feature values. The length of chromosome of GA is to be decided based on the length of feature vector. This chromosome has real value between 0 and 1, randomly generated at each position, in its first form. The position values will further be modified by comparing with some randomly generated value between 0 and 1. If the position value is less than this instantaneous random value then the position in chromosomes will be made to zero. The value of the noise threshold will also be selected randomly for every iteration. The Mutation and Cross-Over operations are also to be performed before comparing with the Fitness function for the final decision about the suitability of the Feature vector. The Mutation rate is set here as 0.001and the cross over rate is set to be 0.7. This modification transforms the wide range variations in usable percentage variation of total feature elements, which enables to evaluate the chromosome’s performance of recognition with having even small percentage of elements. This chromosome may be then multiplied (element wise) with feature vector to be optimized, before using it for recognition
-
V. Experimental Results and Discussion
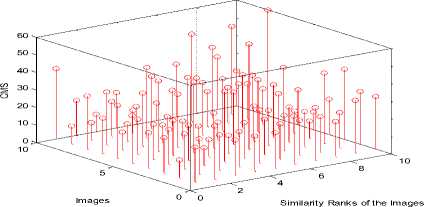
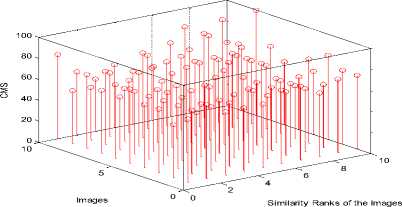
The Berkeley database with Low depth Images is used for implementation of this algorithm. The Cumulative Match Score (CMS) is the parameter which is used here to evaluate the performance of the CBIR system for a given Query image. A typical performance is depicted in Fig. 9 for a given Query image. The ratio of the number of relevant images retrieved to the total number of relevant images in the database is considered as recall values for each of the classes.
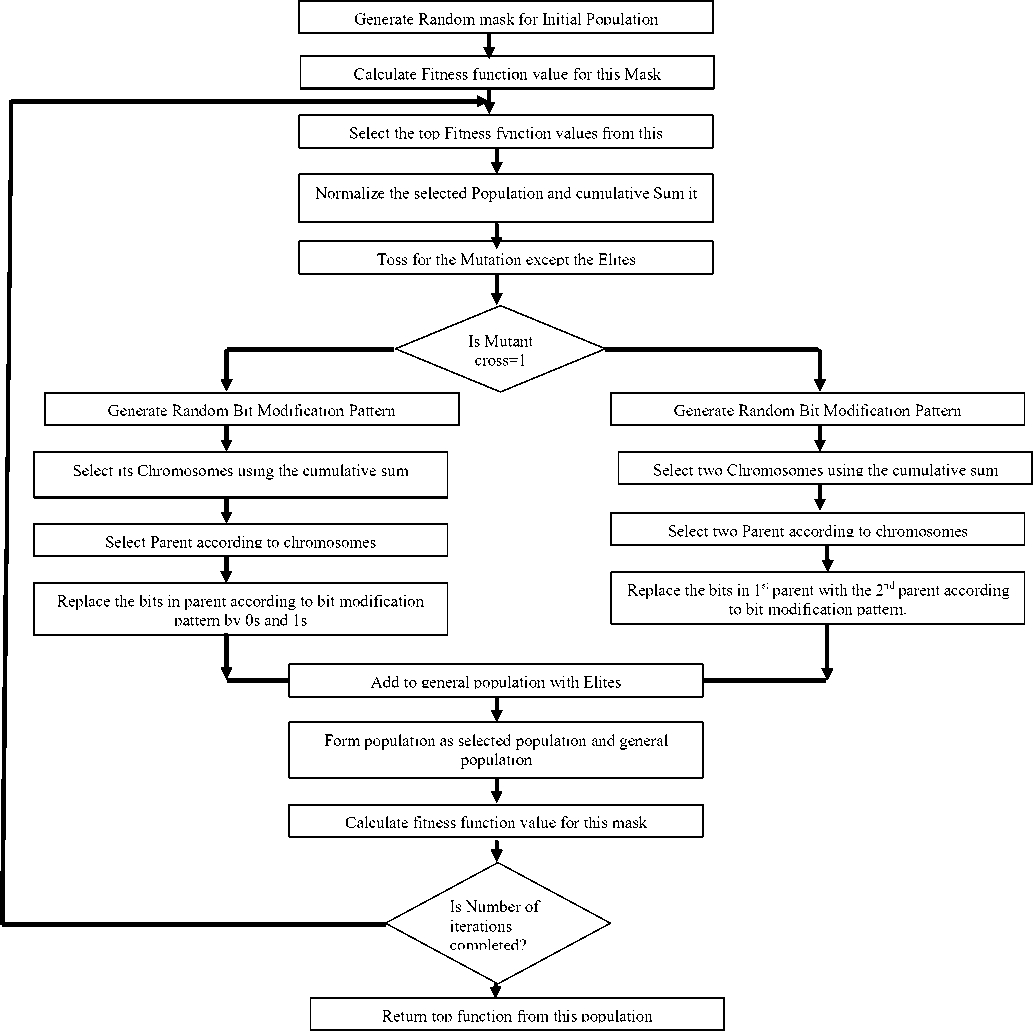
Fig 8. The Genetic Algorithm
These results depicts that the recognition performance obtained with genetic algorithm is improved.
The best optimized solutions for feature selection problem is displayed in Fig. 10.It is due to reduction in the computational complexity in classifier as number of feature elements used for similarity calculation is decreased. It is also being observed that in spite of decrease in number of feature component the image retrieval performance. of the system is still maintained or improved.

a)
b)
c)
Fig 9. a) A sample image b) Graphs of Query image v/s CMS without GA and c) with GA.
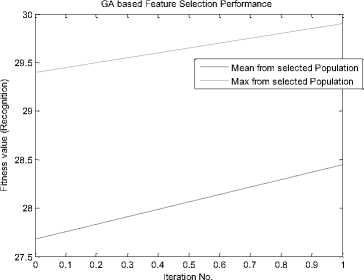
Fig 10. GA Optimization performance
-
VI. Conclusions
In order to modify the present CBIR systems in the line of the human vision and retrieval system, it is necessary to replace the conventional way of text based retrieval systems by the visual content based systems. The content-based classification of images may be achieved with the help of several dominant characteristics of image like color, texture and shape. The size and length of the data can be reduced by using. GA based approach that improves the performance of the CBIR system. This may be found suitable for the real-time applications system and good example of Evolutionary Algorithm.
References Optimum Features selection by fusion using Genetic Algorithm in CBIR
- N. Houhou, J. Thiran, and X. Bresson, "Fast texture segmentation model based on the shape operator and active contour," in Proc. IEEE Conf. Comput. Vis. Pattern Recognit., Jun. 2008, pp. 1–8.
- P. Puranik, P. Bajaj, A. Abraham, P. Palsodkar, and A. Deshmukh, "Human perception-based color image segmentation using comprehensive learning particle swarm optimization," in Proc. 2nd Int. Conf. Emerging Trends Eng. Technol., 2009, pp. 630–635.
- S. Belongie, C. Carson, H. Greenspan, and J. Malik, "Color-and texturebased image segmentation using EM and its application to content-based image retrieval," in Proc. 6th Int. Conf. Comput. Vis., 1998, pp. 675–682.
- H. Cheng, X. Jiang, Y. Sun, and J. Wang, "Color image segmentation: Advances and prospects," Pattern Recognit., vol. 34, no. 12, pp. 2259–2281, 2001.
- J. Shi and J. Malik, "Normalized cuts and image segmentation," IEEE Trans. Pattern Anal. Mach. Intell., vol. 22, no. 8, pp. 888–905, Aug. 2000.
- Jiangyuan Mei, Yulin Si, and Huijun Gao, "A Curve Evolution Approach for Unsupervised Segmentation of Images With Low Depth of Field", IEEE TRANSACTIONS ON IMAGE PROCESSING, VOL. 22, NO. 10, OCTOBER 2013.
- M. Swain and D. Ballard, "Color indexing," International Journal of Computer Vision, vol. 7, pp. 11-32, 1991.
- J.-L. Shih and L.-H. Chen, "Color image retrieval based on primitives of color moments", Vision, Image and Signal Processing, IEE Proceedings, vol. 149, no. 6, 2002, pp. 370-376.
- M. Rautiainen and D. Doermann, "Temporal Color Correlograms for Video Retrieval", Pattern Recognition, Proceedings of 16th International Conference, vol. 1, Aug. 2002, pp. 267-270.
- P. S. Hiremath, Jagadeesh Pujari, "Content Based Image Retrieval using Color, Texture and Shape features", 15th International Conference on Advanced Computing and Communications, IEEE Computer Society 2007, pp. 780-784.
- Alberto Amato, Vincenzo Di Lecce, "Edge Detection Techniques in Image Retrieval: The Semantic Meaning of Edge", 4th EURASIP Conference on Video/Image Processing and Multimedia Communications, Zagreb, Croatia. pp. 143-148.
- Minyoung Eom, and Yoonsik Choe, "Fast Extraction of Edge Histogram in DCT Domain based on MPEG7", proceedings of World Academy of Science, Engineering and Technology Volume 9 November 2005 ISSN 1307-6884, pp. 209-212.
- H. J. Zhang and D. Shong, "A scheme for visual feature-based image indexing," in Proceedings of SPIE Conference on Storage and Retrieval for Image and Video Databases III, vol. 2185 (San Jose, CA), pp. 36-46, February 1995.
- Woo Chaw Seng, Seyed Hadi Mirisaee, "A Content-Based Retrieval System for Blood Cells Images," International Conference on Future Computer and Communication, 2009.
- Rouhollah Rahmani, Sally A. Goldman, Hui Zhang, Sharath R. Cholleti, and Jason E. Fritts, "Localized Content-Based Image Retrieval", Ieee Transactions On Pattern Analysis And Machine Intelligence, Vol. 30, No. 11, November 2008.
- A. Marakakis, N. Galatsanos, A. Likas and A. Stafylopatis," Probabilistic relevance feedback approach for content-based image retrieval based on gaussian mixture models," IET Image Process., 2009, Vol. 3, Iss. 1, pp. 10–25.
- Wei Bian and Dacheng Tao, "Biased Discriminant Euclidean Embedding for Content-Based Image Retrieval," IEEE Transactions On Image Processing, Vol. 19, No. 2, February 2010.
- Ilea, D.E.; Whelan, P.F., "CTex—An Adaptive Unsupervised Segmentation Algorithm Based on Color-Texture Coherence," Image Processing, IEEE Transactions on, vol.17, no.10, pp.1926, 1939, Oct. 2008.
- H. Li and K. Ngan, "Unsupervized video segmentation with low depth of field," IEEE Trans. Circuits Syst. Video Technol., vol. 17, no. 12, pp. 1742–1751, Dec. 2007.
- Gabor, D., Theory of communication." In J. IEE, vol. 93, pp. 429-457, London, 1946.
- Lin Yang, Peter Meer, David J. Foran, "Unsupervised Segmentation Based on Robust Estimation and Color Active Contour Models" IEEE Transactions On Image Processing, Vol. 19, No. 2, February 2010.
