Overcoming social disintegration as a factor in promoting social health

Author: Morev Mikhail Vladimirovich, Popova Vera Ivanovna
Journal: Economic and Social Changes: Facts, Trends, Forecast @volnc-esc-en
Section: Social development
Article in issue: 4 (28) т.6, 2013.
Free access
The article dwells on the key indicators, reflecting the state of social health. The data is presented geographically among different demographic groups. The results of the public opinion monitoring, held by ISEDT RAS, with regard to public mental health in the Vologda Oblast are revealed. The article considers the process of social disintegration as a factor, negatively affecting the state of social health. The effect of a victim behaviour on the prevalence rate of social pathologies is analysed.
Social health, social disintegration, victimization, mortality, human capital
Short address: https://sciup.org/147223495
IDR: 147223495 | UDC: 314.42(470)
Text of the scientific article Overcoming social disintegration as a factor in promoting social health
At the end of the 20th century Russia entered into a phase of system transformations, continuing up to the present time. Social, economic, cultural and political processes of the last two decades have changed the fundamental living standards of the Russians, their mutual economic relations, political priorities, the social structure of a society [23, p. 6].
In this context, the interest arose in the key problems of classical Russian sociological theory, such as social integration and disintegration, the doctrine of which was developed by A. Comte, H. Spencer, E. Durkheim, P. Sorokin, T. Parsons and others, who saw different meaning in and placed different accents at these issues (tab. 1) .
Table 1. Theoretical approaches to the understanding of social disintegration
|
Author |
Thesis |
|
Herbert Spencer (1820–1903) |
Herbert Spencer reduced the concept of evolution to a continuous redistribution of corporeal particles and their motion, fusion (integration), and dispersion (disintegration). He attempted to subsume all phenomena – from the inorganic to the moral and social ones – under this mechanistic conception of evolution. Disintegration – reverse movement, from the highest to the lowest type of development, from complex to simple. Integration – process or the action, resulting in integrity; unification, junction, reestablishment of the unity. |
|
Auguste Comte (1798–1857) |
General mechanism of social integration (order) and society structure result from anthropological concept of man as predominantly a selfish creature, inclined to aggression, guided by feelings rather than reason. This fact necessitates the existence of specialized institutions, regulating the behaviour of individuals from ‘the inside’, through the world of feelings and emotions (e.g. religion). |
|
Emile Durkheim (1858–1917) |
Disintegration and collapse of norms, guaranteeing social order, are defined as anomie, i.e. an absence of clear societal norms and moral instability of society caused by a change in the hierarchy of values. The concept of anomie defines the state of society, which is characterized by disintegration and collapse of norms, guaranteeing social order. Anomie causes such psychological state of an individual, which is characterized by the sense of disorientation in life that occurs when the hierarchy is broken, and the new one could not yet be immediately established. E. Durkheim noted that anomic states occur most often in society under conditions of economic crises and dynamic reforms. Later anomie was also understood as the state in society caused by the excess of norms, including contradictory ones (Robert Merton). Under these conditions, the person is lost, not knowing what standards to follow. The unity of the normative system, the system regulating social relations are destroyed. People are socially disoriented, feel anxious, socially isolated. |
|
Pitirim Sorokin (1889–1968) |
Two contrary processes – integration and disintegration –interact dialectically and dynamically, as society is in the process of constant development. “The study of any integrated sociocultural system shows that all of its basic elements are to a different degree of intensity interdependent… It is impossible to find such interdependency in non-integrated and disintegrated sociocultural clusters.” |
|
Talcott Parsons (1902–1979) |
The mechanisms of social disorganization:
The system of societal unity, which includes all institutions of social control performs the function of social system integration. Thus, both the cause and the consequence of disorganization is the crisis of the system of social control, as well as the crisis of value-normative system – deligitimisation of the elements of social and cultural institutions, low level of self-regulation and consent. |
The fact that the state of general population can be described as social apathy indicates the disintegration processes taking place in Russian society.
The issue of social apathy is closely connected with the anomie issue, introduced to the conceptual framework of Social sciences by E. Durgeim in his work On the division of social labour and developed further in his work Suicide. Social categories “apathy” and “anomie” are essentially and conceptually connected, as both social phenomena result from the fact of social economic development advancement (according to Durkheim, consisting in progressive division of labour) relative to moral development of collective consciousness.
At first glance, in post-Soviet Russia the situation was controversial and paradoxical: a high proportion of the displeased was combined with a relatively low share of those, who were ready to protest and still less of those, really taking part in protests. For example, repeated devaluation of the ruble in August 1998, did not result in mass demonstrations the government’s economic policy, whereas similar events in Indonesia (1998) and Argentina (2001–2002) gave rise to mass street riots.
The series of terrorist acts in August 2004 (two aircraft bombings and the explosion in Moscow near Rizhskaya underground station) did not have any implications in that sense, while terrorist attacks, comparable in number of victims, in Madrid a few months later caused million protests and the Cabinet shuffle as a result of parliamentary elections.
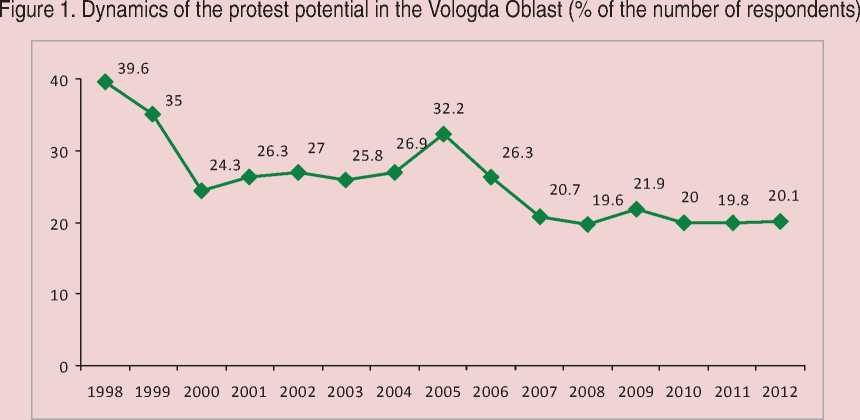
The results of Russian studies show that the share of those, who are ready to openly protest on average makes up 20–25% of the population in the country as a whole [8]. According to the monitoring of public opinion, held by ISEDT RAS1, the share of people in the Vologda Oblast, willing to support protests amounts to 20–22% since 2007 (fig. 1) .
The reasons for protest moods both on regional and federal levels are of socioeconomic nature (tab. 2). According to the Doctor of Sociology, Director of the projects “FOM-Terry” L.P. Pautova, “direct political reasons occupy 4th–5th places. People note social and economic problems most frequently. Above all, the growth of prices, growth of public utilities fees, unemployment, and considerably insecurity in tomorrow” [16].
At the same time unconditional predominance of patience over active protest, adaptation over rebellion, passive discontent over the struggle for civil rights is a distinctive characteristic of the mass reaction on endless series of trials, miseries, hardships, experienced by an individual in the Russian society throughout practically all pre-Soviet, Soviet and current post-Soviet history [9].
In recent years the number of Russians, not participating in any form of public or political activities, ranges from 32 to 52% [14]. According to the ISEDT RAS monitoring, in 2013 the percentage of the Vologda Oblast residents, not participating in public and political activities, made up 29% (as compared to 20% in 2011), almost half of the region’s population describes its involvement in social and political life as “passive”. The share of those, who believe they can somehow influence the situation in the country or, at least, in the region is minimal (3–7%).
Table 2. The most acute problems for Russia in general, in the opinion of the Vologda Oblast population, (% of the number of respondents)*
|
Answers |
2008 |
2009 |
2010 |
2011 |
2012 |
|
Low living standards, poverty |
41.4 |
44.5 |
48.4 |
49.4 |
43.2 |
|
Stratification of the population into ‘rich’ and ’poor’ |
31.4 |
28.4 |
34.5 |
36.2 |
37.5 |
|
Problems regarding housing provision, low housing affordability |
36.3 |
25.7 |
24.9 |
24.8 |
28.6 |
|
Growth of alcohol consumption |
26.5 |
26.5 |
31.7 |
27.1 |
27.3 |
|
High crime rate, lack of protection from criminals, hooliganism, etc. |
28.4 |
24.9 |
28.3 |
29.3 |
25.5 |
|
Poor quality of engineering infrastructure (utilities, roads, transport etc) |
– |
– |
16.3 |
19.0 |
25.3 |
|
Social insecurity of citizens |
24.8 |
22.9 |
22.5 |
23.1 |
22.3 |
|
Corruption, bribery |
17.5 |
16.7 |
18.7 |
21.8 |
19.8 |
|
Inaccessibility of health services, poor quality of medical services |
15.8 |
13.8 |
16.0 |
13.8 |
18.5 |
|
* The questionnaire list comprised 20 most acute problems of modern life. The given issue includes only the first ten (in descending order according to the results of the latest survey). |
|||||
Annually the most common reasons for people being passive in social life and not taking a stand on the question of civil rights are disbelief in the possibility to affect the authorities, indifference to joint activities, and the habit of relying on ‘having got it made’ (27, 24 and 22% respectively).
Thus, social apathy can be named one of the characteristics of modern Russian society, which is important for understanding its functioning, social and spiritual development. However, proper attention has not been previously paid to the research of social apathy [22]. Moreover, apathy is the main manifestation of anomie, which in turn, is characterized (according to E. Durkheim’s approach) as a state of society undergoing disintegration.
On a personal level social disintegration is revealed through such psychological characteristics as self-doubt, anxiety, suggestibility, emotional instability, pessimism. As follows from the results of the research in the Vologda Oblast, such features are displayed by 13–40% of the population (tab. 3) .
During extended periods of social disintegration and in the absence of timely intervention, negative personality traits can transform into behaviouristic characteristics, i.e. they become displayed at the “external”, visible level. Such behaviour is accompanied by various manifestations of social deadaptation, up to the extreme – complete isolation of an individual. It is characterized by frequent mood swings, passiveness in difficult situations, tendency to social isolation. The individuals with similar characteristics, i.e. those, frequently finding themselves in conflict situations, addicted to alcohol and violating accepted norms, or those, characterized by a high degree of conformity, i.e. trying to avoid decision-making situations and not to stand out from their common social group.
The results of the research showed that such traits are displayed by 7–25% of the Vologda Oblast population (tab. 4) .
The deterioration of social health is one of the negative consequences of social disintegration. Social health is a characteristic of a healthy society with the minimal level of social diseases [17, p. 143].
According to N.M. Rimashevskaya, an increasing number of the cases of antisocial behaviour, such as alcoholism, drug addiction, criminalization of the social environment, and a sharp increase in the number of suicides, are the criteria that indicate the urgency of the issue of social ill-health of the Russian society [19]. Social pathologies most objectively reflect the state of social health in a particular area.
Table 3. The share of the Vologda Oblast residents with psychological characteristics, indicating social disintegration (% of the number of respondents)
|
Answer |
2011 |
|
I experience fatigue, apathy* |
41.3 |
|
I feel lonely |
38.6 |
|
I drink alcohol to get rid of nervous tension * |
37.4 |
|
I experience inner stress |
34.1 |
|
I lack self-confidence |
30.8 |
|
Share of people displaying symptoms of anxiety ** |
27.1 |
|
I experience tension, annoyance, fear, anguish |
24.3 |
|
I consider myself a pessimist |
17.2 |
|
I have frequent mood swings |
12.8 |
|
* 2009 data. ** Hospital anxiety and depression scale was used to estimate the number of people displaying symptoms of anxiety. Source: The monitoring data on public mental health in the Vologda Oblast. |
|
Table 4. Share of the Vologda Oblast residents displaying behaviouristic characteristics, indicating social disintegration (% of the number of respondents)
|
Answer |
2011 |
|
I often regret my actions |
24.4 |
|
I am not willing to make social contacts, to enlarge the circle of my acquaintances* |
24.3 |
|
My working relationship can be described as conflict* |
21.9 |
|
I find it difficult to get acquainted with new people |
21.1 |
|
I find it hard to maintain a conversation upon acquaintance |
18.3 |
|
Consume alcohol 1 – 2 a week or more often* |
19.1 |
|
My family relationship is tense and conflict* |
19.1 |
|
I often get in conflict situations |
16.8 |
|
I’m not satisfied with the relationship with my husband |
9.7 |
|
I’m not satisfied with the relationship with my friends, intimate friends |
6.4 |
|
* 2009 data Source: The monitoring data on public mental health in the Vologda Oblast |
|
According to the World Health Organization, Russia is among the top five countries by the number of murders and suicides. At the same time, it should be noted that these causes of mortality are only ‘the tip of the iceberg’. According to the formula, elaborated by WHO experts, the ‘n’ of completed suicides accounted for 10–20n of parasuicides, 8n of the close ones and relatives of the suicider (included in high-risk suicidality group), 100n of people, thinking about suicide or engaged in self-destructive actions subconsciously. Therefore, the problem of suicidal behaviour may comprise in general up to 4.2 million people, i.e. 2.9% of the population.
The range of the crime issues, covers not only lawbreakers, but crime victims, as well as convicts. All of them, one way or another, are ‘excluded’ from full social life. The number of inmates in Russia for the 1990–2010 increased by 57% (from 537.6 thousand to 845.1 thousand people), their age structure, at the same time, practically has not changed: over half of them (52%) belong to the 14–30 age group.
Thus, one of the most acute problems for modern Russian society is high mortality of the population, above all from external causes, including homicides, suicides, poisonings, injuries, car accidents, etc. wide spread of which caused great losses that has become the peculiarity of our statistics, assumed continuous and sustainable character in most regions of the country [1, p. 65].
Homicides and suicides are critical and, therefore, the most striking manifestations of social ill health. At that, homicides to a greater degree reflect external evidences (the standard and quality of living, social structure of the population), while suicides – internal ones (relations in microsociety, the state of psychological climate). In addition, homicides and suicides, as forms of deviant behaviour, are forms of protest and aggression against people around (in the first case) and against themselves (in the second case). So, the expansion dynamics of these social pathologies reflects indirectly, on the one hand, the attitude of people to each other, and on the other hand, the psychological perception of the individual’s own place in society.
According to different studies, the symptoms of depressive disorder were noted in almost all cases of completed suicides or suicide attempts.
This influenced the fact that depression is called ‘driving mechanism of suicide’. About a third of the Vologda Oblast population (31–32%) showed signs of depression. Moreover, the indicator has remained stable in the 2002–2011 period (fig. 2) . The results of the conducted study revealed that people with socio disintegrated personality traits or behaviour are likely to show signs of depression about twice the rate of the rest of the population.
Thus, it is important to examine the processes and manifestations of social disintegration in terms of the monitoring of suicidal tendencies and prevention of suicides among the population. Similarly, social disintegration affects the formation of victimization behaviour, i.e. acts as the crime factor as a social phenomenon.
Victimization researches as an information source provide more accurate and complete information about the crime rate rather than the official statistics. The advantage of such analysis is that it allows taking into account
Figure 2. Expansion dynamics of anxiety, depression and neurosis symptoms (% of the number of respondents)
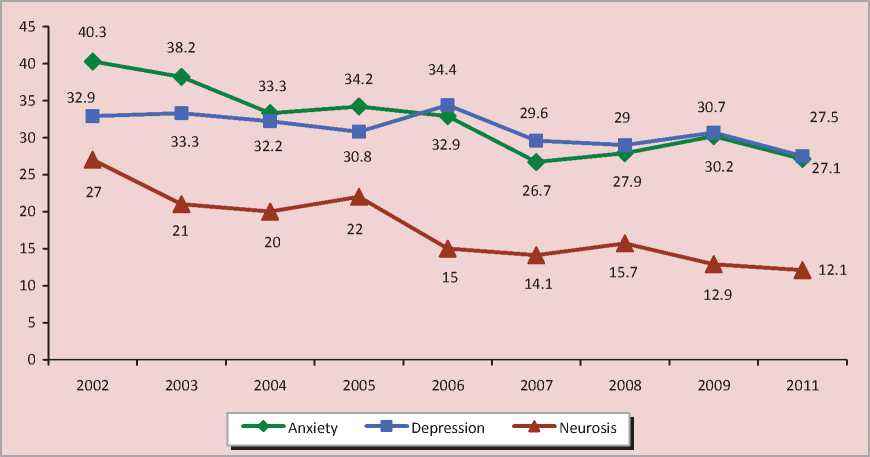
Source: ISEDT RAS monitoring data on the public mental health.
latent crime processes, and is also of preventive character (the results of the victimization research consist in revealing social and economic, demographic, etc. characteristics of individuals comprising the group at risk of becoming crime victims).
The elaboration of a regional monitoring with regard to victimization situation is a long-run objective for preventing crime situations in the early stages of development, as for now we can make judgements about the victimogenity level of society on the basis of the official statistics and the results of sociological researches.
Victim qualities of citizens depend on their age, gender, experience, readiness for action in dangerous situations, personal characteristics. For example, the victimization of children is determined by their lack of experience and knowledge of life, increased suggestibility, while for old people and the disabled it is the limited abilities to quickly orient in space and to move.
A certain degree of victimization is inherent in the conditions of socialization, existing in society, including unfavourable socialization factors contributing to the formation of socio-psychological predisposition of an individual to victim behaviour. For example, when it comes to family relations, increased victimity may be observed in any of the family members, who is characterized as immoral, antisocial, inclined to abuse and harassment of other family members, to the creation of stressful environment.
The number of cases, when an individual exhibits different forms of victimization behavior, increases in the periods of social innovations and changes, accompanied by chaotic economic development of social relations, accelerated social differentiation, social mobility, reduced threshold of individual and public safety. The major factors in the population victimization are psychological stress and decreasing adaptation of people due to rapidly changing living conditions [3].
The level of social victimization in modern Russia is significantly higher than in European countries [7, p. 38]. The number of victims has been annually increasing across the Russian Federation during the last decade. The share of violent crimes (with the use of violence) against the victims, has remained stable since 2004 and accounts for 17–18% of the total number of committed criminal offences. According to 2011 data the most tense situation is observed in the Ural, Siberian and Volga Federal Districts (tab. 5) .
Table 5. Number of violent crimes against the victims
Territory 2004 2005 2006 2007 2008 2009 2010 2011 thousand % thousand % thousand % thousand % thousand % thousand % thousand % thousand % Russian Federation 518.6 17.9 658.8 18.5 684.3 17.7 618.3 17.3 570.6 17.8 531.0 17.7 451.2 17.2 403.5 16.8 Federal Districts Ural 65.1 19.8 80.7 19.5 77.8 17.8 71.2 18.3 72.3 21.7 66.8 21.4 58.3 20.4 50.4 20.0 Siberian 92.7 19.8 118.6 20.8 119.9 19.5 113.0 19.0 110.1 19.9 101.9 19.7 87.7 19.2 79.4 19.0 Volga 120.1 20.0 156.9 19.3 174.5 19.3 155.4 19.6 135.7 19.5 122.6 19.2 103.6 18.7 93.1 19.0 Northwestern 55.0 20.1 68.2 20.9 68.7 19.8 60.6 18.7 53.2 18.8 49.7 18.6 40.2 17.2 36.1 16.5 Far Eastern 27.3 17.5 35.8 18.7 45.4 19.0 39.3 17.9 33.9 17.5 29.5 17.6 24.3 17.0 20.4 15.8 Central 108.4 16.4 141.5 18.1 138.5 17.1 123.5 16.2 114.5 16.5 110.8 16.6 95.8 15.9 86.3 15.3 Southern 44.9 15.5 50.1 15.2 52.2 14.1 49.0 13.4 46.2 13.8 45.6 14.7 28.5 13.9 26.1 13.5 * Ranked by indicator value in 2011 ( %). Source: Database of the Federal State Statistics Service. Available at:
The given indicator is higher than the Russian average in 39 regions. Its maximum values are observed in the Republic of Karelia (37.9%), the Tyva Republic (29.8%), the Kurgan Oblast (27.5%), the Chuvash Republic (27.4%).
1.6 million people fell victim to crimes (1158 per 100 thousand of population) throughout Russia in 2011. The given indicator in 4 out of 8 Federal Districts is higher than the national average (fig. 3) due to high crime rates (1643 per 100 thousand of population in the Volga Federal District, 2077 people in the Ural Federal District, 2176 in the Siberian Federal District, 2061 in the Far Eastern Federal District, 1682 – the Russian average).
The number of victims makes up 1619.1 per 100 thousand people in the Vologda Oblast (fig. 4), i.e. higher than the average of Russia and the Northwestern Federal District. For the whole 2011, 19.4 thousand of the Oblast residents fell victim to crimes, which accounts for 12.3% out of the total number of victims on the territory of the Northwestern Federal District. By this indicator, the Vologda Oblast comes third after Saint Petersburg (24%) and the Arkhangelsk Oblast (12.5%).
According to the survey conducted on the territory of the Vologda Oblast, the share of its residents who fell victim to crimes and acts of hooliganism in the 2002–2012 period decreased (fig. 5) . Men and women fall victim to crimes with equal frequency (7 and 5% respectively), while people under 30 years of age (10%) and urban residents (7%) are the most victimized groups.
According to official statistics data, property crimes (thefts, robberies, frauds) are much more frequent than such offences as homicide or deliberate infliction of grave harm to health. Nevertheless, it is these types of crimes that account for the largest number of victims.
Figure 3. Number of crime victims in Federal Districts (per 100 thousand of population, 2011)
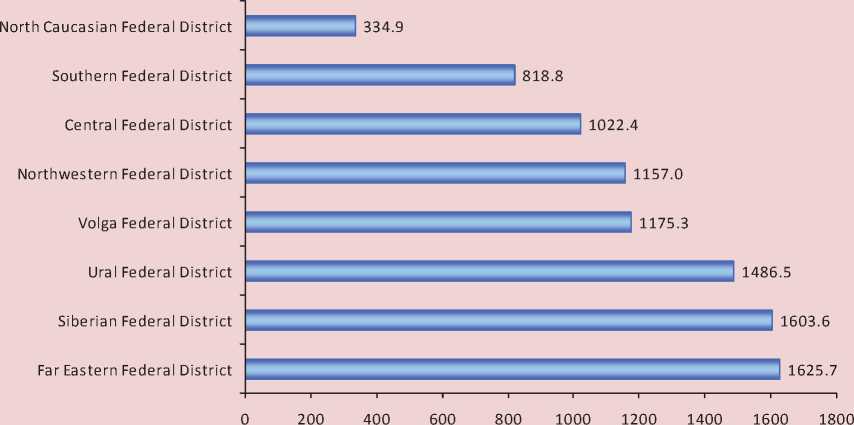
Source: Social status and living standards of Russian population in 2012: statistical digest, Rosstat.
Figure 4. Number of crime victims in federal districts (per 100 thousand of population, 2011)
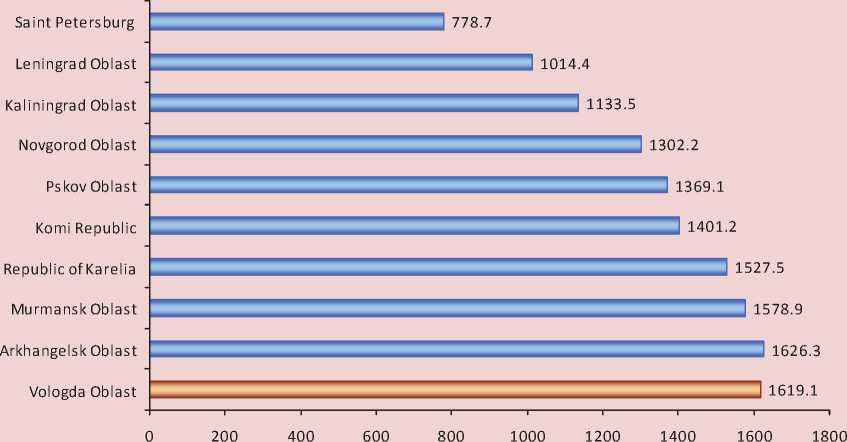
Source: Social status and living standards of Russian population in 2012: statistical digest, Rosstat.
Figure 5. The number of victims and witnesses to crimes and acts of hooliganism in the Vologda Oblast (% of the number of respondents)
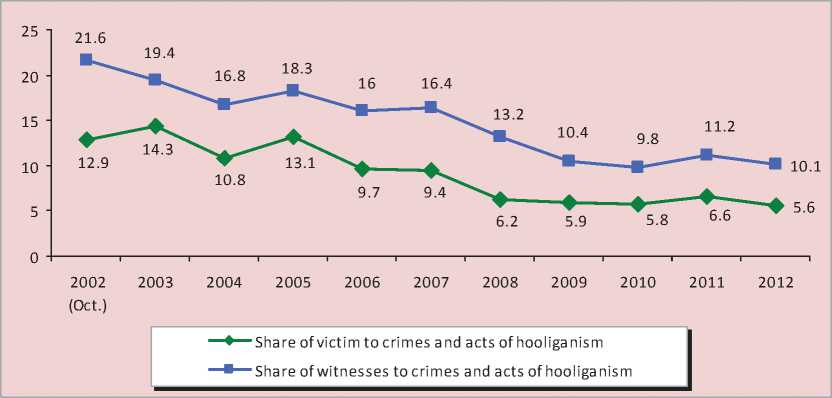
Source: ISEDT RAS public opinion monitoring data on the changing living conditions of the Vologda Oblast population.
The share of homicides in the structure of crimes decreased almost twice in the 2003– 2011 period (1.1–0.6%), however the victimity rate with regard to this type of offences increased from 9358.2 to 9580.4 per 10
thousand of the population (tab. 6) . Thus, the number of victims increases in each specific case of murder or attempted homicide, i.e. the criminal subculture has been strengthening.
Table 6. The coefficient of specific (selective) victimity by types of crime in the Russian Federation (number of crimes with victims per 10 thousand crimes of the type)*
|
Types of crime |
2003 |
2004 |
2005 |
2006 |
2007 |
2008 |
2009 |
2010 |
2011 |
|
Total |
6702.6 |
6854.3 |
7136.1 |
7056.6 |
6877.0 |
6704.3 |
6786.7 |
6927.1 |
6981.9 |
|
Deliberate infliction of grave harm to health |
9739.5 |
9746.8 |
9729.9 |
9761.0 |
9778.7 |
9816.0 |
9858.0 |
9899.2 |
9896.1 |
|
Homicide and attempted murder |
9358.2 |
9412.7 |
9465.5 |
9467.6 |
9493.0 |
9523.3 |
9558.3 |
9551.3 |
9580.4 |
|
Heist |
9372.0 |
9541.3 |
9630.1 |
9652.9 |
9587.5 |
9518.1 |
9484.9 |
9477.2 |
9397.5 |
|
Robbery |
9163.2 |
9306.0 |
9407.7 |
9487.5 |
9466.4 |
9387.5 |
9340.2 |
9346.9 |
9353.2 |
|
Hooliganism |
8960.8 |
8432.1 |
8458.4 |
9429.2 |
9341.8 |
9139.7 |
9098.6 |
n/d |
8750.0 |
|
Misappropriation of a car or other vehicle without the intent to steal (car theft) |
8345.5 |
8074.4 |
8309.5 |
8930.2 |
8976.1 |
8884.4 |
8945.5 |
n/d |
n/d |
|
Theft |
7600.1 |
7861.3 |
8104.3 |
8186.1 |
8088.9 |
8018.3 |
8321.7 |
8287.6 |
8207.2 |
|
Fraud |
6367.8 |
6648.3 |
6928.3 |
6572.7 |
6181.5 |
5896.4 |
6189.0 |
6252.3 |
6406.8 |
|
* Ranked by indicator value in 2011 Source: calculated on the basis of the statistical digest “Russia’s regions: social and economic indicators”. Rosstat. Мoscow, 2012. |
|||||||||
The most victimised population groups include the citizens, who are more likely to fall victim to crimes, due to age and gender characteristics (e.g., minors, women, the elderly), profession (law enforcement officials, cash collectors, etc.) or because of their own behaviour and lifestyle (abusers, antisocial individuals).
Children and the youth, having no life experience because of their young age, are more suggestible and curious at the same time, they are inclined to display new behaviour patterns. Furthermore, children and adolescents are dependent on the parents with regard to the social status and are not able to make independent decisions.
A trend of decreasing homicide and suicide mortality rate was observed in the 2001–2011 period in all age groups of the Vologda Oblast population (tab. 7) . It should be noted that in all categories the suicide rate considerably exceeds homicide mortality rate (this is particularly evident among people aged from 10 to 19 and over the age of 60).
The increased suicide rate among the youth is noted in other Russian studies. For example, according to A.Yu. Myagkov2 and
S.V. Yerofeev3, who analyzed the situation in the Ivanovo Oblast, “the youth cohort aged 14–29 years is the most vulnerable group with regard to suicides. Stable negative dynamics is observed here along with extremely high level of suicides. At present, suicidality index among the youth exceeds citywide rate more than twice. Moreover, over the past six years it has increased by 19%” [13, p. 47].
Children and adolescents are at greater risk of committing suicide, due to the fact that they, having the higher level of mental instability, at the same time have no life experience that would be sufficient for a constructive response to stressful situations. The increased risk of late-life suicide is associated with the deterioration of physical health and concurrent retirement, that is, an individual loses the sense of belonging to a social group (work collective) and has to change the usual lifestyle (occupation). In addition, the majority of the wealthy falls for the elderly people, who are, therefore, at greater risk of becoming crime victims.
Table 7. Age structure of homicide and suicide mortality rate of the Vologda Oblast population (per 100 thousand of population)
|
Age group |
Year |
2011 in % to 2001 |
2011 in % to 2010 |
||||||||||
|
2001 |
2002 |
2003 |
2004 |
2005 |
2006 |
2007 |
2008 |
2009 |
2010 |
2011 |
|||
|
Suicides |
|||||||||||||
|
Aged 0 – 9 |
0.0 |
0.9 |
0.0 |
0.0 |
0.0 |
0.0 |
0.0 |
0.0 |
0.0 |
0.0 |
0.0 |
0.0 |
0.0 |
|
Aged 10– 19 |
12.0 |
15.2 |
12.1 |
9.1 |
11.9 |
9.1 |
11.9 |
7.2 |
7.0 |
9.7 |
12.1 |
101.1 |
125.1 |
|
Aged 20 – 39 |
56.4 |
57.0 |
61.7 |
55.6 |
40.9 |
42.9 |
37.5 |
25.3 |
33.7 |
27.8 |
23.7 |
42.1 |
85.4 |
|
Aged 40 – 59 |
80.6 |
74.7 |
75.9 |
64.3 |
58.2 |
56.0 |
46.7 |
37.8 |
38.7 |
33.8 |
31.1 |
38.5 |
91.9 |
|
Aged 60 and over |
68.6 |
63.4 |
59.5 |
60.2 |
46.7 |
58.0 |
47.3 |
36.7 |
36.9 |
31.9 |
59.1 |
86.2 |
185.3 |
|
Homicides |
|||||||||||||
|
Aged 0 – 9 |
0.0 |
0.0 |
0.0 |
0.9 |
0.9 |
0.9 |
0.8 |
4.0 |
0.8 |
3.8 |
3.8 |
0.0 |
98.9 |
|
Aged 10– 19 |
5.1 |
1.0 |
9.1 |
3.2 |
3.4 |
4.9 |
5.9 |
5.7 |
5.4 |
0.0 |
2.6 |
51.0 |
0.0 |
|
Aged 20 – 39 |
33.4 |
24.5 |
28.7 |
31.5 |
27.0 |
25.6 |
22.2 |
17.5 |
17.0 |
16.1 |
15.9 |
47.6 |
98.8 |
|
Aged 40 – 59 |
49.0 |
47.6 |
43.3 |
29.4 |
39.4 |
25.1 |
26.2 |
22.3 |
22.0 |
20.6 |
16.8 |
34.3 |
81.5 |
|
Aged 60 and over |
23.3 |
22.9 |
15.4 |
16.1 |
15.4 |
9.8 |
6.1 |
8.0 |
12.1 |
13.4 |
13.9 |
59.6 |
103.6 |
Source: calculated on the basis of the data of statistical digests “Demographic yearbook of the Vologda Oblast in 2000–2011” and “Sex and age structure of the Vologda Oblast population in 2000–2011” .
Figure 6. Victimization rate among minors in the Russian Federation
Number of minors, who fell victim to crime (per 100 thousand people aged 0–17)
— ■ — Number of minors, who fell victim to crime (per 100 thousand people aged 14–17)
Source:Youth in Russia, 2010: statistical digest. UNICEF, Rosstat. Мoscow: Russian Statistics, 2010.
On the territory of the Russian Federation in the 2000–2011 period the number of underage crime victims (up to 17 years old inclusively) declined from 104.1 to 93.2 thousand people. In the same period, the given indicator fell from 1991.4 to 1656.7
thousand people among the rest of the population. However, criminal activity under 14 years of age is very low, hence, it would be more correct to consider the 14–17 age group, the indicator in which is 3 times higher (fig. 6) .
Table 8. Homicide and suicide mortality rate among men and women (per 100 thousand of population)
|
Population category |
2000 |
2003 |
2005 |
2007 |
2009 |
2010 |
2011 |
2011 to 2000, % |
2011 to 2005, % |
|
|
Vologda Oblast* |
||||||||||
|
Men |
Suicides |
101.2 |
98.2 |
71.3 |
65.8 |
52.8 |
57.7 |
47.0 |
46.4 |
65.9 |
|
Homicides |
61.3 |
54.5 |
49.8 |
40.1 |
32.7 |
26.9 |
24.6 |
40.1 |
49.4 |
|
|
Women |
Suicides |
18.9 |
12.5 |
11.8 |
9.2 |
9.6 |
4.5 |
7.1 |
37.6 |
60.2 |
|
Homicides |
11.8 |
14.9 |
12.8 |
6.6 |
5.6 |
8.2 |
6.8 |
57.6 |
53.1 |
|
|
Russian Federation |
||||||||||
|
Men |
Suicides |
70.3 |
64.9 |
58.1 |
51.6 |
47.3 |
n/d |
n/d |
– |
– |
|
Homicides |
45.2 |
47.2 |
40.4 |
29.2 |
24.4 |
n/d |
n/d |
– |
– |
|
|
Women |
Suicides |
11.8 |
11.0 |
9.8 |
9.6 |
8.5 |
n/d |
n/d |
– |
– |
|
Homicides |
13.3 |
13.4 |
11.5 |
8.1 |
7.0 |
n/d |
n/d |
– |
– |
|
|
* Data on the homicide mortality rate in the Vologda Oblast – for able-bodied population. Source: Demopgraphic yearbook of the Vologda Oblast for 2000–2012. |
||||||||||
Homicide and suicide mortality rate is 5–6 times higher among men than women. This ratio has remained stable in the 2000–2011 period in the Vologda Oblast, as well as in the country on average (tab. 8) .
The increased level of suicides among men is noted in many classical (P. Sorokin, E. Durkheim) and modern (D. Wasserman4, G.V. Starshenbaum5) studies. Scientists agree that lack of social integration, the sense of loneliness, mental anguish constitute the main factor in suicidal behaviour. For example, the fact that most suicides are committed by men of 45–50 years of age, who at this age start developing health problems and don’t know how to deal with ageing. As a result of this, they no longer feel supported by their wives, who are much-in-demand at this period by children or grandchildren. In addition, men painfully react to the loss of employment that is the main source of family income, and work team that is one of their most important social groups for them.
The number of crime victims among men is annually higher than among women (fig. 7), due to the differences in terms of socialization, as well as the greater involvement of men in outdoor activities [4, p. 116].
Crime tendencies in both population categories under review are generally identical: decline in the number of crime victims in the 2002–2004 period due to the adoption of the revised Code of Criminal Procedure (July 2002), according to which many acts that had been previously considered serious crimes, fell under the category of medium-gravity crimes, whereas the number of the registered facts of such crimes remained practically unchanged. The number of crime victims since 2006 has been decreasing worldwide (in the EU countries this tendency has been observed since 2004) [27].
It should also be noted that the ratio of the number of crime victims among men and women considerably reduced throughout the country in the 2000–2011 period (2.5 times in 2000, 1.4 times in 2011), which may be an indirect result of the emancipation process. Thus, as early as in the 19th century, experts predicted that gender equalization would either reduce or completely eliminate the differences in the criminal activities of men and women. However, the differences yet remain [4, p. 109].
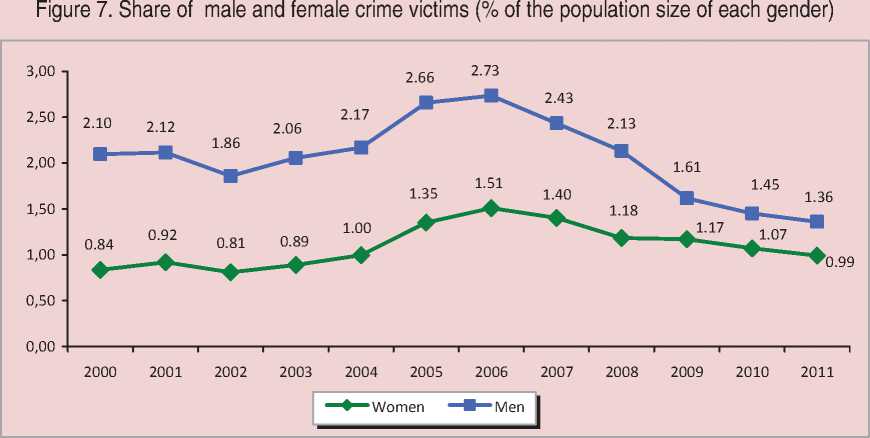
Source: Russian statistical yearbook. 2012: statistical digest. Rosstat. Moscow, 2012.
At the regional level, the “convergence” tendency of the victimization level among men and women is even more distinct. According to the opinion polls, conducted on the territory of the Vologda Oblast, the share of men and women among the victims to offences or acts of hooliganism is almost the same (as follows from 2012 data, 52.4 and 47.6%, respectively).
The ratio of suicides and homicides in urban and rural territories of the Vologda Oblast is similar to the all-Russian one: rural population dies by homicide or suicide approximately 1.52 times more often than the urban population (tab. 9). According to the authors, the main reason lies in harsher social and economic living conditions in rural areas. Thus, in 2010 the income of urban and rural residents amounted to 12.921 and 9.234 rubles per month respectively, the total amount of available resources made up 14.309 and 10.912 rubles per month. The expenses on alcoholic drinks accounted for 1.8 and 2.5% respectively out of total expenditures (1.8 and 2.9% in 2009). The number of the unemployed among the urban and rural population in 2010 amounted to 6.5 and 11.2% out of the total number of economically active population (6.9 and 10.4% in 2009).
The increased level of homicides and suicides in rural territories is typical not only for the Vologda Oblast, but for the rest of NWFD regions (tab. 10) . It should also be noted that the Vologda Oblast occupies the 4th place among Northwestern regions with regard to the urgency of the issue in rural areas.
Social minorities of different kinds (immigrants, refugees, displaced persons) are representatives of risk groups, which is associated with their adaptation and assimilation in a new society.
High dependency on the state of social health results in the increased victimization of these population categories. For example, women, children, the elderly depend on the stability of the family as a social institution. At the same time, the number of immigrants, alcohol abusers and other categories is a direct consequence of social processes, the degree of population adaptation to the changing social environment.
Table 9. Homicide and suicide mortality rate in urban and rural territories (per 100 thousand of population)
Territory 1990 1995 2000 2005 2010 2011 2011 to 1990 (%) 2011 to 2005 (%) Vologda Oblast City Suicides 26.3 49.8 47.3 29.0 16.6 14.8 56.3 51.0 Homicides 13.9 25.8 26.1 21.1 9.8 10.3 74.1 48.8 Village Suicides 40.2 71.1 79.3 60.9 47.5 46.8 116.4 76.8 Homicides 16.4 20.1 27.9 26.8 24.0 16.0 97.6 59.7 Russian Federation City Suicides 24.2 37.8 33.8 26.4 18.1 n/d – – Homicides 13.9 32.3 28.7 24.2 12.0 n/d – – Village Suicides 32.7 51.5 53.9 47.9 38.2 n/d – – Homicides 15.4 26.5 27 26.9 16.8 n/d – – Source: Federal State Statistics Service database. Available at:
Table 10. Suicide rate in urban and rural areas by NWFD (deaths per 100 thousand population, 2010)*
|
Territory |
Urban territories |
Rural territories |
||
|
Suicides |
Homicides |
Suicides |
Homicides |
|
|
Russian Federation |
18.1 |
12.0 |
38.2 |
16.8 |
|
Northwestern Federal District |
17.1 |
10.6 |
44.6 |
21.8 |
|
Republic of Karelia |
22.0 (4) |
12.5 (5) |
45.2 (5) |
16.2 (6) |
|
Komi Republic |
28.0 (2) |
17.7 (1) |
82.1 (1) |
42.7 (1) |
|
Arkhangelsk Oblast |
31.3 (1) |
16.0 (2) |
63.2 (2) |
26.6 (3) |
|
Vologda Oblast |
16.6 (7) |
9.8 (8) |
47.5 (4) |
24.0 (4) |
|
Kaliningrad Oblast |
21.3 (5) |
9.6 (9) |
31.0 (7) |
12.2 (8) |
|
Leningrad Oblast |
20.8 (6) |
13.2 (4) |
26.5 (8) |
15.2 (7) |
|
Murmansk Oblast |
13.9 (9) |
10.5 (7) |
12.2 (9) |
8.7 (9) |
|
Novgorod Oblast |
22.7 (3) |
15.1 (3) |
44.5 (6) |
29.5 (2) |
|
Pskov Oblast |
16.2 (8) |
11.4 (6) |
49.0 (3) |
19.3 (5) |
|
Saint Petersburg |
10.8 (10) |
7.5 (10) |
0.0 (10) |
0.0 (10) |
* The region’s position in NWFD is shown in brackets.
Source: Federal State Statistics Service database. Available at:
Victim lifestyle is characterized by an individual’s choice of the behaviour type (conscious or unconscious, independent or influenced by circumstances), increasing the degree of danger and possibilities of becoming a victim of violence. High victimity is characteristic of the lifestyle of marginalized population groups (homeless people, neglected children, beggars, etc.), refugees, forced migrants, immigrants, and those population categories that are to deal with objective difficulties of socialization (such as low income, lack of employment). The number of people, defined as high-risk crime victims, is presented in table 11 .
Thus, social situation forms a certain level of victimization on the territory of the country, that is, creates a social stratum, the representatives of which are at greater risk of falling victim to crime due to their personal qualities and behavioural stereotypes. Their number depends on the standard and quality of living of the population, political and economic stability, operating efficiency of social institutions. The number of victims on the territory of the Russian Federation has been decreasing since 2005, following the decline in the crime rate. Nevertheless, the urgency of the victimization issue remains acute due to rather high share of the population, included in the risk group.
Table 11. Social groups with high victimity risk
|
Population category |
Russian Federation |
Northwestern Federal District |
Vologda Oblast |
||||||
|
2000 |
2005 |
2010 |
2000 |
2005 |
2010 |
2000 |
2005 |
2010 |
|
|
Number of the unemployed (per 10 thousand people) |
525.3 |
367.8 |
394.5 |
497.9 |
304.1 |
341.3 |
424.7 |
274.1 |
433.3 |
|
Number of persons receiving substandard income (in % of total population) |
29.0 |
17.7 |
12.5 |
33.2 |
17.3 |
13.9 |
25.5 |
18.3 |
16.8 |
|
(per 100 thousand of population) |
40.4 |
6.2 |
1.5 |
28.0 |
1.1 |
0.4 |
18.6 |
0.1 |
0.0 |
|
Number of arrived migrants (per 10 thousand of population) |
181.6 |
145.9 |
n/a |
170.3 |
130.8 |
n/a |
146.2 |
101.9 |
n/a |
|
Number of alcoholics and people diagnosed with alcoholic psychosis (per 100 thousand of population) |
130.6 |
146.2 |
107.7 |
131.1 |
141.9 |
99.0 |
98.8 |
150.2 |
104.4 |
|
Number of drug addicts (per 100thousand of population) |
50.7 |
17.0 |
17.4 |
35.6 |
17.7 |
18.3 |
28.6 |
11.6 |
11.0 |
Source:Russian Statistical yearbook, 2010: statistical digest. Rosstat. Moscow., 2011.
The research conducted on the territory of the Vologda Oblast, showed that every third oblast resident displays symptoms of depression and experiences such negative emotions, like fear, anguish, apathy, anger. From 20 to 30% of the oblast residents are socially passive, often get in conflict situations and have problems with communication.
The significant share of population with characteristics of social disintegration, does not imply that all these people will attempt to commit suicide or fall victim to crimes.
However, they are at risk, and their growing number is a factor contributing to the urgency of the issues of crime and suicidal behaviour as social phenomena and social health indicators. This necessitates more thorough study of the issues, related to the characteristics of the social disintegration of the population, and the execution of research on the given subject, as well as the adoption of measures eliminating the risk factors of the social environment, furthering the transformation of an individual into a crime and suicide victim.
References Overcoming social disintegration as a factor in promoting social health
- Valiakhmetov R.M. The experience of the sociological research in the suicide issue. Public opinion journal: Data. Analysis. Debates. Yury Levada analytical centre (Levada-Centre); Social Sciences Interdisciplinary Academic Centre (Intercentre). 2010. No. 1(103). P. 65-89.
- Vishnevetskiy K.V. The criminal victimization of social groups in modern society: Dr. of Law thesis synopsis. Мoscow, 2007. Available at: http://sartraccc.ru
- Volkova V.V. The phenomenon of victim behavior in the conditions of modern megalopolis. Available at: http://socionom.ru/baza-znanii/polnotekstovye-versii-zhurnalov/uchenye-zapiski-sankt-peterburgskogo-gosudarstvennogo-instituta-psikhologii-i-socialnoi-raboty/vypusk-no2-14-2010/fenomen-viktimnogo-povedenija-v-uslovijakh-sovremennogo-megapolisa/
- Giddens A. Sociology: textbook. Мoscow: URSS editorial, 2005.
- Golenkova Z.T., Igitkhanyan Ye.D. Integration and disintegration processes in the social structure of Russian society. Socis. 1999. No. 9. P. 22-33.
- Demographic yearbook of the Vologda Oblast for 2000-2010.
- Zadorozhnyi V.I. Victimological safety and the measures of victimological prevention providing it. Tambov, 2005. P. 38.
- Kinsburskiy A.V. Mass protest potential and support social base (on the prospects of Russian reforms). Russia reforms: yearbook -2005. Editor-in-chief L.M. Drobizheva. Мoscow: RAS Sociology Institute, 2006. P. 216.
- Levada Yu.A. Displeased human: protest and patience. From opinions to understanding. Sociological essays. 1993-2000. Мoscow: Moscow school of political studies, 2000.
- Russia's youth -2010: statistical digest. UNICEF; Rosstat. Мoscow: Russian statistics, 2010.
- Morev M.V., Shabunova A.A., Gulin K.A., Popova V.I. Violent death issues in Russia. Vologda: ISEDT RAS, 2012.
- Morev M.V., Shabunova A.A., Gulin K.A. Socio-economic and demographic aspects of suicidal behavior. Vologda: ISEDT RAS, 2010.
- Myagkov A.Yu., Yerofeev S.V. Suicides in the Ivanovo Oblast: analyzing time trends. Sociological journal. 2007. No. 2. P. 47.
- Petuhov V.V. Crisis and perspectives of Russian Democracy. Russia reforms: yearbook. Editor-in-chief M.K. Gorshkov. Issue 8. Мoscow: RAS Sociology Institute, 2009. P. 307-328.
- Sex and age structure of the Vologda Oblast population in 2000-2011.
- Why do sociologists speak of the growing protest moods in Russia: interviewing L.P. Pautova, Director of the projects FOM-Terri. Svoboda Radio, April 18, 2013. Available at: http://www.svoboda.org/content/transcript/16798130.html
- Psychology of health: a textbook for higher schools. Ed. by G.S. Nikiforov. Saint Petersburg: Piter, 2006.
- Russian regions: socio-economic indicators. Rosstat. Moscow, 2011.
- Rimashevskaya N.M. Russian Cross. Priroda. 1999. No. 6. Available at: http://vivovoco.rsl.ru
- 2011 Russian statistical yearbook: statistical digest. Rosstat. Moscow, 2011
- Social standing and living standards of Russian population in 2011: statistical digest. Rosstat.
- Toshchenko J.T. New trends in the development of Russian Sociology. Socis. 2013. No.3. P. 3-13.
- Shabunova A.A., Gulin K.A., Lastochkina M.A., Solovyova T.S. Modernization of the region's economy. Vologda: ISEDT RAS, 2012.
- Shabunova A.A., Leonidova G.V. Human capital as an indicator of sustainable development of the territory. Economic and social changes: facts, trends, forecast. 2011. No. 5. P. 101-116.
- Shabunova A.A., Shakhotko L.P., Bobrova A.G., Malanicheva N.A. Able-bodied population mortality in Russia and Belarus as a threat to the demographic development of the territories. Economic and social changes: facts, trends, forecast. 2012. No. 2. P. 83-94.
- Tsherbakova Ye. Demoscope Weekly. Available at: http://demoscope.ru/weekly/2007/0313/barom01.php
- Russian statistical yearbook. 2012: statistical digest. Rosstat. Moscow, 2012
