Overcoming social inequality as an impetus to socio-cultural modernization

Author: Shabunova Aleksandra Anatolevna, Lastochkina Mariya Aleksandrovna
Journal: Economic and Social Changes: Facts, Trends, Forecast @volnc-esc-en
Section: Development strategy
Article in issue: 3 (33) т.7, 2014.
Free access
The article shows that the main factors constraining socio-cultural modernization are social inequality and low standard of living. A swift modernization development requires the presence of a favorable environment that gives an impetus to the society for modernization, as well as certain (modern) level of innovation, technological and socio-cultural development. In addition, the advantages and problems related to the assessment of modernization in the regions of the Federal District, based on the methodology developed at China Center for Modernization Research, the Chinese Academy of Sciences. Modernization is considered as a process that leads not only to technological and innovation progress, but mainly to favorable changes in society and to the improvement of human potential with the preservation of traditions and cultural heritage. The study has found out that the hampering of modernization in the Northwestern Federal District includes two aspects: economic and cognitive...
Modernization, socio-cultural dynamics, subjects of modernization, population
Short address: https://sciup.org/147223608
IDR: 147223608 | UDC: 316.4 | DOI: 10.15838/esc/2014.3.33.6
Text of the scientific article Overcoming social inequality as an impetus to socio-cultural modernization
The transition to innovation development, promotion of economic growth and structural changes in the economy have led to the increase in the role of human capital and socio-cultural determinants. Sociocultural change is a complex, multifaceted process that has many different aspects, each of which can become an independent object of research into social, economic and cultural dynamics. The degree of socio-cultural development of society can be defined when considering the specifics of socio-cultural development of individuals, who live and identify themselves on a certain territory that has its own socio-cultural features. The current state of modern Russian society is characterized by several kinds of social inequality, among which the disparities in wealth are most important. These disparities are very important, but they are not so obvious and transparent, and they can be described by such indicators as the level of income, financial capital, production and non-production property, including housing and land, durable goods, luxury items, and subjective indicators.
If we look at the regions of the Northwestern Federal District (NWFD), we note that a significant gap in the income of the richest 10% and the poorest 10% (the decile ratio) is observed in the Nenets Autonomous Okrug (19.9 times, tab. 1 ) that specializes in mining and has large deposits of oil, gas and hydrocarbons, and in Saint Petersburg (19.4 times in 2012), which is quite natural for the second largest city of federal importance (the decile ratio is from 6 to 9 in developed European countries) [10]. A moderate stabilization of the decile ratio in recent years is caused by the government’s measures seeking to increase expenditures on social payments, namely pensions and social benefits, which contributed to the decrease in the group of needy citizens.
The social stratification of citizens is increasing judging by the assessment of the Gini coefficient: its growth in the regions in the period between 2000 and 2012 varies from 5 to 39% (tab. 2) . Especially high rates of deepening income inequality were observed in the Leningrad Oblast, Saint Petersburg and the Pskov Oblast (39, 30
Table 1. Ratio of the average income of the richest 10% to the poorest 10% in the NWFD regions and the RF for 2000–2012*
|
Region |
2000 |
2005 |
2008 |
2010 |
2012 |
|
Nenets AO |
– |
15.9 |
23.8 |
19.8 |
19.9 |
|
Saint Petersburg |
9.4 |
17.5 |
18.3 |
19.8 |
19.5 |
|
Komi Republic |
14.5 |
17.3 |
17.5 |
17.3 |
16.9 |
|
Russian Federation |
13.9 |
15.2 |
16.9 |
16.5 |
16.4 |
|
Novgorod Oblast |
9.8 1 |
10.5 |
13.8 |
14.5 |
15.0 |
|
Murmansk Oblast |
11.6 |
11.6 |
13.6 |
13.7 |
13.8 |
|
Kaliningrad Oblast |
8.1 |
9.1 |
11.7 |
12.1 |
13.4 |
|
Arkhangelsk Oblast |
8.5 |
11.0 |
12.3 |
12.6 |
13.2 |
|
Leningrad Oblast |
6.1 |
10.0 |
12.0 |
12.3 |
12.9 |
|
Pskov Oblast |
7.5 |
9.6 |
12.0 |
11.9 |
12.2 |
|
Vologda Oblast |
8.0 |
11.2 |
12.4 |
11.7 |
12.0 |
|
Republic of Karelia |
7.9 |
9.2 |
10.4 |
10.7 |
11.6 |
|
* Ranked by the column “2012”. Source: Regiony Rossii. Sotsial'no-ekonomicheskie pokazateli. 2001–2012: stat. sb. [The Regions of Russia. Socio-Economic Indicators. 2001-2012: Statistical Digest]. Rossstat. Moscow, 2001–2013. |
|||||
Table 2. Dynamics of the Gini coefficient in the NWFD regions*
Additional statistics on the population inequality can be found in the subjective assessments of people living in a particular region. So, the results of ISEDT RAS public opinion monitoring concerning the political and economic situation in the regions of the Northwestern Federal District for 2005–2013 make it possible to present the situation in dynamics in a given region and to carry out cross-regional comparisons. The sampling is 5000 people from ten regions of
Table 3. Distribution of answers to the question: “Which of the following assessments describes your income most accurately?”* (as a percentage of the number of respondents)
|
Region |
I have enough money to buy most of the goods |
At best, I have enough money to buy foodstuffs |
||||||||
|
2005 |
2008 |
2009 |
2010 |
2013 |
2005 |
2008 |
2009 |
2010 |
2013 |
|
|
Leningrad Oblast |
61.6 |
70.1 |
72.0 |
73.5 |
63.8 |
38.3 |
29.9 |
28.0 |
26.4 |
30.9 |
|
Saint Petersburg |
69.5 |
79.0 |
59.4 |
79.9 |
64.6 |
30.4 |
21.0 |
40.5 |
20.1 |
31.7 |
|
Arkhangelsk Oblast |
58.2 |
66.4 |
71.7 |
63.5 |
61.3 |
41.8 |
33.6 |
28.2 |
18.3 |
35.8 |
|
Komi Republic |
55.7 |
70.2 |
53.1 |
63.6 |
63.2 |
44.3 |
29.8 |
47.0 |
36.5 |
36.7 |
|
Republic of Karelia |
64.8 |
73.1 |
64.0 |
71.8 |
60.8 |
35.2 |
26.9 |
36.0 |
28.2 |
38.4 |
|
Northwestern Federal District |
60.2 |
69.4 |
58.3 |
70.9 |
57.4 |
40.1 |
30.6 |
41.7 |
29.2 |
39.6 |
|
Vologda Oblast |
58.5 |
65.5 |
59.2 |
64.2 |
53.5 |
41.5 |
34.5 |
40.8 |
35.9 |
40.3 |
|
Murmansk Oblast |
60.8 |
72.0 |
64.5 |
64.8 |
55.9 |
39.3 |
28.0 |
35.6 |
35.3 |
42.4 |
|
Pskov Oblast |
– |
64.4 |
48.3 |
69.1 |
47.1 |
– |
35.6 |
51.6 |
30.9 |
43.1 |
|
Novgorod Oblast |
– |
61.0 |
50.7 |
73.S |
53.6 |
– |
39.0 |
49.3 |
26.3 |
46.3 |
|
Kaliningrad Oblast |
50.1 |
72.1 |
40.3 |
66.4 |
49.7 |
50.0 |
27.9 |
59.8 |
33.6 |
50.3 |
* Ranked according to the data of the column: “at best, I have enough money to buy foodstuffs” for 2013. Source: sociological survey carried out by ISEDT RAS in 2005–2013.
the Northwestern Federal District (the Arkhangelsk, Vologda, Kaliningrad, Leningrad, Murmansk, Novgorod, Pskov oblasts, the Republic of Karelia, the Komi Republic, Saint Petersburg). The sample size for each region is at least 400 respondents, sampling error does not exceed 5%. According to the research, more than half of the population of the Federal District (50–60% depending on region) “have enough money to purchase most of the goods” (tab. 3), while the rest of the population “have enough money, at best, to buy food”. People’s incomes have been seriously affected by the financial and economic crisis, which neutralized favorable changes in the subjective selfassessment of financial situation observed before 2008. A sharp increase in the proportion of low-income population was observed in the first post-crisis (2009) year: in the Kaliningrad Oblast and Saint Petersburg – almost in 2 times, in the Komi Republic and the Pskov Oblast – in one and a half times. In 2005–2013, the share of the “wealthy” population decreased almost everywhere except for the Komi Republic and the Arkhangelsk Oblast that retain one of the highest per capita incomes in the District.
The distribution of respondents’ answers by social groups shows that 51–70% consider themselves to be the middle social group (tab. 4) . The most representative middle group is observed in the republics of Komi and Karelia, the least representative – in the Murmansk Oblast. The proportion of respondents, who identify themselves with the top social group, is the greatest in the Leningrad Oblast; the share of those identifying themselves with the bottom group is the largest in the Pskov Oblast. The assessments given by respondents when comparing their social status and living standards in the region and the country as a whole are characterized by a decrease in the share of the upper group and an increase in the share of the bottom group.
Table 4. Distribution of answers to the question: “What social strata do you identify yourself with in your city (village)?”* (as a percentage of the number of respondents)
|
Region |
Answer options |
|||||
|
Upper group |
Group above median |
Median group |
Group below median |
Bottom group |
Difficult to answer |
|
|
Leningrad Oblast |
6.0 |
15.7 |
55.6 |
14.5 |
3.5 |
4.7 |
|
Murmansk Oblast |
2.5 |
10.8 |
51.2 |
19.6 |
6.1 |
9.8 |
|
Saint Petersburg |
2.5 |
12.7 |
58.4 |
14.2 |
2.7 |
9.5 |
|
Pskov Oblast |
2.0 |
11.0 |
54.8 |
16.3 |
9.8 |
6.3 |
|
Novgorod Oblast |
1.0 |
5.8 |
58.5 |
22.0 |
6.0 |
6.8 |
|
Republic of Karelia |
0.8 |
6.8 |
66.6 |
19.1 |
3.0 |
3.8 |
|
Arkhangelsk Oblast |
0.8 |
9.5 |
60.0 |
13.5 |
3.0 |
13.3 |
|
Vologda Oblast |
0.7 |
7.3 |
55.8 |
20.1 |
6.1 |
10.1 |
|
Komi Republic |
0.5 |
5.9 |
70.1 |
16.3 |
3.7 |
3.5 |
|
Kaliningrad Oblast |
0.5 |
8.0 |
57.3 |
23.5 |
6.5 |
4.3 |
|
NWFD (identification: city/village) |
1.5 |
9.0 |
57.9 |
18.6 |
5.3 |
7.7 |
|
NWFD (identification: region) |
0.8 |
6.2 |
51.2 |
23.0 |
6.9 |
11.9 |
|
NWFD (identification: country) |
0.8 |
4.5 |
41.8 |
24.9 |
13.1 |
15.0 |
* Ranked according to the data of the column “Upper group”. Source: sociological survey carried out by ISEDT RAS in 2013.
For instance, only 5.3% of the population consider themselves to be the lower social class on average in the NWFD in the scale of their city (village); but if we compare this indicator with the total population of the country, this figure increases in 2.5 times up to 13.1%. This circumstance indicates the presence of socio-economic problems at the regional and municipal level (low levels of income, economic activity and investment attractiveness of the area, etc.). Thus, we can define three levels of identity. The first and the highest level includes settlement identity (intensity of identity above average). The second – regional identity (with average intensity). The third level is below average, it combines national and universal identity.
When assessing the quality of life, people often compare it with the life in the neighboring regions of the country; therefore, the issues of regional disparities and differentiation between Russian regions are reflected in the socio-economic and geographic location of their territories. So, according to subjective assessments of the respondents we can conclude that quality of life in Saint Petersburg, in the Kaliningrad and Leningrad oblasts is higher than in other regions of the Northwestern Federal District. One in three people in the Pskov Oblast and 28.3% of respondents in the Novgorod Oblast thinks that he/she lives worse than their neighbors (tab. 5). On average, the share of positive and negative answers in the Federal District is balanced: as suggested by slightly less than half of the respondents (45.5%), it all depends on the example of comparison. It means, we can conclude that in general the District inhabitants are satisfied with the quality of
Table 5. Distribution of answers to the question: “In your opinion, do the residents in your region live better or worse than the residents in the nearby regions?”* (as a percentage of the number of respondents)
|
Region |
Answer options |
|||
|
They live better |
They live better compared to some people, and worse, compared to others |
They live worse |
Difficult to answer |
|
|
Saint Petersburg |
48.1 |
35.2 |
3.5 |
13.2 |
|
Kaliningrad Oblast |
29.5 |
32.5 |
18.0 |
20.0 |
|
Leningrad Oblast |
28.4 |
47.4 |
8.0 |
16.2 |
|
Komi Republic |
21.0 |
41.2 |
18.0 |
19.8 |
|
Northwestern Federal District |
17.4 |
45.5 |
17.6 |
19.5 |
|
Murmansk Oblast |
14.0 |
53.4 |
14.2 |
18.4 |
|
Vologda Oblast |
13.6 |
46.8 |
16.0 |
23.6 |
|
Novgorod Oblast |
9.5 |
39.8 |
28.3 |
22.5 |
|
Pskov Oblast |
7.0 |
46.3 |
30.3 |
16.5 |
|
Arkhangelsk Oblast |
6.3 |
51.0 |
22.5 |
20.3 |
|
Republic of Karelia |
4.8 |
59.0 |
21.4 |
14.8 |
* Ranked according to the data of the column “They live better”. Source: sociological survey carried out by ISEDT RAS in 2013.
life in the place of their residence and do not express protest moods.
As follows from the survey data, most NWFD residents (53.5%) were born in their place of residence, 27% came voluntarily from a different town of the same region. 17.2% of the population came voluntarily from other regions of Russia and the CIS: the Kaliningrad Oblast turned out to be the most attractive (35%), because it is a free economic zone and it provides favorable conditions for self-employment; the least attractive areas include the Arkhangelsk Oblast and the Komi Republic (10% for each), because they are part of the Northern territories. Territorial mobility of the District inhabitants is mostly conditioned by a change in marital status – for one in four people; by a change the place of study, professional activity (work) – for one in five people. To a lesser extent people’s mobility is affected by the lack of conditions for professional growth and absence of comfortable living conditions (5 and 12%, respectively) [8]. For example, people move to Saint Petersburg, the Republic of Karelia and the Vologda Oblast mostly because of education opportunities (43, 35.3 and 27.8%, respectively), their moving to the Pskov Oblast is connected with the change of marital status (33.5%), and to the Arkhangelsk Oblast – with the change of work (29%).
The distribution of answers to the question: How do you feel toward your region?” backs the conclusion about the prevalence of positive assessments of social well-being among the NWFD population. Almost one in three inhabitants of the Federal District is glad that he/she lives here (fig. 1) ; half of the respondents are
Figure 1. Distribution of answers to the question: “What are your feelings towards the region you live in?” (as a percentage of the number of respondents)
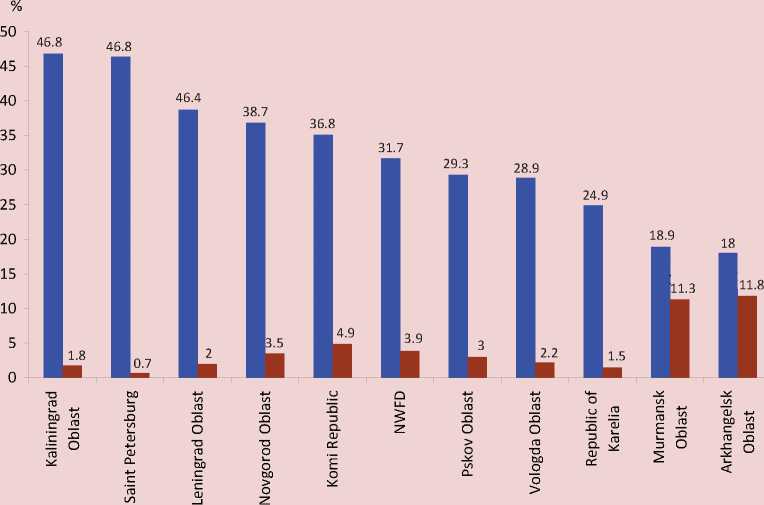
■ I am glad that I live here ■ I would like to move to another region of Russia
Source: sociological survey carried out by ISEDT RAS in 2013.
generally satisfied with the place of their residence, although they are aware of existing problems. However, there are certain regions in the District, where people are not so positive and experience greater dissatisfaction with the place of their residence; these are mainly Northern regions: the Murmansk and Arkhangelsk oblasts. Over 11% of respondents from these regions would like to move to another region, and the main reason for this lies in the deterioration of living standards in the recent years, and also in severe climatic conditions.
Speaking about the socio-cultural development of the Northwestern Federal
District, let us refer to the study of conditions and specifics of modernization processes that were going on in the regions in 2000–2010. Secondary modernization (SM) is a process accompanying the development of industrial society, based on knowledge, informatization, greening and globalization [7]. The main priority is the improvement of life quality; and the dynamics of SM is manifested through innovation in knowledge, institutions, and human capital. The positive dynamics of this process in the regions of the NWFD can be observed in the period under consideration: the level of SM has increased in all areas. In the end, five regions (the Republic of Karelia, the Arkhangelsk, Novgorod, Vologda, Pskov oblasts) in 2005 managed to overcome the low level threshold, and rose to the level below the median; and in 2010 three of them (the Republic of Karelia, the Archangelsk and Novgorod Oblasts) reached the median level. For 10 years two regions (the Leningrad Oblast, the Komi Republic) have shifted from the “lower median” to the “median” level; and one region (the Murmansk Oblast) has reached the level “above median”. Saint Petersburg stands out among all the territories: in 2010 none of the District’s regions was able to reach the level that the city had in 2000. This difference is provided by a high index of knowledge innovation, which exceeds that in other territories from 3 to 12 times.
Figure 2. Phase of secondary modernization of the NWFD territories that have reached the transitional phase of primary modernization
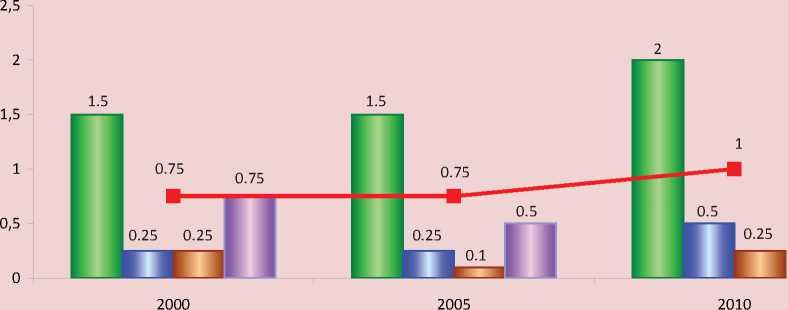
Saint Petersburg ■ — ■ Komi Republic I—I Arkhangelsk Oblast
■ = ■ Murmansk Oblast — ■ — NWFD
Source: IS “Modernization”
Figure 3. Dynamics of the states (types) of modernization degree in the regions of the NWFD
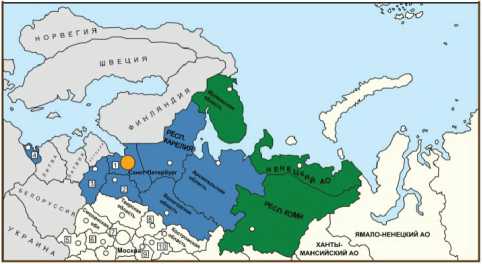
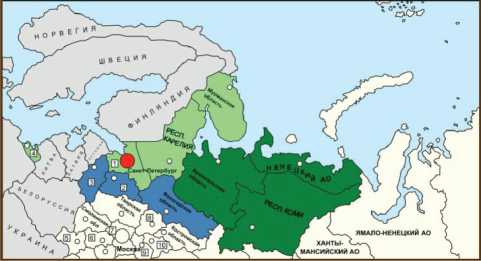
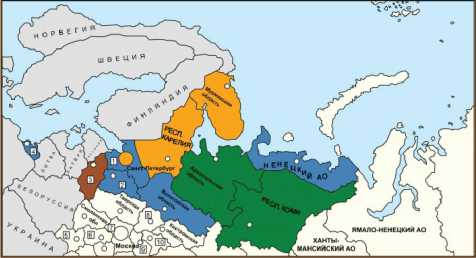
NORTHWESTERN FEDERAL DISTRICT: DYNAMICS OF MODERNIZATION IN THE REGIONS (2000–2010)
|
PM: beginning, growth, traditional; below median, preliminary |
PM: maturity; below median |
PM: maturity; median, above median |
SM: preparation; all average |
SM: beginning; high, above median, median |
SM: growth; high, above median, |
Legend: PM – the stage of primary modernization, SM – the stage of secondary modernization. After (:) – phases of modernization stages, after (;) – levels of SM.
Figures on the map denote the following republics, krais, oblasts : 1. Leningrad Oblast, 2. Novgorod Oblast, 3. Pskov Oblast, 4. Kaliningrad Oblast, 5. Bryansk Oblast, 6. Kaluga Oblast, 7. Moscow Oblast, 8. Yaroslavl Oblast, 9. Vladimir Oblast, 10. Ivanovo Oblast.
Source: IS “Modernization”. Available at:
The phase of modernization is very important for secondary modernization. In accordance with the methodology, the phase of SM is determined provided that the territory enters the transitional phase of primary modernization (PM) [4]. In 2000, the NWFD as a whole and its five regions corresponded to a phase of transition to SM, but by 2010 – there remained only three such regions (fig. 2) . Such trends are conditioned by the increase in the ratio of value added in agriculture to GDP, which must be less than 5%, and also by the increase in the share of employment in agriculture (less than 10%) [5]. Thus, by the end of the analyzed period, only the Republic of Komi and Arkhangelsk Oblast were in the preparatory phase of SM; Saint Petersburg corresponded to the higher stage – the phase of development.
We should point out the variable success of the District in comparison with the types of modernization degree. So, the situation that was quite favorable in 2000 in the Karelia Republic and the Murmansk Oblast, which carry on information (secondary) modernization (type 5, fig. 3) and are in the phase of its beginning, has deteriorated, and 10 years later they corresponded to only the 3rd type – mature industrial (primary [3]) modernization. In 2005 the Arkhangelsk Oblast went back to the second type – “the region that continues industrial modernization”. Similar trends occurred due to the increase in the share of value added in agriculture. We note positive developments in modernization processes in other regions, except for the Komi Republic, which has been in a state of continuing information (secondary) modernization characterized by stagnation for 10 years already. The Republic has a very low index of knowledge innovation, constituting only 23% of the standard in developed countries.
As can be noted, the degree of modernization in the Northwestern Federal District has reached the fifth type (NWFD became the first among the eight RF federal districts), i.e. “regions, continuing information (secondary) modernization and preparing its development” in 2000 already. The vectors of increasing development should be directed toward the improvement of economic and cognitive components. The movement of NWFD regions along the modernization path was altogether consistent with regional national trends of inertia of transition in 2000–2008 from the first (1 and 2 types) to the second (3 and 4 types) stage of implementation of modernization strategy, as well as with the slowdown of this transition from 2008 under the impact of the crisis, which indicates that the integrated index of modernization is considerably lower in comparison with the international level (tab. 6) .
In 2000–2010 the Northwestern Federal District experienced a slight positive dynamics of the integrated index of modernization: its value increased from 59 to 71%, which correlates with the level of medium developed countries (range from 53 to 83%). Among the three groups of parameters of the integrated index the situation is less favorable in the economic sphere (the index is 56%). However, as we can see from the detailed consideration of
Table 6. Distribution of Russian regions by types of modernization degree *
|
Condition (type) of modernization degree |
Number of the RF regions (NWFD regions) |
||||
|
2000 |
2005 |
2008 |
2009 |
2010 |
|
|
Type 6 – developed regions that continue to develop information (secondary) modernization |
1 |
2 |
1 |
2(1) |
3(1) |
|
Type 5 – regions that carry on information (secondary) modernization |
3(3) |
3(1) |
8(2) |
6 |
4 |
|
Type 4 – regions that are launching information (secondary) modernization |
9(2) |
9(3) |
12(3) |
9(3) |
11(3) |
|
Type 3 – regions with mature industrial (primary) modernization |
7 |
12 |
20 (3) |
25 (4) |
23 (4) |
|
Type 2 – regions that carry on industrial (primary) modernization |
45 (5) |
40 (7) |
29 (3) |
32(3) |
33 (3) |
|
Type 1 – regions that are launching, have launched, resumed industrial (primary) modernization |
18(1) |
17 |
13 |
9 |
9 |
* For details on the types see: Lapin N.I. Sostoyanie i problemy sotsioekonomicheskoi i sotsiokul'turnoi modernizatsii Rossiiskoi Federatsii [State and Problems of Socio-Economic and Socio-Cultural Modernization of the Russian Federation]. Sotsis [Sociological Studies], 2014.
Source: IS “Modernization”. Available at:
regional modernization, the index of the knowledge transfer has the lowest value (41–59%) in all the territories, except for the city of Saint Petersburg (93%). Such difference proceeds from the fact that Saint Petersburg is characterized by a large share of R&D expenditures in GRP and by a significant number of people applying for patents (per 1 million people);
A slowdown of modernization processes contains two aspects: economic and cognitive. In all the regions, except for Saint Petersburg, they correspond to the low level. A high index of knowledge, characteristic of Saint Petersburg, supplies the cognitive component in the District, thereby leading to a balance. However, there is no direct “interaction” between the federal city and the Leningrad Oblast, which is still in the primary (industrial) stage of modernization. It should be noted that the lowest level of balance of the integrated index of modernization (IIM) is observed in the Vologda and Pskov oblasts.
Thus, the Northwestern Federal District has a number of advantages, which contributed to the achievement of a higher level of competitiveness, than in other territories of the Russian Federation. One of these advantages is the geographical position, namely, the neighborhood with the countries of the European Union and access to the sea trade routes. Natural resource base of the District contributes to the development of the fuel, metallurgical, chemical, forestry and fishery industries. Of great importance is the administrative center – Saint Petersburg. The indicators of the provision of the District with objects of industrial infrastructure exceed the national average level. However, the condition of infrastructure and trunk communications in many municipalities is not good. Due to the absence of necessary transport component and because of the sparse network of cities in the northern part of the NWFD there is a low cohesion, which hinders the efficient implementation of its economic potential. This is one of the main factors impeding the development of the District, so in the future it is necessary to pay increased attention to improving the quality of roads, heat supply systems and power grids. Production potential of the regions is limited by the conditions of the economy and innovation restructuring. It often happens that the volume and structure of investment proposals do not meet the degree of development of territorial infrastructure; most of the funds are worn out and obsolete. Requirements of modernization and transition to a new stage of technological mode necessitate the development and renewal of production capacities at a new scientific, technological and innovation basis.
According to the level of socio-cultural arrangement of cities and municipalities, the District is attractive to the population, including migrants. The only disadvantage is harsh climatic conditions in its northern part. The inaccessibility of social infrastructure facilities (education, healthcare) due to their concentration in larger settlements is an urgent problem for the population in peripheral areas. Practice shows that the territories with highly developed education, science, health and culture become leaders in the socioeconomic development of the territory. The preservation and enhancement of this potential is a priority task for modernization policy, because without it there can be no innovation economy and rapid development. It means that speedy modernization and development require the achievement of a high quality of life. It is necessary to create favorable environment, mobilizing society for modernization, as well as certain (modern) level of innovation, technological and socio-cultural development. For instance, a well-known sociologist P. Sztompka, Professor at the Jagiellonian University, points out that “modernization is a specific way of social establishment that provides the population with wide-open access to the expanding capabilities of human potential implementation” [9]. Naturally, this requires:
-
- widely available education, providing the people with necessary skills to effectively use the technological, economic and cultural opportunities that modernization offers;
-
- access to higher forms of art and culture raising sensitivity and enriching experiences.
In recent years, the opportunities of obtaining higher education have expanded considerably, though education is not always of a decent quality, but it does not reduce its importance considerably. This resource allows the modern Russian society to move to a higher stage of development and involvement of the population in the processes of modernization. Widespread informatization and computerization of public life expands the opportunities and ways of achieving goals. At the same time, these processes have a lot of negative effects: in particular, promotion of virtual communication leads to reduction in the value of actual communication. Here the perceptual side experiences more changes (the process of perception and understanding of each other by the partners), and also there is an issue of mutual trust, decency and honesty; it can result in social isolation, social apathy, unwillingness to take collective action and, as a result, to the atomization of society.
According to opinion polls (in the framework of the program “Socio-cultural portraits of Russian regions”) held in different regions of the Russian Federation, a significant part of its inhabitants (33.3%) feel affinity with the people of the settlement in which they live (the options “remote” and “alien” are chosen by 5.9% of respondents). Moreover, in the scale of “settlement – oblast – Russia” the value of this indicator reduces and the share of the population characterized by indifferent and aloof attitude to other people (36.7%) increases [13]. This may indicate the concentration of interests only on one’s personal life; it is an alarming trend, since it increases disunity in society. Public opinion polls conducted by the
Institute of Socio-Economic Development of Territories of the Russian Academy of Sciences in the Vologda Oblast [12] indicate the sustainable growth of indicators of social mood and stock of patience, and reduction in the level of protest potential (from 20.7 to 16.0% in 2007 and 2013, respectively). At the same time, we observe an increase in the share of people who consider that they cannot influence the state of affairs in the city (from 62.1 to 68.6% in 2011 and 2014, respectively), in the oblast (from 66.6 to 73.3%), in the country (from 67.4 to 73.5%); in addition, there still remain certain negative trends in public opinion concerning the performance of Russia’s Government; there are no positive changes in the assessment of the work of the authorities; the population expects less and less from the activities of the authorities. The findings indicate the isolation of man, “retirement into oneself”, and the fading of hopes to receive support from the state. We can say quite reasonably that economic and social atomism and reduction of passionarity are characteristic not only of the Vologda Oblast, but also of the Russian Federation as a whole [6]. And the resulting imbalance in the society may lead to unstable situations, increasing the risks and damages for the sociocultural system. Therefore, it is necessary to adjust socio-economic modernization in the direction of improvement of human potential and enhancement of the sociocultural component in the development of the society.
Another factor that hinders modernization is inefficient public administration, which is manifested primarily in the recent crisis of regional budgets [1]. From year to year there remains a negative tendency of increasing number of territories with debt burden above 70%. In 2012 there were seven such regions in Russia, in 2013 their number was 16. The list includes three regions from the Northwestern Federal District: the Vologda Oblast (public and municipal debt was 34 871 million rubles in 2013) [11], the Pskov Oblast (12 798 million rubles) and the Republic of Karelia (15 972 million rubles). It is necessary to mention the fact that the high level of debt is combined with its high growth rate
(for example, the growth rate in the Pskov Oblast in 2012–2013 was 159.5%) [2].
Modernization requires political will and effective public administration. The main task of the government (in the country, region, municipality) speaking about modernization is to conduct forward-looking policy and institutional reforms aimed equally at the development of innovation, new technological structure, and the development of civil society, cultural values and norms that allow people to realize their potential to the fullest extent.
Sited works
-
1. Ilyin V.A. New Agenda and State Management Efficiency. Economic and Social Changes: Facts, Trends, Forecast , 2013, no.5(29), pp. 9-13.
-
2. Ilyin V.A., Povarova A.I. Public Administration Efficiency . Vologda: ISERT RAN, 2014. 181 p.
-
3. Lapin N.I. O On the Strategy of Integrated Modernization. Economic and Social Changes: Facts, Trends, Forecast , 2014, no.1(31), pp. 26-35.
-
4. Lapin N.I. About the Experience of the Stage-Wise Analysis of Modernization. Social Sciences and Modernity , 2012, no.2, pp. 53-65.
-
5. Lastochkina M.A. Territorial Specifics of Russia’s Modernization. Regional Economics and Management: Electronic Scientific Journal , 2013, no.2(34), pp. 29-41.
-
6. Morev M.V., Kaminskii V.S. Issues of State-Society Relations. Economic and Social Changes: Facts, Trends, Forecast , 2013, no.6(30), pp. 207-224.
-
7. He Chuanqi. World and China Modernization Report Outlook (2001–2010): Translated from English . Under general editorship of N.I. Lapin; foreword by N.I. Lapin, G.A. Tosunyan. Moscow: Ves’ Mir, 2011. 256 p.
-
8. Shabunova A.A., Solov’eva T.S. Social Stratification and Social Mobility of the Vologda Oblast Population. Research in the Humanities , 2013, no.11, November. Available at: http://human . snauka.ru/2013/11/5126
-
9. Sztompka P. Modernization as Social Becoming (Ten Theses on Modernization). Economic and Social Changes: Facts, Trends, Forecast , 2013, no.6(30).
-
10. Equity and Development. World Development Report, 2006, no.4. The World Bank and Oxford University Press, 2006.
-
11. Ilyin V.A. The Problems of Development of a Region under the Conditions of the Global Crisis (Using the Vologda Region as an Example). Studies on Russian Economic Development , 2010. Vol.21, no.1, pp. 56-63.
-
12. Lastochkina M.A. Factors of Satisfaction with Life: Assessment and Empirical Analysis. Studies on Russian Economic Development , 2012, Vol.23, no.5, pp. 520-526.
-
13. Shabunova A.A., Okulova N.A. Russians Assess Social and Cultural Regional Milieu. Sociological Studies , 2011, No. 6, pp. 36-43.
References Overcoming social inequality as an impetus to socio-cultural modernization
- Lapin N.I. Sostoyanie i problemy sotsioekonomicheskoi i sotsiokul'turnoi modernizatsii Rossiiskoi Federatsii . Sotsis , 2014
- IS “Modernization”. Available at: http://mod.vscc.ac.ru/
- Ilyin V.A. Novaya povestka dnya i effektivnost’ gosudarstvennogo upravleniya . Ekonomicheskie i sotsial’nye peremeny: fakty, tendentsii, prognoz , 2013, no.5(29), pp. 9-13.
- Ilyin V.A., Povarova A.I. Problemy effektivnosti gosudarstvennogo upravleniya . Vologda: ISERT RAN, 2014. 181 p.
- Lapin N.I. O strategii integrirovannoi modernizatsii . Ekonomicheskie i sotsial’nye peremeny: fakty, tendentsii, prognoz , 2014, no.1(31), pp. 26-35.
- Lapin N.I. Ob opyte stadiinogo analiza modernizatsii . Obshchestvennye nauki i sovremennost’ , 2012, no.2, pp. 53-65.
- Lastochkina M.A. Territorial’nye osobennosti modernizatsii Rossii . Regional’naya ekonomika i upravlenie: elektronnyi nauchnyi zhurnal , 2013, no.2(34), pp. 29-41.
- Morev M.V., Kaminskii V.S. Problemy vzaimodeistviya gosudarstva i obshchestva . Ekonomicheskie i sotsial’nye peremeny: fakty, tendentsii, prognoz , 2013, no.6(30), pp. 207-224.
- He Chuanqi. Obzornyi doklad o modernizatsii v mire i Kitae (2001-2010): per. s angl. . Under general editorship of N.I. Lapin; foreword by N.I. Lapin, G.A. Tosunyan. Moscow: Ves’ Mir, 2011. 256 p.
- Shabunova A.A., Solov’eva T.S. Sotsial’naya stratifikatsiya i sotsial’naya mobil’nost’ naseleniya Vologodskoi oblasti . Gumanitarnye nauchnye issledovaniya , 2013, no.11, November. Available at: http://human.snauka.ru/2013/11/5126
- Sztompka P. Modernizatsiya kak sotsial’noe stanovlenie (10 tezisov po modernizatsii) . Ekonomicheskie i sotsial’nye peremeny: fakty, tendentsii, prognoz , 2013, no.6(30).
- Equity and Development. World Development Report, 2006, no.4. The World Bank and Oxford University Press, 2006.
- Ilyin V.A. The Problems of Development of a Region under the Conditions of the Global Crisis (Using the Vologda Region as an Example). Studies on Russian Economic Development, 2010. Vol.21, no.1, pp. 56-63.
- Lastochkina M.A. Factors of Satisfaction with Life: Assessment and Empirical Analysis. Studies on Russian Economic Development, 2012, Vol.23, no.5, pp. 520-526.
- Shabunova A.A., Okulova N.A. Otsenka naseleniem sotsiokul’’turnoi sredy regiona . Sotsiologicheskie issledovaniya , 2011, No. 6, pp. 36-43.
