Passive behavior of the government. Budget problems are aggravating in the regions

Author: Povarova Anna Ivanovna
Journal: Economic and Social Changes: Facts, Trends, Forecast @volnc-esc-en
Section: Socio-economic development strategy
Article in issue: 3 (39) т.8, 2015.
Free access
Despite a number of reforms, the current multi-level budgetary system does not fully correspond to the development strategy of the country and its regions. Still the Russian Government has not taken effective measures to address the main structural contradiction of the budgetary system, based on the non-adequate distribution of revenue and expenditure responsibilities, manifested in the sharp decline in the revenue base of territorial budgets during the 2009 global financial crisis. However, the crisis effects have not been analyzed and the conclusions have not been made. The Ministry of Finance of the Russian Federation tried to solve the problem of territorial budgets imbalance not by enhancing existing mechanisms of revenue distribution at the regional level, but by granting large-scale loans to be repaid after 2012. Despite it, due to the sharp rise in the social burden1, the deficit and the debt load enlarged and resulted in the budget crisis in the regions. The experts of the Higher School of Economics state that 20 RF subjects, having the level of public debt above 80%, had been actually in default2 by the end of 2014...
Metallurgical corporation, regional budgets, income tax, public debt, public management efficiency
Short address: https://sciup.org/147223734
IDR: 147223734 | UDC: 330.341(470) | DOI: 10.15838/esc/2015.3.39.4
Text of the scientific article Passive behavior of the government. Budget problems are aggravating in the regions
Table 1. Index of physical volume of GRP in Russia in 2007–2014, % to the previous year
|
Subject |
2000–2011 |
2011 |
2012 |
2013 |
2014 |
2012–2014 |
|
Lipetsk Oblast |
105.0 |
104.8 |
101.8 |
103.4 |
101.0 |
102.1 |
|
Chelyabinsk Oblast |
104.9 |
105.3 |
102.4 |
101.5 |
102.2 |
102.0 |
|
Vologda Oblast |
103.1 |
106.9 |
104.8 |
95.5 |
100.5 |
100.3 |
|
Russian Federation |
105.3 |
104.3 |
103.4 |
101.3 |
100.6 |
101.8 |
|
Sources: data of the Federal State Statistics Service of the Russian Federation; the author’s calculations. |
||||||
Table 2. Index of physical volume of investment into fixed capital in Russia in 2008–2014, % to the previous year
|
Subject |
2008 |
2009 |
2010 |
2011 |
2012 |
2013 |
2014 |
2014 to 2008, % |
|
Lipetsk Oblast |
118.4 |
91.9 |
116.5 |
102.8 |
78.0 |
103.5 |
105.0 |
93.3 |
|
Chelyabinsk Oblast |
113.8 |
75.9 |
99.2 |
107.6 |
100.1 |
103.2 |
101.8 |
85.2 |
|
Vologda Oblast |
85.9 |
71.1 |
116.1 |
149.4 |
120.7 |
38.7 |
80.5 |
46.4 |
|
Russian Federation |
109.5 |
86.5 |
106.3 |
110.8 |
106.8 |
100.8 |
97.3 |
106.7 |
|
Sources: data of the Federal State Statistics Service of the Russian Federation; the author’s calculations. |
||||||||
Table 3. Net financial result of the organizations’ activity (profit +, loss -) in Russia in 2008–2014, billion rubles
|
Subject |
2008 |
2009 |
2010 |
2011 |
2012 |
2013 |
2014 |
2014 to 2008, % |
|
Lipetsk Oblast |
116.9 |
32.4 |
45.6 |
44.1 |
36.5 |
3.7 |
40.6 |
34.7 |
|
- metallurgy |
103.9 |
24.9 |
38.4 |
39.5 |
28.1 |
-10.9 |
30.2 |
29.1 |
|
Chelyabinsk Oblast |
53.8 |
43.7 |
67.3 |
28.6 |
53.2 |
-34.4 |
32.0 |
59.4 |
|
- metallurgy |
26.5 |
31.3 |
42.5 |
6.1 |
20.4 |
-58.0 |
No data |
No data |
|
Vologda Oblast |
90.8 |
10.6 |
-21.6 |
28.6 |
55.2 |
15.4 |
-33.6 |
х |
|
- metallurgy |
55.8 |
5.2 |
-33.3 |
0.03 |
17.3 |
12.4 |
-35.5 |
х |
|
Russian Federation |
3801 |
4432 |
6331 |
7140 |
7825 |
6854 |
5906 |
155.4 |
|
- metallurgy |
313 |
207 |
351 |
289 |
284 |
148 |
238 |
76.0 |
|
Sources: data of the Federal State Statistics Service of the Russian Federation; the author’s calculations. |
||||||||
In 2014 the budgets of metallurgy-oriented regions were executed in the conditions of aggravated socio-economic problems of regional development. The growth of gross regional product (GRP) was the lowest for the last fifteen years (excluding 2009). The Vologda region had the lowest average annual growth rate of the economy, amounting to 0.3% ( tab. 1 ).
The decrease in investment activity is one of the main factors for the deceleration of economic growth. The decline of investment in fixed assets, which amounted to 54% compared to the pre-crisis level, was recorded in the Vologda Oblast in connection with the completion of major investment projects and the reduction of investment programs of the energy companies. The negative trend in investment growth was characteristic of other regions, but the decline was not as severe as in the Vologda Oblast ( tab. 2 ).
The decline in investment activity in these regions was caused by sharp deterioration of financial results of the economic entities due to lower demand for industrial products, insufficient working capital necessary for the implementation of mutual settlements and payments ( tab. 3 ).
In 2014, even without adjustments for inflation, the net profit of enterprises in the Lipetsk Oblast and the Chelyabinsk Oblast accounted for 35%–60% of the 2008 level. The financial results of the Vologda Oblast economy were characterized by a significant loss, which amounted to 34 billion rubles, i.e. 60% of the territorial budget’s revenue.
Such serious yield decline in the economies of metallurgy-oriented regions occurred against the backdrop of significant profit growth in all the constituent entities of the Russian Federation. Surely, the metallurgical companies had a decisive influence on the formation of financial
results of the regions under analysis. The losses of the metallurgical enterprises of the Lipetsk Oblast and the Chelyabinsk Oblast in 2013 and the Vologda Oblast in 2014 could not be compensated be any other industry. It reveals disadvantages of monofunctionality once again. The decline in consumer activity, which used to be one of the drivers of economic growth, has become a distinctive feature of recent years.
In 2014 due to accelerated inflation and counter-sanctions imposed by the Russian authorities, the real wages growth rate in the Vologda Oblast and the Lipetsk Oblast, real monetary incomes of the population in the Chelyabinsk Oblast acquired a downward trend ( tab. 4 ).
The deterioration of the socio-economic situation resulted in strengthening of destructive processes in the regional budgetary systems. By the end of 2014 the metallurgy-oriented regions, like most Russian regions, could not reach the pre-crisis volume of budgets’ revenues in real terms. However if the whole country requires 6% of the sources for complete recovery of the revenue, the Lipetsk Oblast and the Chelyabinsk Oblast – 10% and the Vologda Oblast – 26% (tab. 5).
The slow recovery of revenue sources, even in the conditions of expanded support for metallurgy-oriented regions5 provided by the federal government, resulted in the accumulation of debt problems. At the same time, various aspects of the regional authorities’ debt policy are nonuniform. First, the debt load of the Vologda Oblast was above 80% and close to critical (100% in the volume of own revenues of the budget). In the Lipetsk Oblast and the Chelyabinsk Oblast the debt burden increased significantly, but was significantly lower than in the Vologda Oblast: 51 and 26% of the territorial budgets’ total revenue, respectively ( tab. 6 ).
Table 4. Consumer demand dynamics in Russia in 2008–2014, % to previous year
|
Indicators |
2008 |
2009 |
2010 |
2011 |
2012 |
2013 |
2014 |
2014 to 2008, % |
|
Vologda Oblast |
||||||||
|
Real incomes of the population |
100.5 |
103.3 |
108.2 |
100.8 |
110.6 |
105.6 |
101.8 |
134.0 |
|
Real wages |
108.4 |
92.9 |
105.6 |
99.8 |
106.9 |
104.4 |
98.2 |
107.3 |
|
Retail trade turnover |
108.5 |
89.4 |
116.3 |
107.6 |
119.7 |
101.7 |
102.0 |
138.9 |
|
Consumer price index |
114.3 |
107.2 |
109.2 |
105.7 |
106.0 |
107.2 |
112.0 |
157.5 |
|
Lipetsk Oblast |
||||||||
|
Real incomes of the population |
108.8 |
105.4 |
103.0 |
97.8 |
112.0 |
103.8 |
106.4 |
131.3 |
|
Real wages |
105.0 |
91.7 |
104.7 |
102.7 |
109.1 |
102.3 |
95.0 |
104.5 |
|
Retail trade turnover |
117.3 |
100.0 |
106.9 |
109.2 |
107.5 |
107.0 |
104.7 |
140.6 |
|
Consumer price index |
116.0 |
108.7 |
108.1 |
104.7 |
106.6 |
106.3 |
111.9 |
156.0 |
|
Chelyabinsk Oblast |
||||||||
|
Real incomes of the population |
116.1 |
97.0 |
103.1 |
99.1 |
101.8 |
104.6 |
97.2 |
102.6 |
|
Real wages |
108.8 |
91.7 |
107.9 |
104.1 |
106.7 |
107.9 |
100.0 |
118.6 |
|
Retail trade turnover |
122.4 |
93.0 |
100.8 |
101.7 |
105.6 |
104.1 |
99.5 |
104.3 |
|
Consumer price index |
112.8 |
108.6 |
109.6 |
108.3 |
106.3 |
105.4 |
109.9 |
58.7 |
|
Russian Federation |
||||||||
|
Real incomes of the population |
103.8 |
101.8 |
105.4 |
101.2 |
105.8 |
104.8 |
99.0 |
119.2 |
|
Real wages |
111.5 |
96.5 |
105.2 |
102.8 |
108.4 |
105.3 |
101.3 |
120.7 |
|
Retail trade turnover |
113.5 |
94.9 |
106.5 |
107.1 |
106.3 |
103.9 |
102.5 |
122.5 |
|
Consumer price index |
113.3 |
108.8 |
108.8 |
106.1 |
106.6 |
106.5 |
111.4 |
58.8 |
|
Sources: data of the Federal State Statistics Service of the Russian Federation; the author’s calculations. |
||||||||
Table 5. Dynamics of revenues of the RF subjects’ budgets in 2008–2014, billion rubles*
|
Subject |
2008 |
2009 |
2010 |
2011 |
2012 |
2013 |
2014 |
2014 to 2008, % |
|
Lipetsk Oblast |
76.0 |
54.3 |
59.1 |
60.3 |
61.8 |
56.8 |
56.4 |
74.2 |
|
Chelyabinsk Oblast |
60.2 |
49.0 |
48.5 |
50.0 |
50.0 |
49.1 |
54.2 |
90.0 |
|
Vologda Oblast |
159.3 |
122.0 |
141.8 |
143.3 |
145.6 |
139.2 |
142.5 |
89.5 |
|
Russian Federation |
9300.8 |
8104.3 |
8367.4 |
9111.5 |
9120.7 |
8695.4 |
8746.6 |
94.0 |
|
* In the 2014 prices. Sources: data of the Federal Treasury; Federal State Statistics Service of the Russian Federation; the author’s calculations. |
||||||||
Table 6. State and municipal debt of the RF subjects in 2008–2014
|
Indicators |
2008 |
2009 |
2010 |
2011 |
2012 |
2013 |
2014 |
|
Vologda Oblast |
|||||||
|
Received loans, billion rubles |
0.2 |
6.4 |
8.5 |
8.9 |
6.7 |
13.3 |
33.2 |
|
Debt, billion rubles |
1.7 |
11.0 |
19.0 |
26.9 |
30.9 |
34.9 |
38.0 |
|
Debt burden, %* |
3.8 |
39.4 |
52.8 |
67.0 |
70.7 |
81.1 |
82.0 |
|
Lipetsk Oblast |
|||||||
|
Received loans, billion rubles |
0 |
0.55 |
2.9 |
4.1 |
3.4 |
4.8 |
4.4 |
|
Debt, billion rubles |
4.0 |
6.5 |
7.8 |
10.4 |
13.9 |
17.7 |
22.4 |
|
Debt burden, %* |
12.0 |
25.1 |
25.7 |
30.4 |
38.7 |
46.7 |
51.4 |
|
Chelyabinsk Oblast |
|||||||
|
Received loans, billion rubles |
0.7 |
4.5 |
1.5 |
1.2 |
5.5 |
14.3 |
11.9 |
|
Debt, billion rubles |
0.3 |
4.7 |
11.9 |
13.6 |
20.4 |
28.7 |
30.5 |
|
Debt burden, %* |
0.3 |
8.0 |
13.9 |
14.2 |
19.3 |
26.2 |
26.0 |
|
Russian Federation |
|||||||
|
Received loans, billion rubles |
230.5 |
474.9 |
576.2 |
548.3 |
709.9 |
1038.3 |
1994.7 |
|
Debt, billion rubles |
599.6 |
1024.5 |
1265.5 |
1387.3 |
1596.7 |
2026.3 |
2402.3 |
|
Debt burden, %* |
12.2 |
24.0 |
25.4 |
23.8 |
25.0 |
30.8 |
33.6 |
|
* The debt burden is calculated as the ratio of debt to the volume of own incomes of the RF subject’s budget. Sources: data of the Ministry of Finance; the Federal Treasury; the author’s calculations. |
|||||||
Second, the debt policies in the Lipetsk Oblast and the Chelyabinsk Oblast were aimed at hampering the attraction of credit resources. If in 2014 the authorities of these regions curtailed borrowing, in the Vologda Oblast, on the contrary, the debt load increased by 2.5 times due to the year-end budgetary loans for the substitution of bank ones.
Giving regions loans from the federal budget, the Russian Government is trying to ease their debt problems. However, to get these loans the regional authorities must meet a number of strict conditions to reduce the deficit and market borrowings. To comply with these conditions it will be difficult, since the debt crisis is caused by the growing social expenditure under the Presidential decrees on the background of the slowdown in the economy and budgetary revenues. Besides, the aid in the form of debt financing will only lead to further worsening of the regional budgets6. Realizing this, the Ministry of Finance of the Russian Federation demands to forego a salary increase. “It is most important to decide on the expenditure commitments of
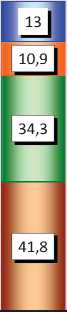
Figure 1. Structure of state and municipal debt of the RF subjects in 2014, %
100%
90%
80%
70%
60%
50%
40%
30%
20%
10%
0%
Vologda Oblast


-
□ Securities
-
□ Warranties
-
□ Budget loans
-
□ Bank loans
Lipetsk Oblast Chelyabinsk Oblast
Sources: data of the Ministry of Finance; the author’s calculations.
the regions, so that they do not increase the expenditure on salaries” , claims Minister of Finance A.G. Siluanov7. Certainly, the position of the financial agency is directly contrary to the strategic objectives set by the head of the state. Third, there were differences in the structure of debt (fig. 1) .
All the studied regions have commercial loans, but if we compare them with own revenues of territorial budgets, required for further reimbursement, it turns out that after 2014 the Vologda Oblast will have to allocate 34% of its own funds, the Lipetsk Oblast – 21% and the Chelyabinsk Oblast – 15%. Therefore, the most onerous market component of the debt will be for the Vologda Oblast budget. In addition, the Chelyabinsk Oblast has structural advantages of debt obligations, such as high proportion of conditional (guarantee) debt, and the Lipetsk region – the share of securities, comparable with bank loans, characterized by the longer repayment period and the possibility of establishing lower rates compared to bank ones. Fourth, there was a high degree of differentiation of regions by volume of budget funds used for repayment and servicing of loans. In accordance with the budget legislation, the loans repayment is carried out at the expense of own revenue sources of the sub-federal budgets, so the budget stabilization is largely determined by the level of expenditures on these purposes (tab. 7).
Table 7. Expenses of RF subjects’ budgets on repayment and servicing of loans in 2011–2014
|
Subject |
2011 |
2012 |
2013 |
2014 |
||||
|
Billion rubles |
%* |
Billion rubles. |
%* |
Billion rubles |
%* |
Billion rubles |
%* |
|
|
Vologda Oblast |
5.2 |
13.0 |
8.1 |
18.5 |
10.6 |
24.7 |
28.7 |
62.0 |
|
Lipetsk Oblast |
1.4 |
4.0 |
3.0 |
8.3 |
3.9 |
10.4 |
5.8 |
13.3 |
|
Chelyabinsk Oblast |
1.5 |
1.6 |
3.8 |
3.6 |
6.7 |
6.1 |
6.2 |
5.3 |
|
Russian Federation |
436.7 |
7.5 |
617.2 |
9.7 |
803.7 |
12.2 |
1729.6 |
24.2 |
* To own revenues.
Sources: data of the Federal Treasury; the author’s calculations.
Table 8. Public debt and investment expenses of the RF subjects’ budgets in 2011–2014, % of GRP
|
Indicators |
2011 |
2012 |
2013 |
2014 |
2014 to 2011, p.p. |
|
Vologda Oblast |
|||||
|
Public debt |
8.3 |
8.7 |
10.2 |
10.5 |
+2.2 |
|
Investment costs |
2.0 |
1.5 |
1.5 |
1.2 |
-0.8 |
|
Lipetsk Oblast |
|||||
|
Public debt |
3.6 |
4.7 |
5.6 |
6.6 |
+3.0 |
|
Investment costs |
1.6 |
1.2 |
1.6 |
1.3 |
-0.3 |
|
Chelyabinsk Oblast |
|||||
|
Public debt |
1.8 |
2.4 |
3.3 |
3.1 |
+1.3 |
|
Investment costs |
2.0 |
1.8 |
1.5 |
1.0 |
-1.0 |
|
Russian Federation |
|||||
|
Public debt |
3.1 |
3.2 |
3.8 |
4.0 |
+0.9 |
|
Investment costs |
2.6 |
2.2 |
2.0 |
1.7 |
-0.9 |
|
Sources: data of the Ministry of Finance; the Federal Treasury; the author’s calculations. |
|||||
Table 9. Per capita transfers from the federal budget to the RF subjects in 2009–2014
|
Indicators |
2009 |
2010 |
2011 |
2012 |
2013 |
2014 |
|
Russian Federation |
||||||
|
Transfers, rubles |
10472 |
9778 |
11500 |
11340 |
10546 |
11437 |
|
Vologda Oblast |
||||||
|
Transfers, rubles |
9204 |
7177 |
8358 |
8800 |
7883 |
8442 |
|
In % to the national average |
87.9 |
73.4 |
72.7 |
77.6 |
74.7 |
73.8 |
|
Transfers return,million rubles |
140.8 |
456.6 |
283.8 |
211.8 |
475.7 |
432.7 |
|
Lipetsk Oblast |
||||||
|
Transfers, rubles |
7574 |
6208 |
6988 |
7169 |
7238 |
9066 |
|
In % to the national average |
72.3 |
63.5 |
60.8 |
63.2 |
68.6 |
79.3 |
|
Transfers return,million rubles |
186.6 |
150.5 |
178.5 |
245.1 |
534.0 |
316.4 |
|
Chelyabinsk Oblast |
||||||
|
Transfers, rubles |
7132 |
6197 |
6674 |
6864 |
6434 |
7305 |
|
In % to the national average |
68.1 |
63.4 |
58.0 |
60.5 |
61.0 |
63.9 |
|
Transfers return,million rubles |
127.9 |
581.0 |
690.4 |
649.4 |
1256.5 |
1269.2 |
|
Sources: data of the Ministry of Finance; the Federal Treasury; the author’s calculations. |
||||||
These data show that the Vologda oblast has the most dramatic situation, where more than 60% of own revenues received in 2014 was used not for the development but for the reimbursement of loans and interest payments . The Lipetsk Oblast allocated 13% for these purposes and in the Chelyabinsk region the expenditure on loans repayment was unburdensome for the budget.
The steady growth of the cost of public debt servicing poses a threat to the unconditional execution of vital commitments
to the population, forcing the regional governments to allocate priority funding to repay debt. We have no information about the reason to attract loans. However, we can get a general idea by comparing the volume of public debt and investment expenses of the budget by share in GRP ( tab. 8 ).
According to the table, since 2012 these regions have been reducing capital investments and increasing public debt in GRP. Hence, the majority of attracted loans were used for financing current expenditures,
servicing and repayment of borrowings. The use of credit resources for financial support of the current expenditures will constantly necessitate refinancing and, in the end, the debt burden can become long-term.
In summary, it can be argued that the lack of clear mechanisms to finance expenditures between the budget system levels has eventually forced the regions to attract expensive market loans for the implementation of not only investment, but also social programs, provoking a protracted debt crisis , and the Russian authorities have not found a way out yet.
Speaking about budgetary problems of the regions, we can not but mention that the federal government, which largely created these problems, has reduced the financial support of regions. The amount of non-repayable receipts from the federal budget to the metallurgy-oriented regions, most affected by the crisis consequences, was by 23–37% lower than the national (tab. 9).
It is important to note that against the background of the inadequate allocation of transfers, most of them remained unspent due to their untimely provision by the central government and were returned to the federal budget. According to the table, this trend increased in 2013–2014, thus once again revealing the ineffective interbudgetary interaction.
The problems and their factors, despite some specific features, are characteristic of the overwhelming majority of RF subjects. In the metallurgy-oriented regions these problems are complicated by internal conditions related to the activities of the largest transnational corporations.
The presence of such holdings, strategic taxpayers, should create noticeable fiscal effects. However, the ISEDT RAS research8 indicates that the advantages of large-scale production are not accompanied by the acceleration of socio-economic development of territories. On the contrary, the corporation represented by their parent enterprises (steel mills9) has formed a unique system of governance in the regions of presence and become tools of pumping out local resources in favor of the owners.
Unfortunately, the analysis of public statements of parent enterprises of ferrous metallurgy corporations in 201410 justifies this conclusion, although financial performance was quite good. The enterprises’ revenues increased by 10– 18% due to the grown profitability from export sales on the background of ruble devaluation. Profit from sales was great. We should pay attention to the decline or slowdown in prime costs and costs that directly affect the tax base ( tab. 10 ).
Nevertheless, the further analysis of financial statements showed contradictory trends. According to Table 10, in 2014 CHerMK and MMK had the largest volume of sales profit after 2009. It should have led to the increase in pre-tax profit. Instead, both steel works reported about losses and in CHerMK the loss was the most significant during the period. How can the situation be justified? According to the Vologda Oblast government, the CHerMK losses were caused by the fluctuations in currency exchange11. Indeed, compared with 2013, the losses were by six times higher (tab. 11).
As shown by the results of our own analysis, the losses included the costs on dissolution of American non-core asset management companies, accounted in other expenses of CHerMK. If these expenses were not taken into account in the financial result formation, the company could have profit in the amount of 57.3 billion rubles. It would exceed the 2008 level. According to our calculations, loss of profit tax due to the recognition of such a substantial amount of unproductive expenditure amounted to 19 billion rubles, including more than 17 billion rubles to the Vologda Oblast budget. In short, in 2014 CHerMK had the potential to reach the precrisis volume of payments to the budget. These facts confirm the correctness of the ISEDT RAS conclusions about the ineffectiveness of the business transnationalization strategy
Table 10. Financial performance of steel mills in 2008–2014, billion rubles
|
Indicators |
2008 |
2009 |
2010 |
2011 |
2012 |
2013 |
2014 |
2014 to 2013, % |
|
CHerMK |
||||||||
|
Revenue |
243.6 |
143.6 |
209.8 |
254.3 |
223.6 |
212.9 |
233.6 |
109.7 |
|
Prime cost |
157.4 |
104.5 |
157.5 |
200.8 |
182.2 |
174.2 |
171.2 |
98.3 |
|
Commercial expenses |
5.3 |
7.2 |
9.9 |
12.9 |
13.9 |
14.2 |
13.8 |
97.5 |
|
Management costs |
7.0 |
6.2 |
7.8 |
9.3 |
11.8 |
9.4 |
8.8 |
93.1 |
|
Profit from sales |
73.9 |
25.6 |
34.6 |
31.2 |
15.7 |
15.1 |
39.8 |
264.4 |
|
Interest expenses |
4.7 |
8.8 |
10.8 |
10.3 |
10.9 |
9.2 |
9.0 |
98.2 |
|
Pre-tax profit |
52.8 |
5.8 |
-34.1 |
-1.4 |
16.3 |
9.2 |
-37.7 |
х |
|
ММК |
||||||||
|
Revenue |
226.0 |
137.3 |
201.8 |
247.3 |
243.1 |
225.5 |
266.5 |
118.6 |
|
Prime cost |
160.9 |
101.2 |
164.9 |
211.4 |
203.8 |
195.0 |
205.4 |
105.4 |
|
Commercial expenses |
4.7 |
4.1 |
5.3 |
5.9 |
9.4 |
12.3 |
13.8 |
112.3 |
|
Management costs |
6.7 |
5.5 |
6.1 |
6.6 |
7.5 |
7.2 |
6.6 |
91.0 |
|
Profit from sales |
53.7 |
26.5 |
25.5 |
23.3 |
22.3 |
10.1 |
40.7 |
401.2 |
|
Interest expenses |
1.1 |
1.6 |
2.3 |
3.5 |
4.4 |
3.9 |
4.3 |
110.6 |
|
Pre-tax profit |
15.6 |
34.0 |
29.6 |
-5.2 |
11.4 |
-58.6 |
-1.3 |
2.2 |
|
NLMK |
||||||||
|
Revenue |
202.1 |
128.6 |
179.9 |
221.2 |
240.1 |
225.5 |
262.7 |
116.5 |
|
Prime cost |
115.1 |
94.3 |
130.7 |
174.0 |
205.8 |
199.7 |
200.0 |
100.1 |
|
Commercial expenses |
10.8 |
12.2 |
14.1 |
15.7 |
18.3 |
17.9 |
19.4 |
108.5 |
|
Management costs |
3.7 |
4.6 |
6.2 |
7.0 |
7.9 |
8.5 |
9.9 |
116.1 |
|
Profit from sales |
72.4 |
17.4 |
28.9 |
24.4 |
8.1 |
-0.6 |
33.5 |
х |
|
Interest expenses |
2.0 |
2.1 |
3.2 |
3.7 |
6.3 |
6.35 |
6.4 |
101.4 |
|
Pre-tax profit |
90.2 |
25.8 |
39.0 |
40.8 |
24.2 |
-10.4 |
23.3 |
х |
Sources: data of financial statements of the steel mills; the Federal Treasury; the author’s calculations.
Table 11. Other expenses of CHerMK in 2013–2014, billion rubles
|
Indicators |
2013 |
2014 |
2014 to 2013, % |
|
Other expenses, total |
49.0 |
192.7 |
392.8 |
|
- exchange differences |
11.5 |
63.4 |
551.3 |
|
- costs on dissolution of Severstal US Holdings, LLC and Severstal Investments LLC |
0 |
95.0 |
х |
|
Loss of tax as a result of accounting for the costs on foreign companies dissolution |
0 |
19.0 |
х |
|
- including to the Vologda Oblast budget |
0 |
17.1 |
х |
|
Sources: data of financial statements of PAO Severstal; the author’s calculations. |
|||
Table 12. NLMK Profit estimated, according to different accounting figures in 2014
The unprofitableness of MMK in 2014 was mainly influenced by negative exchange differences, which indicates the poor performance of the company’s management on currency risk management. In addition, the increase in prime cost, commercial and interest expenses resulted in the 12.4 billion ruble decrease in pre-tax profit.
The ISEDT RAS research in the problems of profit tax administration reveals significant gaps in the sphere of tax legislation12. The extremely complex method for profit tax calculation, based on double standards (cost and tax accounting), allows taxpayers, especially the largest, to manipulate the assessment of revenue and expenses when calculating the tax base. In practice, this often leads to the underestimation of assessed profit tax. For example, in 2014 the NLMK profit was optimized to 15.5 billion rubles for the purposes of taxation by using different ways of calculating it. Hence, the Lipetsk Oblast budget missed almost 3 billion rubles of profit tax (tab. 12).
The legitimate use of different schemes to minimize profit tax resulted in the profound drop in its revenue from the largest steel mills. In fact, in 2013–2014, Cherepovets Steel Mill and Magnitogorsk Iron and Steel Works did not pay profit tax to the budget. In 2014 Novolipetsk Steel’s payment to the Lipetsk Oblast budget amounted to 12% of the 2008 level, while the revenue from sales increased by 30% ( tab. 13 ).
The legitimate and large-scale decline of profit tax in the share of sales revenue indicates that the smaller part of taxes was localized at the enterprises for further mobilization to the regional budgets. The
Table 13. Profit tax proceeds from steel mills in 2008–2014
|
Indicators |
2008 |
2009 |
2010 |
2011 |
2012 |
2013 |
2014 |
2014 to 2008, % |
|
CHerMK |
||||||||
|
Revenue, billion rubles |
243.6 |
143.6 |
209.8 |
254.3 |
223.6 |
212.9 |
233.6 |
95.9 |
|
Profit tax, million rubles |
13961.1 |
3851.2 |
4352.9 |
3082.7 |
2280.2 |
0.5 |
0.96 |
0.007 |
|
- to the regional budget |
10191.6 |
3466.1 |
3917.6 |
2774.4 |
2052.2 |
0.46 |
0.8 |
0.008 |
|
To revenue, % |
5.7 |
2.7 |
2.1 |
1.2 |
1.0 |
0.0002 |
0.0004 |
-5.7 p.p. |
|
ММК |
||||||||
|
Revenue, billion rubles |
226.0 |
137.3 |
201.8 |
247.3 |
243.1 |
225.5 |
266.5 |
117.9 |
|
Profit tax, million rubles |
10511.8 |
507.6 |
1488.0 |
1595.0 |
1958.0 |
0 |
143.0 |
1.4 |
|
- to the regional budget |
7673.6 |
456.8 |
1339.2 |
1435.5 |
1762.2 |
0 |
128.7 |
0.002 |
|
To revenue, % |
4.7 |
0.4 |
0.7 |
0.6 |
0.7 |
0 |
0.05 |
-4.7 p.p. |
|
NLMK |
||||||||
|
Revenue, billion rubles |
202.1 |
128.6 |
179.9 |
221.2 |
240.1 |
225.5 |
262.7 |
130.0 |
|
Profit tax, million rubles |
15754.6 |
1284.5 |
5062.9 |
6152.8 |
2729.9 |
0 |
1554.4 |
9.9 |
|
- to the regional budget |
11500.9 |
1156.1 |
4556.6 |
5537.5 |
2456.9 |
0 |
1399.0 |
12.2 |
|
To revenue, % |
7.8 |
1.0 |
2.8 |
2.8 |
1.1 |
0 |
0.6 |
-7.2 p.p. |
|
* Since there are no precise data about paid taxes, the table shows the current profit tax calculated in the statements on profit and loss. Sources: data of financial statements of steel mills; the author’s calculations. |
||||||||
Table 14. Balance of funds from steel mills’ financial activities in 2012–2014, billion rubles
|
Steel mill |
2012 |
2013 |
2014 |
Total for 2012–2014 |
|
CHerMK |
-32.8 |
-43.8 |
-41.3 |
-117.9 |
|
ММК |
-12.9 |
-18.1 |
-4.5 |
-35.5 |
|
NLMK |
-1.5 |
-2.9 |
-37.5 |
-41.9 |
|
Sources: data of financial statements of steel mills; the author’s calculations. |
||||
Table 15. Remuneration of management bodies, state and dividends of owners of metallurgical corporations in 2008–2014
The cash flows withdrawn from Cherepovets Steel Mill and Novolipetsk Steel for the last three years, first, are almost by threefold higher than the annual volume of the Vologda Oblast budget
revenue and, second, equivalent to the annual budget of the Lipetsk Oblast. The tax burden of the metallurgical complex enterprises is not consistent with their profit and incomes of owners and key managers of these enterprises ( tab. 15 ).
According to the table, in 2008–2014 on the background of the decline in tax burden by 1.7–3.7 times the fortune of metallurgical corporations owners increased by 1.4–3 times. Though the contribution to
the budgetary system reduced significantly, the annual remuneration of top managers at PAO Severstal, paid at the expense of the parent enterprise, increased by 13.3 times. The revenues of 10 members of the Severstal Board of Directors exceeded the remuneration of 24 members of the management bodies at OJSC “MMK” and 18 members of the management bodies at OJSC “NLMK” by 5 and 2 times, respectively. The amount of dividends paid to the main owner of Severstal in 2014, draws our attention. The sum was record for the entire study period. Amounting to almost
40 billion rubles, it is almost equivalent to the volume of tax payments to the Vologda Oblast budget in 2014. As Cherepovets Steel Mill reported net losses in 2014, the shareholders should not be rewarded, according to the international practice13. The dividends were paid from retained earnings. In the end, the main investment resource of the enterprise decreased by 3 times – from 98 to 32 billion rubles. No accident that the decline of investment in fixed capital in the Vologda Oblast was the strongest among other Russian regions in the last two years. Moreover, the main owner of Severstal controls it through the Cyprian offshore, applying a lower tax rate (5% instead of 13%), that is why the Vologda Oblast budget lost more than 3 billion rubles of individual income tax in 2014. The withdrawal of financial resources forced the management bodies to take loans. Their volume increased almost by 4 times and provoked the growth of CHerMK corporate debt. At the end of 2014 the loan debt exceeded the total revenue by 24%. Other mills curtailed the attraction of borrowed funds and were characterized by moderate debt (tab. 16).
Aggressive escalation of corporate debt, which was higher than proceeds, and withdrawal of one third of the reserved profits to pay dividends created high risks of financial stability not only for the core asset of Severstal, but also for the economy of the Vologda Oblast in terms of replenishment of budget revenues and investment development. Thus, in 2014 the contradictory between the interests of comprador-oriented large corporations and the interests of regions of presence increased. And if before 2009 the mechanisms to balance these interests could be assessed by the corporation’s contribution to the formation of budget revenues, in recent years this criterion has lost its objectivity.
Summarizing, it can be argued that in 2014 the budget problems of regional development were not resolved, but, on the contrary, worsened. First, the large-scale optimization, selected as the method to reduce the debt load of regions and covered investment and social expenses, has not achieved its goal. The process to increase government debt has continued in regions, already characterized by a high level of debt, increasingly affects the regions, previously having minimal obligations. Second, the increased distortion in the structure of
Table 16. Debt of steel mills in 2013–2014, billion rubles
Violating the fundamental principle of budgetary policy – the principle of balanced budgets at all levels – in the critical conditions of 2014 the Russian authorities continued to shift the burden of social spending from the federal to regional budgets, did not expand the revenue base, leaving the regions on the brink of survival. The anti-crisis plan, developed by the RF Government, is characterized by the clear dominance of support for banks over support for the real sector of economy and regional budgets.
The analysis of the budgets in the Vologda Oblast, the Lipetsk Oblast and the Chelyabinsk Oblast shows a lack of tools to use key resources of the territories in the state management system. As a result the regional authorities, having no legislative levers to regulate the activities of big business, gradually are failing to implement the strategic plans of economic development and solving primarily the social problems within
the budget allocation . Paradoxically, the regions having high-yield companies on their territories become beneficiary due to the inefficient budgetary policy. Most Russian regions require a unified system of management of industry and investment potential. Without this the economic activity will focus only on servicing the current budget deficit to the detriment of the strategic development priorities.
Developing the draft federal budget for 2016, the government structures reproduce the ideology of the budget policy for 2015, based on the sequestration of all costs. The new draft budget stipulates the by 13% costs reduction. Without structural reforms it can entail serious risks for socio-economic stability. In this situation there is little hope for the solution to budgetary problems of the regions.
In our opinion, for the initial stabilization of regional funds the Russian Government should: restructure debt on the loans issued from the federal budget; transform debt financing of the sub-federal budgets to predominantly transfer; radically change the administration of large taxpayers’ profit. Refusing to change the essence of the budget policy and emptying the regional budgets, the Government demonstrates its inability to guarantee a decent living standard f for Russian citizens and provokes deepening socio-economic problems, fraught with political instability.
References Passive behavior of the government. Budget problems are aggravating in the regions
- Vysshaya shkola ekonomiki: 20 rossiiskikh regionov fakticheski v defolte . Available at: http://www.finmarket.ru/news/4015638
- Ilyin V.A., Povarova A.I., Sychev M.F. Vliyanie interesov sobstvennikov metallurgicheskikh korporatsii na sotsial’no-ekonomicheskoe razvitie . Vologda: ISERT RAN, 2012. 102 p.
- Ilyin V.A., Povarova A.I. Problemy gosudarstvennogo upravleniya . Vologda: ISERT RAN, 2014. 181 p.
- Ofitsial’nyi sait OAO “Magnitogorskii metallurgicheskii kombinat” . Available at http://www.mmk.ru/
- Ofitsial’nyi sait OAO “Novolipetskii metallurgicheskii kombinat” . Available at: http://www.lipetsk.nlmk.ru/
- Ofitsial’nyi sait PAO “Severstal” . Available at: http://www.severstal.ru/
- Povarova A.I. Snizhenie fiskal’noi funktsii naloga na pribyl’: faktory i puti povysheniya Ekonomicheskie i sotsial’nye peremeny: fakty, tendentsii, prognoz , 2014, no. 3, pp. 180-195 DOI: 10.15838/esc/2014.3.33.14
- Sokrashchenie zarplat pomozhet vypolnit’ maiskie ukazy Prezidenta . Nezavisimaya gazeta , 2015, March 12.
- Ershov M., Tanasova A., Tatuzov V., Lupandina O. Finansovaya sfera: o nekotorykh sobytiyakh i itogakh 2014 goda . Rossiiskii ekonomicheskii zhurnal , 2015, no.1, pp. 100-109.
- Doklad zamestitelya Gubernatora oblasti A.V. Kozhevnikova na publichnykh slushaniyakh po godovomu otchetu ob ispolnenii oblastnogo byudzheta za 2014 god . Available at: http://www.vologdazso.ru/analitic/219029/
