Path Loss Analysis of ZigBee for Smart Meter Network Deployment in NAN

Author: Sehan Samarakoon, Maheshi B Dissanayake, Kithsiri M Liyanage, Sudheera Navaratne, Chirantha Jayasinghe, Prabhath Illangakoon
Journal: International Journal of Computer Network and Information Security @ijcnis
Article in issue: 5 vol.16, 2024.
Free access
A fundamental and vital aspect of Smart Metering infrastructure is the communication technologies and techniques associated with it, especially between the Smart Meters and the Data Concentrator Unit. Among many available communication technologies, ZigBee provides a low-cost, low-power, and easy-to-deploy network solution for a Smart Meter network. There exists limited literature that discusses ZigBee as a potential communication technology for long-range networks. Hence thorough analysis is demanded on the suitability of ZigBee for smart meter deployment under different types of environmental conditions, coverage ranges, and obstacles. This work evaluates the performance of an extended ZigBee module in outdoor as well as indoor conditions in the presence of different types of obstacles. Parameters are obtained for path loss exponent and the standard deviation of the Gaussian Random variable to validate the Log Normal Shadowing model for modeling long-range ZigBee communication. The impact of obstacles on path loss is also considered. The results show that the Log Normal Shadowing model is a good approximation for the behavior of ZigBee path loss. Accordingly, the suitability of ZigBee for a Smart Meter network spanned as a Neighborhood Area Network is also assessed based on the approximated model.
NAN, Path Loss, Shadowing, Smart Metering, Zigbee
Short address: https://sciup.org/15019475
IDR: 15019475 | DOI: 10.5815/ijcnis.2024.05.07
Text of the scientific article Path Loss Analysis of ZigBee for Smart Meter Network Deployment in NAN
Smart Metering and their communication have long been a developing research area with extensive implementations worldwide. Choosing the appropriate communication platform from the available technologies to develop the communication infrastructure, depends on factors such as the area of coverage, cost of implementation, available bandwidth, power consumption, reliability, and the security of the smart system. In its architecture, a typical Smart Meter network comprise a Home Area Network (HAN), a Neighborhood Area Network (NAN), and a Wide Area Network (WAN) [1]. The HAN manages the data communication inside the premises of the local customer by connecting different energy sources and sinks, while the meter data at each premise is sent to the Data Concentrator Unit (DCU) over a NAN [1]. The WAN acts as the backhaul network for the transmissions from the DCU to the utility.
To satisfy different communication needs at these networks, several technologies both wired and wireless are already in use. ZigBee is one such technology popularly used in Wireless Sensor Networks (WSN) due to its low cost, low power consumption, and the absence of complex infrastructure which makes it easy to deploy [2]. It is also a technology that is being defined for use in Wireless Personal Area Networks (WPAN) where the range of communication is minimal [3]. In the context of Smart meter networks, ZigBee is the technology of choice for Smart Meter HAN and it is widely used for home automation and building automation purposes where measurement data from electrical appliances are transmitted to controllers within the same premises and vice-versa [4].
The general Smart Meter NAN requires the meter data to be transmitted from Smart Meters at customer premises to a DCU which could be located far away from the meters (e.g. at the location of a transformer) [5]. This demands the Smart Meter NAN to facilitate reliable communication over considerably longer distances either directly or through mesh networks. Hence, the communication technology utilized in Smart Meter NAN should have the capacity to handle frequent bursts of traffic while providing the necessary coverage or range over considerably longer distances [6].
Although, ZigBee is not initially designed for long-range applications, recent developments, especially in relation to the extension of the range of ZigBee devices have made this application feasible. The availability of these ZigBee long-range devices in the present market, and the possibility of easily relaying data through mesh networks spanned using ZigBee, has made it a strong potential contender for data transmission between Smart Meters and the DCU over NAN.
As ZigBee is a quite popular choice in WSNs, there exists ample literature that analyzes the path loss characteristics and behavior of ZigBee for short ranges mostly inside buildings and industrial indoor environments. However, results and analysis with regards to the application of ZigBee in the context of communication for Smart Meters in a NAN, especially in outdoor settings are scarce in the literature. Although the applicability of the Log Normal Shadowing model to define the path loss characteristics of ZigBee propagation has already been proposed, the recent advancements in the range of ZigBee require further analysis on how the characteristics would behave at much larger distances.
2. Literature Review
The communication technology used for a Smart Meter network must possess the characteristics of high reliability and high security while operating in different geographic and environmental settings of the Smart Grid [7]. Key basic parameters to consider when selecting a communication technology are its coverage range, behavior under environmental obstacles, and varying environmental conditions. The performance and path loss characteristics of ZigBee communication are analyzed in various literature. In most of these studies, ZigBee devices are deployed in compact indoor environments. In outdoor cases, the analysis is limited to very short distances.
According to [8], X-Bee modules, which utilize ZigBee, are able to support ranges up to 25m and 60m in indoor and outdoor conditions respectively. The performance of ZigBee in indoor environments with hard or soft partitioning and the impact of floor separations on the signal strength was studied in [9]. In [10], it is shown that the log normal distance model is best suited to characterize the path loss in outdoor WSNs environments. Here, the authors analyze experimental results collected up to 50m distances. A comparison of variation of RSSI in an electrical substation environment with strong electromagnetic radiations against an open space is presented in [11]. The results show that it is challenging for the signal to achieve at least half the distance covered under open space when electromagnetic radiation influence is present. An empirical path loss model based on a logarithmic model is also presented for the two scenarios. The path loss and performance of a ZigBee-based WSN used to monitor and prevent the frequent occurrence of landslides are evaluated in [12]. After studying the path loss characteristics of this particular network up to around 25m, it has been concluded that the Log Normal Shadowing model provides the lowest Root Mean Square Error (RMSE) among other popular models.
According to the literature, logarithmic models, in particular the Log Normal Shadowing model, are a popular choice for path loss modeling in WSN [13]. Yet, the literature doesn’t provide significant context and insight into utilizing ZigBee for Smart Meter NANs, which span considerably longer distances. A typical Smart Meter network requires data to be relayed between Smart Meters at neighboring premises to finally reach their destination at DCU. This requires ZigBee nodes to achieve much greater transmission ranges than the sensor nodes in a typical WSN studied in the previous works. Also, the separation distance between residential homes or apartment buildings randomly varies subject to the layout of the housing scheme and the population density in that particular area. For instance, in a rural area, Smart Meters may have to be placed far apart than in a Sub-Urban or Urban setting. Hence, it is necessary to investigate the ability of ZigBee to cater to these different environments as well, before the deployment of the Smart Meter NANs with ZigBee technology. In this context, ZigBee based Smart Meter networks demand a well-defined model to predict the path loss before fully deploying a network. Moreover, it would eventually help the utility provider to identify the number of DCUs necessary to deploy a functioning NAN and the optimum locations for the placement of these DCUs. Therefore, the path loss characteristics and modeling of the ZigBee communication technology under the environmental variables of Smart Meter NAN is significant in network planning.
-
2.1. Log Normal Shadowing
The work carried out in most of the literature shows that the Path Loss characteristics of ZigBee closely follow the Log Normal Shadowing model for shorter distances. However, the model needs to be verified for longer distances as the interference, multipath fading, and scattering effects can have a huge impact on the overall characteristics of the path loss. According to [14], the Log Normal Shadowing model is defined as follows.
PL ( d ) = PL ( d 0 ) + 10 nlog 1o I d |+ X . (1)
I dо J where,
PL ( d ) = Path Loss at a distance of d
PL ( d 0 ) = Path Loss at a distance of d 0
d = Distance from the transmitter
d0 = 1m
n = Path Loss Exponent
2.2. Test Setup
In our experimental setup, tests were carried out in different environmental conditions to verify the path loss exponent values of the Log Normal Shadowing model. In the test setup, the performance of the communication network and its coverage is evaluated by determining the attenuation of the signals with increasing distance. The Received Signal Strength Indicator (RSSI) value was used to estimate the signal strength at each location. RSSI was measured by having a Texas Instruments CC2531 ZigBee USB Dongle as the receiver while a CC2530 PA2 module was used as the transmitter. Each device was kept at a height of 1m from the ground. Both devices were powered through laptop computers and the RSSI values were obtained through the TI Packet Sniffer software. Data was transmitted at 3 dBm and the receiver sensitivity was at -96 dBm.
3. Line of Sight (LOS) Indoor and Outdoor Analysis
X σ = Gaussian Random Variable with Standard Deviation σ
In eq. 1, the path loss exponent is a representation of the surrounding environment, while the Gaussian random variable represents the randomness involved as a result of multipath fading components, scattering effects, and interferences. In logarithmic models, a standard general set of values has been defined for path loss exponent value under different surrounding environments [15]. These path loss values for selected environmental settings are tabulated in Table 1.
Table 1. Path Loss values defined for different environments [15]
|
Environment |
Path Loss Exponent (n) |
|
Free Space |
2 |
|
Urban area Cellular / PCS |
2.7 to 4.0 |
|
Shadowed Urban Cellular / PCS |
3 to 5 |
|
In building LOS |
1.6 to 1.8 |
|
Obstructed in building |
4 to 6 |
|
Obstructed in factories |
2 to 3 |
The above values are typical path loss exponents defined for mobile radio environments and therefore need to be verified for long range ZigBee in particular with thorough testing [15]. Therefore, this work presents an analysis of the path loss of ZigBee for longer distances and the validity of the Log Normal Shadowing model for such instances. Also, the behavior of signals under different types of obstacles is an important aspect in determining the performance of a Smart Meter network. Walls, windows, and buildings are common obstructions present between two communicating Smart Meters. Therefore, the impact of these obstacles on the signal strength is also studied in this work.
During the data collection, repeated 8 RSSI measurements were collected for each Transmitter-Receiver (T-R) separation due to the highly varying nature of the RSSI. Also, the data collection was carried out at 5 different instances of time (5 different time stamps per each T-R separation) to counteract the impact made by different atmospheric and environmental conditions.
As of literature, there exists little research on modeling Zigbee NANs, especially for long range smart meter network settings. Yet, at the deployment stage of such networks, it is essential to simulate the network node placement and the DCU connections. An extensive literature survey suggested that Log Normal Shadowing has high potential to model the behavior of the ZigBee connected network [16]. Hence, in this research, we test the hypothesis of utilizing Log Normal Shadowing for modeling the Smart meter network with long range ZigBee using experimental data. For this purpose, we analyze the performance of the designed communication module of the Smart meter in Outdoor Open Space, mimicking the free space transmission as well as closed space non-line of Sight (NLOS) communications.
-
3.1. LOS Outdoor
A large open area with minimum interference was selected to measure the performance of the ZigBee Smart Meter in the free space. The transmitter and the receiver are both kept in LOS to each other, and the separation distance is varied by moving the receiver away from the transmitter for each set of samples.
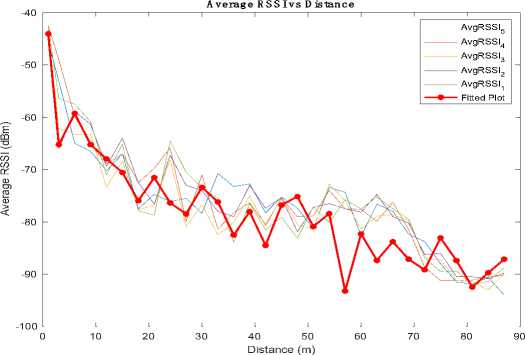
Fig.1. Average RSSI against distance for LOS outdoor condition
Table 2. Path loss exponent values at 5-time instances under LOS outdoor conditions
|
Time instances |
Path Loss Exponent (n) |
|
1 |
2.242036367 |
|
2 |
2.148715341 |
|
3 |
2.246982113 |
|
4 |
2.236173729 |
|
5 |
2.057147962 |
|
Free Space [15] |
2 |
The open area was selected such that the multipath scenario is highly unlikely to occur. I.e. the presence of reflecting surfaces such as buildings, walls, and trees were avoided at all cost. Yet, the multipath components from ground reflections and scattering cannot be completely excluded. As seen from Figure 1, the RSSI values obtained at 5 repeated observation instances of time, ( RSSI 1 to RSSI 5 ), closely follow each other with slight fluctuations among each observation.
These slight fluctuations can be attributed to the varying nature of the wireless channel over time. For instance, the changes in propagation paths, scattering effects, and environmental conditions contribute to these minor fluctuations in the channel conditions over time. The least-square fits obtained for the data were closest to a logarithmic decrease and hence the data was approximated to the Log Normal Shadowing model which takes into account both the Shadowing effects as well as the randomness involved with multipath components.
In the Log Normal Shadowing model, the value of path loss exponent (n) determines the amount of Large-Scale fading or Shadowing effects that the channel undergoes. A lower value for this suggests a better reception of the signal at the receiver. The value of path loss exponents for the observed 5 occasions were calculated using eq. 2.
P t - P r ( d ) = P t - P r ( d 0 ) + 10 nlog 10 I d I + X .
I d 0 J
P r ( d ) = P r ( d 0 ) — 10 nlOg 10 I d | + X ^ l d 0 J
In eq. 3, the Gaussian random variable contributes directly to the variations in received signal power due to smallscale fading and multipath effects. For the calculation of path loss exponent (n), the effect of the randomness due to the Gaussian random variable is initially ignored as can be seen in eq. 4. Note that the value of RSSI at reference distance ( d 0 ), P R ( d 0 ), is fixed for all data samples with d 0 = 1m.
n =
P r ( d 0 ) — P r ( d )
10 nlog 10

According to the theoretical data available for the Log Normal Shadowing model (Table 1), the value of the path loss exponent is defined as n = 2 for free space [15]. As of the experimental observations above, the value of n varied in the range of 2.05 to 2.24 for the 5 test cases (i.e. an average of 2.17 with an 8.5% deviation from theoretical value) as shown in Table 2. This leads to the inference that the experimental results of the smart meter network closely follow the theoretical model of Log Normal Shadowing.
Table 3. Standard deviation values at 5-time instances under LOS outdoor conditions
|
Time instances |
Standard deviation ( ) |
|
1 |
4.61483525 |
|
2 |
4.38933733 |
|
3 |
4.59757103 |
|
4 |
4.21968939 |
|
5 |
4.43759390 |
The actual received power values at different Transmitter-Receiver separation distances do not exhibit an ideal log curve. Instead, some fluctuations can be seen both in Figure 1 and Figure 2, due to multipath propagation. These deviations from the ideal log curve are represented as a Gaussian random variable of zero mean in the log normal shadowing model. The standard deviation of this RSSI fluctuations in free space can be determined using eq. 5.
<7 =
£ n^ P a — P e ) 2 k
where P A is the actual received power, P E is the estimated value from the log curve and n is the total number of readings. Table 3 tabulates the calculated standard deviation, for all 5 data samples, and it showed an average value of 4.45.
Considering the experimental results and observations, the eq. 3 can be modified for the specific smart meter application environment with path loss exponent ( n ) and standard deviation ( σ ) set to 2.1862 and 4.4518 respectively. Hence, the relationship between the received power (P R ) and distance (d) for the outdoor experiment with LOS can be expressed as in eq. 6. The curve fitted in Fig. 1 represents the behavior of the tested simulation environment plotted using the received power values obtained from eq. 6.
P r ( d) = P r ( d 0 ) - 10*2.1862 log 10 1 d I - X 4 4518 I d 0 J
-
3.2. LOS Inside a Building (Along a Hallway)
At the deployment of smart meter networks, some of the NANs will be deployed inside buildings, such as in apartment complexes. For that reason, we investigate the behavior of smart meter NANs in indoor environments, especially when connectivity is established through narrow passages or pathways. The performance of ZigBee technology in an indoor smart meter network was also assessed by placing the transmitter and receiver in LOS in an indoor environment with minimum occlusions. RSSI data samples were collected up to a separation gap of 111 m between the transmitter and receiver. It is noteworthy that error-free communication can be achieved in an indoor environment with the same setup up to 300 m. Figure 2 shows the variation of received power values with separation distance for 5 different observation instances of an indoor environment.
In contrast to outdoor free space communication, it was observed that ZigBee is capable of spanning a network with a larger coverage area in closed space settings such as hallways and indoor environments. This is due to the fact that in an indoor setting, the tunnel-like environment created by walls and floors tends to act as a waveguide and aid the transmission [17]. This resulted in a significant component of the signal being directed towards the receiver than in the outdoor setting. As a result, an increase in the accumulated strength of the signal can be observed.
A close comparison of the 5 sample instances shown in Fig. 2 displayed no significant fluctuation in the observed readings at 5 different time instances. The variation of RSSI against distance in general, behaved as a logarithmic decay similar to that of the outdoor free space model. However, it could be seen that the decay was slower than in the outdoor scenario. The path loss exponent, n , for this environment, is also calculated using eq. 3 and tabulated in Table 4. According to the literature, the path loss exponent takes a value in the range of 1 . 6 to 1 . 8 for indoor LOS environments [15]. The calculated values presented in Table 4 agree with this definition, since an average value of 1.79 was observed for n . This further validates the choice to model the path loss characteristics of the smart meter network with ZigBee using the Log Normal Shadowing model.
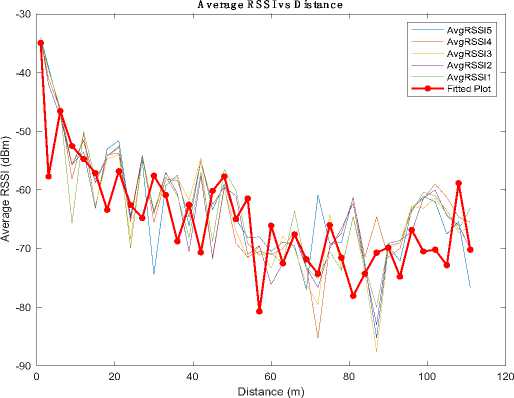
Fig.2. Average RSSI against distance for LOS indoor conditions
Table 4. Path loss values at 5 instances under LOS indoor conditions
|
Time instances |
Path Loss Exponent (n) |
|
1 |
1.799417232 |
|
2 |
1.828194382 |
|
3 |
1.783131663 |
|
4 |
1.765087978 |
|
5 |
1.809879976 |
|
In building LOS [15] |
1.6 – 1.8 |
Table 5. Standard deviation at 5-time instances under LOS Indoor condition s
|
Time instances |
Path Loss Exponent (n) |
|
1 |
5.9900973 |
|
2 |
5.5398216 |
|
3 |
6.1629046 |
|
4 |
5.82951954 |
|
5 |
5.86726298 |
Inherently the indoor environment would experience heavy multipath fading. This is evident from the Fig 2. To quantify the multipath effect, the standard deviation of the indoor RSSI observations is calculated using eq. 5 and tabulated in Table 5. As of Table 5, the standard deviation close to 6 exists for the observed indoor environment. This implies that the signal strength has varied significantly at the receiver in indoor measurements compared to outdoor measurements. As of Tables 4 and 5, average values for the path loss exponent ( n ) and standard deviation ( σ ) for the indoor LOS scenario are 1.7971 and 5.8779 respectively. Hence, the relationship between the received power ( P R ) and distance ( d ) for indoor smart meter network with ZigBeecan be expressed as,
P r ( d ) = P r ( d 0 ) - 10 *1.7971 log 10 1 d |- X 5, 779
I d 0 J
The values obtained from eq. 7 is plotted against the distance in Fig. 2 to represent the fitted values. Table 6 tabulates the average values of both path loss exponent and standard deviation obtained for LOS environments.
Table 6. Average values of path loss exponent and standard deviation for outdoor (free space) and indoor scenarios
|
Location |
Path Loss Exponent (n) |
Standard Deviation |
|
Free Space experimental |
2.1862 |
4.4518 |
|
Free Space theoretical [15] |
2.00 |
Not Defined |
|
LOS Indoor experimental |
1.7971 |
5.8779 |
|
LOS Indoor theoretical [15] |
1.6 to 1.8 |
Not Defined |
4. NLOS Performance Analysis: Performance with Obstructions
The walls, trees, buildings, and other obstructions present in an environment significantly affect any outdoor communication network. When analyzing an outdoor Smart Meter network, the impact of these obstructions and occlusions are extremely important aspects, which could affect the performance of the path loss propagation. Therefore, the performance or attenuation of ZigBee signals under different NLOS configurations and obstructions needs to be carefully analyzed to obtain an accurate prediction model. For this purpose, non-line of sight (NLOS) communication under different types of obstacles at different placements was simulated for the ZigBee-based smart meter network. The RSSI data under occlusion were collected similarly to that of LOS data, with 8 repeated readings at each time instant at each transmitter-receiver separation distance. The data collection process was repeated for 5 different time instances spread out throughout the day to add sufficient randomness to the collected data.
-
4.1. Performance under Obstructions of a Glass Window
-
4.2. Performance under Obstructions of a Wall
In order to determine the impact of a glass window on the path loss, a receiver and a transmitter were placed at a 1m distance on either side of the window as shown in Fig. 3.
Table 7. RSSI values obtained through a glass window
|
Test |
Window (dBm) |
Free Space (dBm) |
|
1 |
-45.5 |
-47.875 |
|
2 |
-47.375 |
-46 |
|
3 |
-45.625 |
-45 |
|
4 |
-49 |
-44.125 |
|
5 |
-49 |
-45 |
|
Average |
-47.3 |
-45.6 |
The received signal values tabulated in Table 7 show that there is an extra attenuation of approximately 2dBm due to the presence of the glass window when compared with the free space.
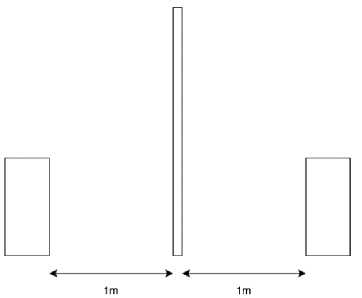
Fig.3. Test configuration for window placement and wall placement
The experiment was repeated using the same configuration as in Section 4.1 but having a wall instead of the window, to determine the impact of the cement wall on propagation loss. The observations are tabulated in Table 8.
Table 8. RSSI values obtained through a wall
|
Test |
Window (dBm) |
Free Space (dBm) |
|
1 |
-49 |
-49 |
|
2 |
-47.875 |
-48.625 |
|
3 |
-50 |
-49 |
|
4 |
-51.5 |
-50.25 |
|
5 |
-49.875 |
-50.25 |
|
Average |
-49.875 |
-49.325 |
As of Table 8, a drop of only around 0.55dBm was observed in this particular case. This suggests that the attenuation caused by the presence of glass as an obstruction is higher than that of a wall.
-
4.3. Performance under Obstruction of an L-shaped Wall (Partial Occlusion)
-
4.4. Performance under Full Occlusion
In another test setup, the receiver and the transmitter were placed at a 90-degree angle, occluded by an L-shaped wall as presented in Fig 4. The results obtained are tabulated in Table 9. In this experiment, the RSSI values were observed with the transmitter and receiver in NLOS with a 1.5 m separation distance. In this instance, the amount of path loss experienced by the receiver has increased further in comparison to the previous cases as presented in Tables 7 and 8.
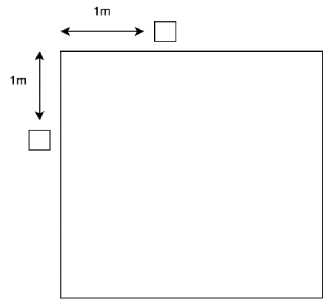
Fig.4. Test configuration for NLOS transmission through an L shaped wall
Finally, the experiment was repeated for a scenario when complete blockage between transmitter and receiver was present as in Fig. 5. In this particular scenario the transmitter and receiver were separated by a tall building with an 18 m separation distance. Hence, the line-of-sight communication is completely obstructed in this setting. This test shows that the transmissions could still take place with a complete blockage, although a much higher attenuation is observed. It is observed that, in the previous three scenarios, the presence of a wall, glass window, and L-shaped wall, the attenuation in the signal strength observed was insignificant.
Table 9. RSSI values through L shaped wall
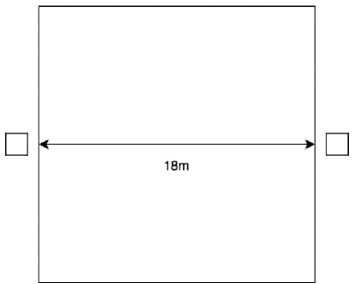
Fig.5. Test configuration for NLOS transmission due to a complete blockage
|
Test |
L Shaped Wall (dBm) |
|
1 |
-50.25 |
|
2 |
-49.625 |
|
3 |
-51.5 |
|
4 |
-51.5 |
|
5 |
-52.375 |
|
Average |
-51.05 |
However, the presence of the thicker walls, buildings, and other obstructions within the 18m separation distance has resulted in a significant attenuation as in Table 10. In free space transmission, a received signal strength of around -70dBm was observed at a distance of 18m. This means an extra attenuation of approximately 24dBm was caused by the complete blockage due to the tall building. The path loss exponent for this case can be determined as in eq 8, 9, and 10.
Table 10. RSSI values through a complete blockage
P r ( d ) = P r ( d 0 ) - 10 log 10

- 94.3 = - 43.45 - 10 nlogi0

- 43.45 + 94.3 10 log 10 (18)
= 4.0509
|
Test |
Complete Blockage as in Fig. 10 (dBm) |
|
1 |
-91.75 |
|
2 |
-95.625 |
|
3 |
-95.125 |
|
4 |
-94 |
|
5 |
-95 |
|
Average |
-94.3 |
A path loss exponent value of 4 for full obstruction, suggests a rapid logarithmic decay than other cases tested. It should be noted that usually path loss values in this range are defined for urban areas. Hence, the relationship between the received power ( P R ) and distance ( d ) for NLOS smart meter network with ZigBee can be modeled using eq. 8 with n set to 4.
5. Discussion
This work was carried out to determine the suitability of the Log Normal Shadowing model to characterize the ZigBee path loss for considerably longer distances which will help in assessing the applicability of ZigBee for Smart Meter NAN. As of the literature, the Log Normal Shadowing model is a very common model that is being used to model the ZigBee path loss in HAN. Yet, these past works have considered much shorter distances than the distance required for a typical Smart Meter NAN environment. As signals tend to get affected by different phenomena along their path, it is important to define the accurate path loss model along with the specific values of the path loss exponent that best represents the signal loss. Further, the lack of context to Smart Meter networks in terms of navigating the connections around obstacles in previous studies has also been addressed in this work by considering some of the common obstacles expected in a Smart Meter network.
For this purpose, this research evaluates the path loss performance of smart meter connections, under different LOS and NLOS environments. Also, it calculates the path loss exponent (n) and presents a fine-tuned path loss expression (model) for each LOS scenario. Specifically, it was observed that the outdoor smart meter network with extended ZigBee communication can be modeled as a Log Normal Shadowing model with a path loss exponent of 2.18 and a standard deviation of 4.45, while the indoor smart meter network can also be modeled as a Log Normal Shadowing model with the path loss exponent of 1.8 and the standard deviation of 5.88. The presented model was able to achieve a close approximation of the actual deployment.
The impact of heavy obstructions on signal attenuation is also emphasized in this research. We have used commonly expected obstructions in a Smart Meter NAN to show their severe impact on the signal power received at the receiver. It was observed that the obstructions and occlusions resulted in a reduction of signal power and an increase in the path loss exponent (n).
On a different note, the separation distance between two neighboring meters defines the span of a smart meter network as well as the requirement for repeaters. In a rural area, the houses are separated by a significant distance. Hence to maintain effective communication between meters, repeaters need to be added to the network to perform sufficient signal amplification. Yet, in urban settings, the houses, buildings, and other properties are situated closer to each other. Hence, smart meters can easily span a network with a relatively smaller separation distance between two meters. Also, the ability to relay messages through different routes in a mesh network may reduce the impact, provided that there is an alternative path through an alternative neighboring meter. Moreover, the coverage range of a smart meter network can be further improved through enhanced receiver sensitivity approaches.
Overall, in the Smart Meter networking context, the results and observations show that ZigBee has a good potential to be considered as the communication technology to manage the connection between Smart Meters and DCU. Hence, we believe that this work would give fellow researchers as well as the industry to look at ZigBee as a viable solution for Smart Meter NANs as well as shift from their mindset that it is a low-range communication technology. The work presented, also provides a basis for network planners to plan their networks, especially an initial modeling framework for initial testing purposes.
6. Conclusions
In conclusion, this study has delved into the realm of ZigBee technology, focusing on its extended range capabilities, and assessed its applicability in Smart Meter networks within diverse environmental settings. Our findings suggest that ZigBee technology, with its extended communication range, holds significant promise for use in Smart Meter Neighborhood Area Networks (NANs) in urban and suburban environments. In scenarios where Smart Meters are densely deployed and situated in close proximity, ZigBee's ability to convey messages to Data Collection Units (DCUs) proves highly efficient and cost-effective. However, it is essential to acknowledge that the presence of buildings and urban structures can introduce higher attenuation levels, potentially limiting the range of ZigBee communication. Hence, careful consideration must be given to the placement of Smart Meters within these environments to ensure optimal signal propagation.
Furthermore, our analysis also indicates that the application of ZigBee technology in rural settings can be viable, particularly when devices have a clear Line of Sight (LOS) and minimal obstructions are present. In such conditions, ZigBee's extended range capabilities offer a cost-effective solution for extending Smart Metering services to remote and underserved areas too. In summary, our study confirms the versatility of ZigBee technology in catering to the diverse needs of Smart Meter networks across varying landscapes. While its effectiveness in urban and suburban settings is evident, its application in rural conditions remains a possibility with careful planning. Future research can explore strategies to mitigate attenuation caused by buildings and improve the adaptability of ZigBee in challenging urban environments, further advancing the integration of this technology into Smart Metering infrastructure.
In the future, the authors are planning to conduct further research to assess the performance of the Log Normal Shadowing model for modeling the Smart Meter networks under multiple obstacles as well as different types of materials. Also, further analysis will be carried out in the future to determine the suitability of ZigBee in different environmental and terrain conditions to establish Smart Meter networks. For this purpose, the researchers will be deploying prototype smart meter networks in Urban, Suburban, and Rural environments. The collected field data of these deployed networks will be utilized to derive advanced models and parameters for modeling Smart Meter networks. Moreover, further studies could delve into the development of predictive models for optimizing Smart Meter placement in urban and suburban landscapes, considering factors such as building density and materials.
Acknowledgment
References Path Loss Analysis of ZigBee for Smart Meter Network Deployment in NAN
- T. Gupta and R. Bhatia, "Communication technologies in smart grid at different network layers: An overview.," in International Conference on Intelligent Engineering and Management (ICIEM), 2020.
- F. Zhang, W. Jiang, Q. Lin and H. Wu, "ZigBee-based wireless sensor network for environment monitoring ZigBee," Sensors & Transducers, vol. 237(9/10), pp.144-149, 2019.
- D. Baimel, S. Tapuchi and N. Baimel, "Smart grid communication technologies," Journal of Power and Energy Engineering, vol. 4(08), pp.1, 2016.
- R. Das and J. Bera, "ZigBee based small-world home area networking for decentralized monitoring and control of smart appliances," in 5th International Conference on Smart Grid and Smart Cities (ICSGSC), 2021.
- M. Lisowski, R. Masnicki and J. Mindykowski, "PLC-enabled low voltage distribution network topology monitoring," IEEE Transactions on Smart Grid, vol. 10(6), pp.6436-6448, 2019.
- M. Khazaei, L. Stankovic and V. Stankovic, "Trends and challenges in smart metering analytics," in 2019 MTMI International Conference on Emerging Issues in Business, Technology and Applied Sciences. pp.111-117, 2019
- F. Abrahamsen, Y. Ai and M. Cheffena, "Communication technologies for smart grid: A comprehensive survey," Sensors, vol. 21(23), p. p.8087, 2021.
- I. Kuzminykh, A. Snihurov and A. Carlsson, "Testing of communication range in ZigBee technology," in 14th International Conference the Experience of Designing and Application of CAD Systems in Microelectronics (CADSM), 2017.
- D. Sucie, "A study of RF link and coverage in ZigBee," Scientific Bulletin of the” Petru Maior”University of Târgu Mureş, Vol.7 (XXIV), no.1, pp. 5-10, 2010.
- A. Payal, C. Rai and B. Reddy, "Experimental analysis of some radio propagation models for smart wireless sensor networks applications," in SAI Intelligent Systems Conference (IntelliSys), 2015.
- Z. Chen, X. Fu, Y. Kong and D. Han, "Study on path loss of ZigBee signal in electrical substation environment," in International Conference on Cyberspace Technology (CCT 2014), 2014.
- M. Liang, C. Li, J. Wang and L. Li, "Power Loss Analysis of Zigbee Propagation Models on the Landslide of Heifang platform," in 6th International Conference on Information Engineering for Mechanics and Materials, 2016.
- S. Kurt and B. Tavli, "Path-Loss Modeling for Wireless Sensor Networks: A review of models and comparative evaluations," IEEE Antennas and Propagation Magazine, vol. vol. 59, no. no 1, pp. 18-37, Feb. 2017.
- S. Choudhary and D. Dhaka, "Path loss prediction models for wireless communication channels and its comparative analysis," International Journal of Engineering, Management & Sciences, vol. 2(3), pp.38-43, March 2015.
- A. Okumbor and O. Okonwo, "Empirical model of cellular signal propagation loss for smart grid environment," International Journal of Smart Grid and Clean Energy, vol. 5(4), pp.272-279, 2016.
- S. L. Mohammed, "Distance Estimation Based on RSSI and Log-Normal Shadowing Models for ZigBee Wireless Sensor Network," Engineering and Technology Journal, vol. 34, no. 15A, pp. 2950-2959, 2016.
- C. Rizzo, F. Lera and J. Villaroel, "3-D fadings structure analysis in straight tunnels toward communication, localization, and navigation," IEEE Transactions on Antennas and Propagation, vol. 67(9), pp.6123-6137, 2019.
