Pavement Crack Detection Using Spectral Clustering Method

Author: Jin Huazhong, Ye Zhiwei, Su Jun
Journal: International Journal of Image, Graphics and Signal Processing(IJIGSP) @ijigsp
Article in issue: 2 vol.7, 2015.
Free access
Pavement crack detection plays an important role in pavement maintaining and management, nowadays, which could be performed through remote image analysis. Thus, edges of pavement crack should be extracted in advance; in general, traditional edge detection methods don’t consider phase information and the spatial relationship between the adjacent image areas to extract the edges. To overcome the deficiency of the traditional approaches, this paper proposes a pavement crack detection algorithm based on spectral clustering method. Firstly, a measure of similarity between pairs of pixels is taken into account through orientation energy. Then, spatial relationship is needed to find regions where similarity between pixels in a given region is high and similarity between pixels in different regions is low. After that, crack edge detection is completed with spectral clustering method. The presented method has been run on some real life images of pavement crack, experimental results display that the crack detection method of this paper could obtain ideal result.
Crack detection, Spectral clustering, Phase information, Spatial relations, Oriented energy model
Short address: https://sciup.org/15013529
IDR: 15013529
Text of the scientific article Pavement Crack Detection Using Spectral Clustering Method
The crack is one of the commonest diseases of pavement, which not only damages the pavement appearance and driving comfort, but will also easily develop to structural damage and shorten the lifespan of the pavement unless timely detected and repaired. Traditional manual methods are getting inapplicable due to many limitations such as intensive workload and insecurity, the image-based crack recognition method. Nowadays, along with the progress of high-speed cameras and computer technology digital image analysis gradually becomes the common way for pavement crack detection. Though a variety of crack recognition approaches have been proposed in the last two decades, most of them cannot be applied in practice owing to the fact that they do not meet the requirements of the commercial image-based software. Therefore, the exploration of a robust and reliable detection approach for pavement crack is of great significance [1].
Since the 21st century, the pavement crack detection research based on 2D image analysis has attracted more and more attention; at the same time several detection algorithms were put forward [2-4]. Most of the existing pavement crack detection algorithms based on gray gradient information have been widely researched. One typical example among those experiences is the one in which Ayenu-Prah and Atto-Okine denoised the pavement image and then used Sobel operator to extract crack edge [5]. Yan et al. took advantage of the median filtering method to enhance the image, and then used the gray morphological edge detection operator to obtain crack [6]. Zhou and Subirats transformed the pavement image to different direction sub-bands by wavelet transform, and then detected crack edge in different directions [7, 8]. However, the above edge detection methods are just crack detection methods based on local features, which only involve the step edge. Since the pavement images are often affected by several factors, such as the macro texture, speckle noise and illumination conditions, the crack has a weak signal. The gray features of real cracks are usually represented by certain combination of the step change, roof and line profile. In addition, there is no comprehensive processing method for crack feature description, analysis and processing.
Taking advantage of gray feature and the global characteristic of the crack image, this paper models the gray feature of the crack image and proposes a global description method for crack detection. Many foreign and domestic researches have shown that oriented energy model is regarded as invariant measure of image features based on phase congruency. Because the phase information has the importance and stability of phase information in edge detection, oriented energy method can reliably detect the step change, roof and linear features in gray image [9]. By using oriented energy method, this paper models the crack gray feature by phase congruency. Spectral clustering of graph theory can directly use the similarity of pixels as basis for clustering analysis, and converge to the global optimal solution. These characteristic can conduce analysis and operation for crack detection. Spectral clustering generally transforms clustering into an optimal partition in graph, and it is a kind of clustering methods of pairwise pixels. As spectral clustering adjusts similarity of pairwise pixels through adjacent relationship between the image areas, it is able to detect crack edge more accurately. At present, the spectral clustering for image edge detection is still in primary stage. There are few researches on using spatial relationship between adjacent areas to detect edge. To sum up, traditional crack edge detection algorithms don’t make use of phase information and the spatial relationship of the region, which leads to unsatisfied results. This paper proposes a new pavement crack detection algorithm based on spectral clustering method. Firstly, our method represents the phase information by oriented energy methods and models the gray feature of crack image. Then, it calculates oriented energy of image to measure similarity between pairwise pixels and introduces the spatial relationship to adjust similarity. Finally, the crack clustering is executed by the spectral method in order to detect the crack edge.
The rest of the paper is structured as below. Section II presents the oriented energy model . How to adjust the similarity using spatial relationship is described in Section Ш. After that, crack detection using spectral clustering method is discussed in section ^ , then experiment and analysis are made in section V, in final the conclusion is drawn in the last section.
-
II. Oriented energy model
Based on the image characteristics of pavement crack, crack geometry model is presented by means of inversion pulse, roof, ladder structure and their combination. Therefore, the crack gray feature is usually composed of the features of step changes, roof and line profiles. Using single operator is unable to detect the crack edge and will lead to crack missing. Morrone demonstrated that the edge features of step changes, roof and line profiles emerge exactly at points of strong phase congruency by a series of psychophysical experiments [10]. Therefore, the crack edge information of image can be analyzed and processed by detecting points of phase congruency. Since it is difficult to compute phase congruency of the image, the value is normally calculated by using the local energy function of the image and approximation approach Fourier phase information in the frequency domain is constant, and simultaneous phase congruency has nothing to do with the overall size of signal. It ensures the invariance of the pixels brightness and contrast, and is also able to accurately detect edge features in different scale spaces.
Crack edge features are generally described by important factors of the edge direction, strength and continuity. Edge direction has a very important role in reliable extraction edge features of adjacent and crossed block cracks. Ignoring edge direction in the crack edge detection often results to continuous edges in the image and failing to effectively extracting the complex crack. In this paper, direction of edges is introduced to the local energy model in order to constrain the edge detection, which makes cracks in the same direction maintain continuity and extends or close the edges as much as possible.
Gaussian function has been widely used in signal processing and analysis. Fourier transform of the Gaussian window is proved to be the only satisfied lower limit of time-frequency uncertainty principle. This paper uses Gaussian filter in image field to describe the pavement crack’s local edge features. The real part of complex exponential filter employs the second derivative of Gauss function fθo,σ which is symmetric. The imaginary part of the complex exponential filter is odd symmetrical Gauss function fθe,σ which is Hilbert transform of the real part [11]. Then, the complex exponential filter W = A + jB is constructed by Gauss function, where A is the second derivative of the even symmetrical Gauss function f o and b is the odd symmetrical Gauss function f e . The complex exponential filter W is convolved with the image I, which result is J = I ∗W = (I ∗ A) + j(I ∗B) . Therefore, the local energy function is defined as
E = (I ∗ A) 2 + (I ∗ B) 2 .
The oriented energy of each pixel in the image I is described as [12]:
OE θ , σ = ( I ∗ f 1 θ , σ ) 2 + ( I ∗ f 2 θ , σ ) 2
In (1), σ is the neighborhood radius of the circle around the pixel (x, y), and θ is the angle of the oriented energy OE θσ . As the amplitude of the complex exponential filter response, OE θσ is the oriented energy of scale σ and angle θ . Due to its maximum value corresponding to the crack edge point, OE θσ represents the composite edge contrast, thus reliably detects the combination features of roof, step changes and linear profiles in gray scale image of the pavement. OE θ , σ could be calculated in multiple directions and scales by means of adjusting θ and σ in pavement image, which can ensure the obtaining of continuous and closed edge.
-
III. Adjustment of the similarity using spatial
RELATIONSHIP
From the crack edge feature described with oriented energy model, OE is the feature value of each edge pixel. Considering the introduction of the spatial relationship, a measure of similarity between pairwise pixels can be applied to determine the class of the pixel. Because spectral clustering has converted the problem of clustering to optimal partition of the graph, it is a clustering algorithm about pairwise points. Thus, it is used to improve the crack edge detection by judging the adjacency between regions to adjust the similarity between the pixel pairs. Intuitively, two pixels belong to two different groups if there is a contour which could separate them. The dissimilarity is stronger if the contour which could separate them is extended [13].
Spatial relationship between regions is shown in Fig.1. It is the original image in Fig.1.a. The image shows a magnified part of the original image in Fig.1.b, which is the divided into I and II different regions. Fig.1.b shows the spatial relationship between pixels.
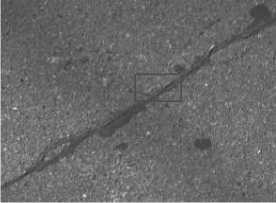
(a) Original image
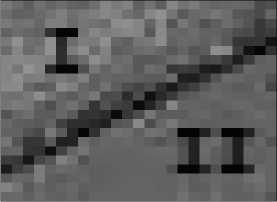
(b) Labeled contents from the square field
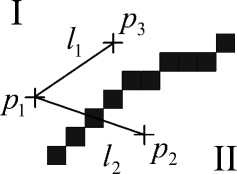
(c) Spatial relationship between pixels
Fig 1. Spatial relationship between the adjacent image areas
Fig.1 illustrates the intuition behind this idea. There is an extended contour separating p from p and p , Pixels p , p and p all have similar intensity values. Based purely on intensity, all three locations will have strong similarities and may mistakenly be divided into a group. Thus, we expect p to be much more strongly related to p than p . This intuition carries over in our definition of dissimilarity between two pixels: If the orientation energy along the line between two pixels is strong, the dissimilarity between these pixels should be high. Formally, we define the dissimilarity dedg ( p 1, p 2) between two pixels as follows:
d edg ( p 1 , p 2 ) = OE con ( X ) - avg ( OE con ( p l ), OE con ( p 2 ); X )
Where X = arg max OEco„(x)
xel avg (OEcon (P1), OEcon(p2);X) = p 2 - x /V / X - pi
OEcon (pi) + pi - p 2 pi - p 2
OE con ( p 2 )
l2 is the straight line between p and p ; x ˆ is the location where the orientation energy is maximum on l2; and avg ( OEcon ( p 1), OEcon ( p 2); x ˆ) is the weighted average orientation energy of p and p . It is worth nothing that in our definition, we consider the relative difference in orientation energy.
We compute the affinity matrix W defined by W according to the spatial relation between areas.
Wij = exp(-dedg(pt, pj )) (4)
Usually the similarity between the i-pixel and the j-pixel can be computed in the neighborhood of radius r (r=5). W indicates no similarity which orientation is the direction of the maximum gradient along a straight line connecting the two pixel.
-
IV. Crack detection using spectral clustering
METHOD
Spectral clustering is not used under the premise of the characteristics of the probability density distribution assumption, which is suitable for clustering in the sample space of arbitrary shape and converges to the global optimal solution [14-16]. Spectral clustering based on the graph theory provides a global optimal theory and method, which is used to describe, analyze and process the relationship among objects.
This method directly applies the similarity of objects as the basis for clustering analysis. For image segmentation, the pixel classification is changed into an optimal partition problem in graph. In the process of clustering, the similarity with pairwise points can be adjusted by spatial relations between the different regions of the crack side. The edge detection is considered as the different region segmentation, and the crack edge is the boundary of the above regions.
As the crack edge point can be described by phase information in image and the similarity between pairwise pixels can be measured by the spatial relationship, this paper proposes the crack edge detection algorithm based on spectral clustering. The whole flowchart of the proposed crack detection method is shown in the following Fig 2.
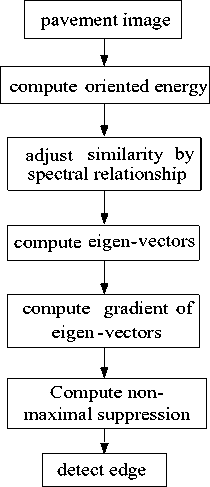
Fig 2. Flow Chart for Pavement Crack Detection
The crack edge detection algorithm is mainly divided into the following four steps.
Step 1 compute oriented energy. Oriented energy of all image pixels is calculated according to (1). Among it, 0 represents the radian of specific direction, 9 = m x П , n m e [0, n ) , m represents some specific slide and n represents the number equally divided n . In this paper, the direction number is 8 ( n =8), m e [0,7] , and scale factor of Gaussian function с is 2.
Step 2 the similarity between pairwise pixels is revised by adjacent relationship between the regions on both sides of the crack and similarity matrix Wij is computed with (4).
Step 3 compute eigenvectors.
Analysis and calculation of spectral clustering method is based on the similarity between pairwise pixels. In the cluster analysis process, spectral clustering algorithm uses the similarity between objects to transform clustering problem into the optimal partition of the graph.
The image segmentation is accomplished by the sum of edge weights maximum in sub-graph and minimum between graphs in Laplacian matrix of the image.
N cut algorithm has become a classic spectral clustering method in several fields, such as image segmentation and pattern recognition. This method can ensure the maximum similarity within the sample, but also the largest differences between the samples [17]. The k classes partition method of N cut consists of the following steps [18]:
-
3- 1) Image m x n is mapped to the graph, where it consists of the pixels as nodes. W is expressed by the adjacency matrix of graph, which is the NxN matrix, N = mxn . to j in the matrix W is the corresponding element in similarity matrix W ij in the second step.
-
3-2 ) Form the affinity matrix W defined by Wij if i ^ j , and W y =0. Defined D to be the diagonal matrix whose ( i , i )-element is the sum of W ’s i -th row, and construct the Laplacian sparse matrix L = W - D.
-
3-3) Solve { 2 } k_ t, the first k leading eigen-values of the matrix L and corresponding eigenvectors { v } k_ f.
As the eigenvectors { v } k contain important information about the crack edge, we can directly use them to detect crack edges.
Step 4 detect crack edges.
-
4-1) Compute the gradient of these eigenvectors in step 3 by the gradient operator.
4-2) Compute non-maximal suppression under specified direction. Owing to suppress the weak edge points and locate the composite edge points, nonmaximal suppression demands to be computed according to the previous gradient values under eight directions. This is done in the following way. At a generic pixel p , let 0* = argmax OEe denote the dominant orientation and OE ∗ the corresponding energy. Now look at the two neighboring values of OE ∗ on either side of p along the line through p perpendicular to the dominant orientation. The value OE ∗ is kept at the location of p only if it is greater than or equal to each of the neighboring values. Otherwise it is replaced with a value of zero.
-
V. Experiment and analysis
To testify the performance of the proposed method, some experiments are conduced in the paper. In addition, the proposed method is also tested with the different types of cracks and is compared with the manual method.
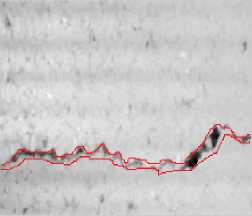
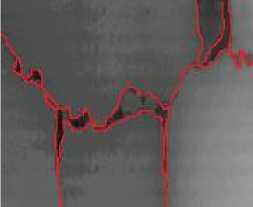
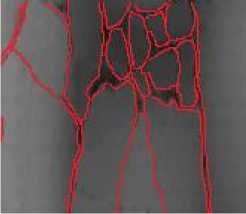
In the paper, the experimental data are generated by line scan camera in vehicle, which resolution is 1024 x 1280 pixels. The longitudinal range of camera view is 1.4 m, and its lateral range is 1.9 m. The sampling space of vehicle movement direction is 1 mm. To verify the effectiveness of the proposed method, we utilize the gray image involved with longitudinal, transverse, block and net cracks of to make the experiment of crack detection. The experiment image is cut from the original image, whose size is 256 x 256. In general, there is noise in the images. As a result, before test, the preprocessing has been done in the images, such as median filtering, normalization and so on.
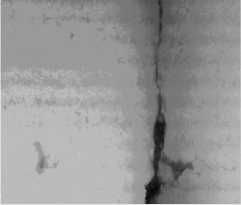
(a) Gray image 1
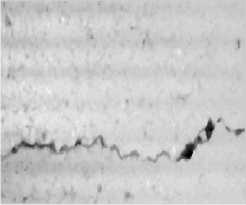
(b) Gray image 2
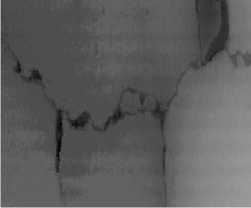
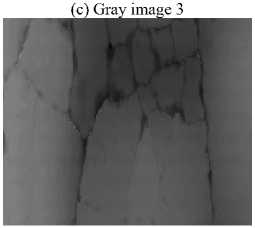
(d) Gray image 3
a1) Our proposed method

(b1) Our proposed method
(c1) Our proposed method
(d1) Our proposed method
(a2) Our segmentation result
(b2) Our segmentation result
(d2) Our segmentation result
(a3) manual segmentation results
(b3) manual segmentation results
(c3) manual segmentation results
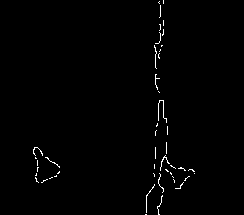
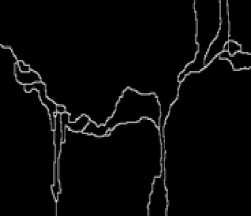
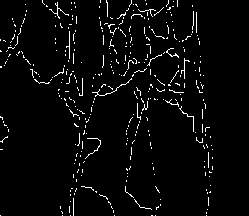
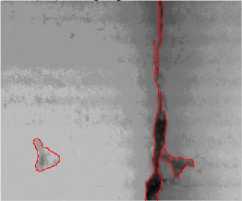
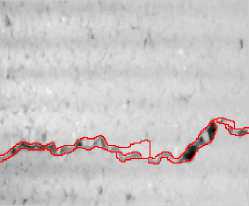
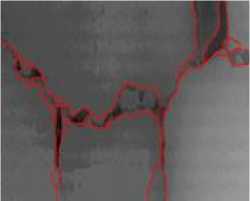
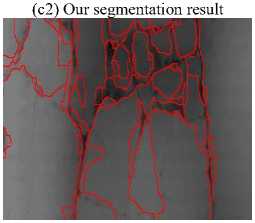
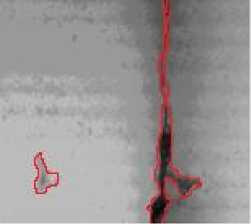
(d3) manual segmentation results Fig 3. Experiment of Crack Extraction
The longitudinal, transverse and block cracks respectively exist in Fig. 3.a, 3.b, 3.c and 3.d. Fig. 3.a1, 3.b1, 3.c1and 3.d1 show the final segmentation result of the proposed algorithm for three different types of cracks. In Fig.3.a2, 3.b2, 3.c2 and 3.d2, the segmentation results of our algorithm overlay with the original image. As is seen from these figures, it testifies that our proposed method can improve the edge detection results, shown in Fig.3.a2, 3.b2, 3.c2 and 3.d2. The method can get closed boundaries and reduce tiny broken edges, at the same time, enhance the integrity of the edge. In addition, in Fig. 3.a3, 3.b3 3.c3 and 3.d3, the cracks is detected and actually measured by skilled workers. Comparing the results of the proposed method with manual segmentation results, it is observed that the crack detection results of our proposed method are very close to the manual results, meanwhile, the proposed method could be performed automatically, which could improve the detecting efficiency greatly.
-
VI. Conclusion
As the traditional edge detection methods are unable to acquire satisfactory results for pavement crack analysis, hence this paper has proposed a new crack edge detection method of combining phase information and the spatial relationship between the adjacent image areas. The method views the oriented energy as similarity between pairwise pixels and uses adjacent relationship of image areas as constraints. By using spectral clustering method to obtain the global optimal solution, the crack edge extraction could be completed. In this paper, all types of pavement images are used as experimental objects, such as transverse, longitudinal and block cracks. The proposed method has better visual effect compared with the traditional edge algorithm. Experiment results show that the proposed method can overcome the macro texture and noise of the pavement and at the same time detect any type of crack edge cracks with higher reliably and stably.
Acknowledgment
This research was supported by Department of Education of Hubei Province Q20121410, National Natural Science Foundation 41301371 and 61202287.
References Pavement Crack Detection Using Spectral Clustering Method
- Wang K C P, Elliott R P. and Meadors A., “Application and Validation of An Automated Cracking Survey System,” Proceedings of the 6th International Conference on Managing Pavements, pp.1-19, 2004.
- B. B. Song and N. Wei,“ Region Connecting Based Pavement Image Cracks Extraction” , Applied Mechanics and Materials, Vols.135-136, pp.715-719, Oct.2011.
- K. Wang, Z. Hou, and S. Williams, “Precision Test of Cracking Surveys with the Automated Distress Analyzer”, Journal of Transportation Engineering, Vol.137, No.8, pp. 571-579, Aug. 2011.
- W. Cai, A. Dong, X. Zhang, “Crack Width Detection of the Concrete Surfaced Based on Images”, Advances in Computer, Communication, Control and Automation, Vol.121, pp. 625-632, 2012.
- A. Ayenu-Prah and N. Attoh-Okine, “Evaluating pavement cracks with bidimensional empirical mode decomposition,” EURASIP J. Adv. Signal Process, pp.1-7, 2008.
- Yan M D, Bo S B, Xu K, et al., “Pavement Crack Detection and Analysis for High-grade Highway,” the 8th International Conference on Electronic Measurement and Instruments, Vancouver, Canada, pp.548-552, 2007.
- J. Zhou, P S Huang and F P. Chiang, “Wavelet-based Pavement Distress Detection and Evaluation,” Optical Engineering, Vol.45, No.2, pp.1-10, 2006.
- P. Subirats, J. Dumoulin V. Legeay, et al., “Automation of Pavement Surface Crack Detection Using the Continuous Wavelet Transform,” International Conference on Image Processing, Florence, Italy, 2006.
- P. Kovesi, “Edges Are Not Just Steps,” In: The 5th Asian Conference on Computer Vision (ACCV 2002), pp. 23-25. Jan. 2002.
- Morrone M.C. and Burr D. C., “Feature Detection in Human Vision: A Phase Dependent Energy Model,” In: Proceedings of the Royal Society of London. Series B, Biological Sciences, Vol.235, No.1280, pp.221-245, Dec.1988.
- Jin Huazhong, Zhou Qi and Chen Mingquan, “Edge Detection of Aerial Image based on Oriented Energy and Spectral Clustering”, Journey of Hubei University of Technology, Vol.26, No.2, pp.57-60, 2011. ( In Chinese)
- Ben Robbins and Robyn Owens, “2D Feature detection via local energy”, Image and Vision Computing, Vol.15, No.5, pp.353-368, May 1997.
- J. Malik, S. Belongie, T. Leung et a1., “Contour and texture analysis for image segmentation”, Intl. Journal of Computer Vision,Vol.5, No.1, pp.7-27. 2000.
- Cai Xiaoyan, Dai Guanzhong, and Yang libin, “Survey on Spectral Clustering Algorithms”, Computer Science, Vol. 35, No. 7, pp. 14-18, 2008. ( In Chinese)
- A.Y. Ng, M. I. Jordan and Y. Weiss, “On spectral clustering: Analysis and an algorithm”, In: Proc. of NIPS 2001, pp. 849-856, 2001.
- S. Sarkar and P. Soundararajan, “Supervised learning of large perceptual organization: Graph spectral partitioning and learning automata”, IEEE Transaction on Pattern Analysis and Machine Intelligence, Vol.22, No.5, pp.504-525, 2000.
- J. Shi and J. Malik, “Normalized cuts and image segmentation”, IEEE Trans. On Pattern Analysis and Machine Intelligence, Vol. 22, pp. 888-905, 2000.
- Jin Huazhong, Xie Haitao, Wang Ji, et al., “Edge Detection of High Resolution Image Introducing Spatial Relationship”, The 2012 International Conference on Computer Science and Service System, pp. 2273-2276. Aug. 2012.
