Performance Analysis and Enhancement of UTM Device in Local Area Network

Author: Ashvin Alagiya, Hiren Joshi,Ashish Jani
Journal: International Journal of Modern Education and Computer Science (IJMECS) @ijmecs
Article in issue: 10 vol.5, 2013.
Free access
Along with the growth of the computer system and networks, the mysterious and malicious threats and attacks on the computer systems are also increasing exponentially. There is a need of continuous evaluation of the security of a network and enhancement of the network attack detection system, which will be able to detect different attacks along with the characteristics of the attacks. In previous work, the port scan attack is considered as precursors to an attack and the target was to provide the mitigation technique for the particular port scan attack. There have been relatively few empirical studies done for port scan related attacks and those that do exist may no longer reflect the impact of such attacks on the functionalities of the UTM/network device and on the network. To address this lack of knowledge, this experiment is carried out in fully controlled test bed environment wherein a set of varieties of attack can be simulated and impact of attack(s) is analyzed and appropriate mitigation technique is suggested to mitigate the port scan attack. The experiment result indicates that the port scan mitigation implementation on UTM helps reducing the load on the UTM device and reduces network congestion effectively.
Anomaly Detection, Network Traffic Analysis, Port Scanning
Short address: https://sciup.org/15014594
IDR: 15014594
Text of the scientific article Performance Analysis and Enhancement of UTM Device in Local Area Network
Network attack detection is one of the challenging tasks for network administrators in today’s rapid changing world. There is a huge amount of information flows across the network and many network attacks are evolving like Network Scan activities, Distributed Denial of Service attacks (DDoS) and spreading network Worms of Viruses etc. These attacks are aimed to disrupt and compromise the normal operation of the network and the integrity of data. Thus, it is a great challenge to identify the new attack and stop them effectively.
It is necessary to evaluate the network security device time to time in order to ensure the security of the protected network. The purpose of this research is to investigate the capability of a lower end UTM device for detecting the new network attacks/malicious traffic, and to check the effect of the attack data on the network and on the genuine traffic.
In this paper, we have carried out the performance analysis of the UTM device in fully controlled and restricted LAN environment by generating a set of attacks on UTM. The main focus of this study is to evaluate the performance of the UTM device in severe attack condition and measure the effect of attack data on UTM device as well as on genuine traffic and, identify the attack(s) that hampers the performance of the UTM device. The port scan attack mitigation technique is suggested for mitigating for the port scan attack which in turn, helps in improvising the performance of the UTM device. The remainder of the paper is arranged as follows. Section -II provides the background information about the attack process and a brief description of port scan attack. In section-III, a brief history of attack detection and prevention is given and previous work is discussed. The literature review finding and analysis is presented along with the motivation of the research at the end of section-III. The details of the experimental methodology and the functional description of each component along with the applications used in generating the anomalous traffic have been discussed in section-IV. Experimental results and mitigation of the attack has been presented in section-V. Based on the experiment results, conclusions have been drawn and some recommendations for future work have been proposed in section-VI.
-
II. BACKGROUND
Discovering the source of the network attack reveals the information about the attacker’s physical location and its identity. Thus, finding the trace of the network attack is one of the important and challenging tasks [1] which helps in mitigating the attack/anomalous traffic. In this section, the general attack process is briefly explained.
^ The Attack Process
A network attack can be outlined as any method, process, or means that is used to maliciously attempt to compromise network security [2]. There can be a number of different reasons that attacker(s) would want to attack computer networks.
There are various distinct stages that constitute an attack on a computer or network starting from the initial motivation of the attacker to the final execution of the attack. In general, the attack process comprises four main stages [3]:
-
1) Attackers Motivation and Objectives
-
2) Information Gathering/Target Selection
-
3) Attack Selection
-
4) Attack Execution
While the focus of this research is on the attack detection and prevention, it is of the essence to concisely explain the attack method. An attacker could have different reasons for launching the attack. Some attackers may simply want to test their skills where as others may want to prove a point. Attacks chosen and how they are executed will have some motivational impact.
The attacker must select a target and collect information before executing the attack. These two activities take place either at the same time or sequentially, based on what attacker wishes to accomplish. Collecting the Information involves pulling out useful information from the target network or host, whereas target selection is the process of choosing of a promising target.
Once the attacker has a target and some information on the potential weaknesses of the target, they can choose a suitable attack. The final stage is the launching of the attack, in which the attacker goes forward to launch the attack against the target.
Port scanning is generally used to probe a network host for open or closed ports and to check whether the service is available or not, by observing responses to connection attempts [4]. The prime objective of the port scanning is to identify possible vulnerabilities in the system that can be exploited later on. Detecting such activity is therefore the key for proper network protection. How the port scans establish a connection, terminate a connection, and exchange messages in the event of a successful/unsuccessful connection or termination of a connection is described in [5].
-
III. RELATED WORKS
The issue of network attacks and anomaly detection has been extensively studied during the last decade. Most of the NIDS are based on anomaly detection techniques which are Bro [6] and SNORT [7], the widely used open-source anomaly detection systems. Most of the techniques used in the field of NIDS are described in [8, 9]. The vast majority of the anomaly detection systems analyzes statistical variations of traffic volume descriptors and traffic features (e.g. number of packets, bytes, network flow, IP Addresses, ports etc.) using either particular link or the whole network data.
M. Thottan and C. Ji [10] introduced the statistical signal processing techniques based on abrupt change detection for detecting network anomaly. The statistical analysis method was developed using SNMP MIB datasets and the author [10] suggested checking the persistency of the data, to reduce the false alarms of anomalous event. In order to avoid the missing samples, the use of TCP based datasets are suggested and recommendation is given to design an efficient algorithm which could be used at the time of dealing with missing data. The study [10] shows that incorporating the networking and signal processing techniques would help in developing better and more efficient tools for detecting network anomalies and help solving performance related issues in the network.
In 2004, R. Rao et al. [11] presented a new data structure called Partial Completion Filters (PCFs) for detecting the TCP Port scan and TCP flood related attacks. Their method does not require having the full state of the data traffic but would require only partial data sets to detect the attacks. The PCFs provides solution in detecting imbalanced parentheses in a streaming environment. Their bidirectional and reverse path deployment suggestions came out to be the most resilient to spoofing. As per the authors [11], the issues of behavioral aliasing i.e. good behavior can aggregate to look like bad behavior (False Positive) and spoofing are main obstacles that must be addressed in any scalable solution. There is a scope of examining the UDP based port-scan and other Port scan attack in detail is still open, as they were not considered in this research.
Lakhina et al . [12] proposed a Subspace method which can detect, identify and quantify network-wide traffic anomalies. The Subspace method uses Principal Component Analysis (PCA) to classify network traffic into a normal component and anomalous element. Their method can successfully diagnose volume anomalies with low false alarm rate and with high detection rate.
Teodoro et al. [13] presented the challenges of detecting network intrusion though IDS. The authors have described some of the challenges and open issues in detecting the intrusion like Low detection efficiency, low throughput, high cost and the absence of appropriate metrics and assessment methodologies for evaluating and comparing IDS techniques.
Hong-shan et al. [14] proposed a simulation method of network security using system dynamics. They compared the system dynamics simulation result with the Two-factor model (a classical math model of worm) and they concluded that the system dynamics simulation is the best method of describing the worm attack process.
El-Hajj et al .[15] proposed a Fuzzy logic based solution to work with Snort for mitigating the Port scan based attacks as, mathematical formulas were not much effective in mitigating the Port scan attack due to its traffic patterns. As per the author [15], Snort gives many false positive and false negative alarms specially detecting the port scanning attacks, when it works as a standalone. It was found that the use of the customized fuzzy logic controller along with snort enhances the capabilities and accuracy of determining the port scan attacks. It was also observed during the experiment that when more than five attacker starts port scan attack at the same time on a victim machine then the victim’s machine had a denial of service situation and it could not serve the genuine traffic. As a consequence, Port scan attack is really a complicated attack and it can be the starter for different types of attacks hence, more research is recommended towards mitigating the port scan related attacks.
Boschetti et al. [16] presented a TVi (Traffic Visualiser) tool that furnishes multiple visual representations of network traces including detailed information about selected hosts, anomalies and attack paths. It helps in increasing the network administrator’s ability to disclose veiled patterns in network traces. TVi can be integrated with Snort and other monitoring utilities which could provide great flexibility and precision in detecting the attacks.
Bellaiche et al. [17] evaluated and compared the performance of stateful and stateless DoS attack detection methods for detecting the network attack. The Stateless detection technique is slower and it is not capable enough to respond to the detection and stop the attack traffic, as it does not store the information. Due to this reason, the stateless method is not able to stop the attack packets effectively and selectively. In contrast, the stateful detection technique stores the data which can be analyzed for the possible network attack attempt and can be used to respond to the attack once the attack has been detected [18].
Murthy et al. [19] suggested detecting the network worm by capturing the content in packets flowing in the LAN systems using snort and by using the warm detecting algorithm they proposed. The authors [19] used worm detecting algorithm along with Snort Intrusion Detection System rules to check whether the content/packet is infected or not. It is found that better security can be ascertained by updating the worm information database immediately once the new locations of worms are known.
3.1 Literature Review Analysis and Findings
The review of related work of network attacks and their countermeasures at the beginning, points out of having network traceback tools and techniques [1] for countering the network attacks. The attack or intrusion detection and prevention methods available currently are having the ability to detect the known attack(s) and block them using the available IPS signature [12]. The attacks could be combined in various sub-attacks wherein the response to these attacks could be separate or combine, is still needed to be considered and researched out [19]. Port scan attacks are really complicated and it can be the starter for different types of attack. There is a need of evaluating the port scan attack the same way as the DoS attack evaluation is done because as per the experiments of [16], when more than five attackers start port scan attack at the same time on a victim machine then the victim’s machine had a denial of service kind of situation. Hence, there is a need of performance analysis and evaluation of network security device time to time to ensure the safeguarding of network resources [19].
-
IV. PROPOSED WORK
The proposed work is targeted to detect anomalous/attack data and mitigate the same. It is to be carried out as per the steps outlined below.
1) Investigate the capability of a lower end UTM device for detecting the new network attacks/anomalies/malicious traffic including the port scan attack.
2) Check the effect of the attack data on the network and on the genuine traffic.
3) Enhancement for attack mitigation.
4.1 Experiment Topology and Scenario
Based on the observation and outcome of the experiments, the countermeasures for blocking the attack is suggested.
The experimental test-bed is created in full restricted and controlled LAN environment for the sole purpose of evaluating the performance of the UTM device. The network attacks including the port scan attacks carried out on UTM device and data is collected. This architecture thus allows:
-
1) Collecting data at the host and network levels,
-
2) Correlating the data collected at the host and network level
-
3) Filtering the user traffic from attacker’s traffic,
-
4) Controlling the whole testing environment.
This approach helps in eliminating the issue of storing vast amounts of data since no real user traffic data is collected.
The topology used in this experiment is shown in Fig. 1. The LAN port of the UTM is connected to the LAN segment where the LAN workstation and the attack agents are connected. The WAN port of the UTM is connected to the Internet backbone. All the attack traffic is sent to the LAN port of the UTM (10.50.50.1) as a LAN port of the UTM serves as a gateway for all the workstations. The anomalous data was continually sent for about 10 minutes from all the Attack Agent workstations to the LAN port of the UTM and at the same time the continuous Ping was carried out with 1000 bytes of data to the Google’s IP address (173.194.36.63) from normal workstation along with the browsing of the websites.
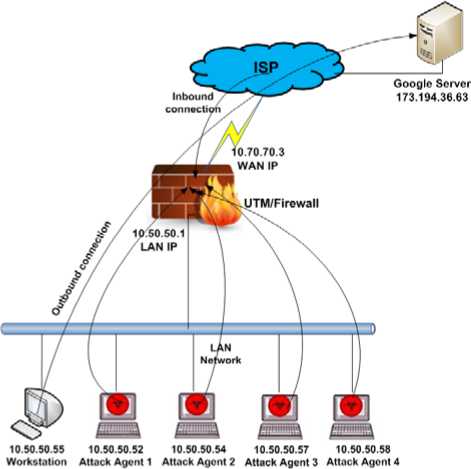
Figure 1: Test-bed Architecture – Experimental Network Topology
The experimental results provided in this paper are based on the test-bed shown in Fig. 1. Functional descriptions of the components specified in Fig. 1 are given below:
UTM Device/Firewall: This is the edge device which comprises network and security functions such as Firewall, Antivirus, Antispam, Intrusion Prevention System, VPN, Web and Content Filtering in a single device and it connects the network devices to Internet and vice-versa. In this experiment, the UTM device is used with all the above mentioned functionalities and with its full capacity. Strict IPS and DoS policies are applied to counter the attacks. UTM serves as a gateway level device used for Internet connectivity for all the LAN workstations including the attack agents. The UTM device is used as an attack’s target.
Workstation: A normal workstation (10.50.50.55) running with Windows XP is used to do continuous ping ‘’ with 1000 bytes of data to ensure the continuous reachability to the Internet. This helps in finding any network outage if it is there during any point of time of the experiment. Along with the Ping, the workstation (10.50.50.55) also accessing the websites through the UTM device.
Attack Agents: In this experiment, four LAN workstations represented as “Attack Agent” running with Windows XP. Each attack agent is set to send attack/malicious traffic to the UTM with the help of different tools, which are described later in this section. Attack profiles are set in each attack agent, which is described below.
1) 10.50.50.52
Tool Attack Hyenae FE HSRP Resign Nmap Intense Scan (All TCP Port) HTTP Traffic Generator Request for ‘’
2) 10.50.50.54
Tool Attack Hyenae FE PPPoE Discover Nmap Intense Scan + UDP HTTP Traffic Generator Request for ‘’
3) 10.50.50.57
Tool Attack Hyenae FE DNS Query Nmap Attack1*(Custom Profile)1 HTTP Traffic Generator Request for ‘’
4) 10.50.50.58
Tool Attack Hyenae FE HSRP Hello Nmap Attack2*(Custom Profile)2 HTTP Traffic Generator Request for ‘’
*1,2 Group of attacks is selected in Attack 1 and Attack 2 using Nmap custom profile
Data Collection: The data collection is done using the tcpdump utility to collect the real-time data for LAN workstation and for the attack agents on the UTM device. Data is collected in the format of tcpdump and later on examined and analyzed using Wireshark [21] utility.
4.2 Applications Used in Generating the Anomalous/Attack Traffic
The experiments are carried out in a restricted LAN environment consisting of 5 LAN workstations and a network UTM device as shown in Fig. 4. Out of the five workstations, 4 workstations are used to generate different attack traffic, and at the same time, the 5th workstation is used to send the genuine traffic. All the traffic is sent towards UTM. For generating the attack/anomalous/excessive flood traffic, some of the well-known Open Source tools are used which are given below.
i. HTTP Traffic Generator
ii. Zenmap (Nmap)
iii. HyenaeFE
4.2.1 HTTP Traffic Generator
4.2.2 Zenmap
4.2.3 HyenaeFE
4.3 Data Analysis
These tools provide a number of configuration parameters including choice of transport protocol (TCP, UDP, HTTP), the data rates etc., that are very useful for the in generating the anomalous data.
HTTP Traffic Generator [22] is an open source tool that allows generating good amount of HTTP traffic for testing purposes for Intrusion Detection system, Web and Application server. HTTP Traffic Generator version 1.7.2 is used in this experiment.
This tool is very useful in checking the resistance to HTTP attacks. It gives flexibility to specify the requests count and the time interval between two requests. Once the URL, Count and Interval is set, the HTTP Traffic generator would continuously send the requests to the specified domain, thus helping in generating the required client traffic.
Another tool that is used in generating the attack traffic is Zenmap [23]. It is a free and open source utility used for security scanning. It allows user to use predefined attack profiles as well as it enables users to create the custom attack profiles using the Port, Protocol, State, Service, and Timing etc. Zenmap version 5.51 is used in this experiment.
HyenaeFE is an advanced and highly flexible network packet generator. It enables the user to generate well known attacks like DoS and DDoS and other attack scenarios. It comes with a clusterable remote daemon and an interactive attack assistant [24].
Wireshark version 1.6.8 [21] is used for analyzing data collected through the TCPDUMP utility. Fig. 2 shows the example of data collection with Wireshark along with multiple attribute.
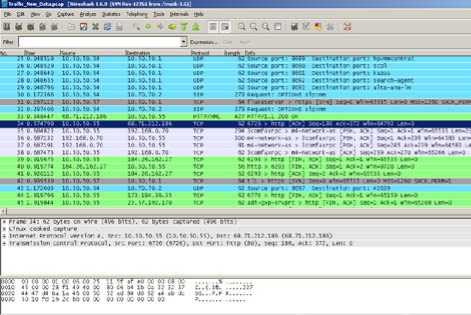
Figure 2: Data Analysis through Wireshark Utility
Wireshark is one of the leading network packet analyzer tools which allow capturing network packets and displaying the packet data in greater detail. It is a well-designed GUI based tool for sniffing and understanding the Ethernet based packets. Wireshark maps IP addresses, MAC addresses, and high and low level protocol fields to symbolic names for easier interpretation.
TABLE I: Summary of Traffic Data Separated by Protocol
|
Protocol |
No. Of Packets |
No. Of Bytes |
% Of Total Packets |
% Of Total Bytes |
|
TCP |
317404 |
36337934 |
89.18% |
68.72% |
|
HTTP |
11680 |
13685320 |
3.28% |
25.88% |
|
UDP |
11454 |
923866 |
3.22% |
1.75% |
|
HSRP |
7813 |
499968 |
2.20% |
0.95% |
|
DNS |
1472 |
249140 |
0.41% |
0.47% |
|
TLSV1 |
1120 |
258482 |
0.31% |
0.49% |
|
Others |
4953 |
920543 |
1.39% |
1.74% |
|
Total |
355896 |
52875253 |
100% |
100% |
Table 1 shows the summary of traffic data that were collected during the experiment. The data was collected for both the link direction. Number of Packets per protocol and the % of Bytes sent by a protocol are represented in Fig. 3.
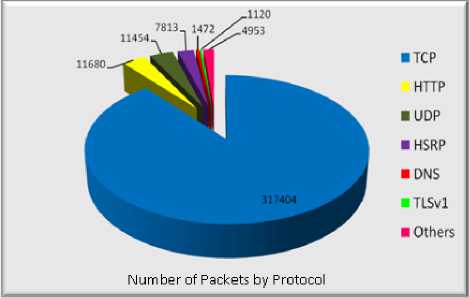
Figure 3: Number of Packets Sent by Protocol
A large amount of traffic captured during the experiment. For the simplicity and better understanding, the traffic is separated by protocol type. The number of packets that use TCP protocol is 317404 packets (68.72 % of Total packets). The packets use HTTP protocol is 11680 packets (25.88% of Total packets). The packets use UDP protocol is 11454 (1.75% of Total packets). The packets use DNS protocol is 1472 (0.47% of Total Packets). The packets use TLSv1 (SSL v3) protocol is 1120 (0.49% of total packets. Other protocols were also observed in the trace, which are SIP, Telnet, ICMP, ARP, H.225, BOOTP, NBNS, RPC, and ISAKMP etc. The other protocols were not added in the table 1 because there are a few numbers of packets observed for other protocol of the Total packet.
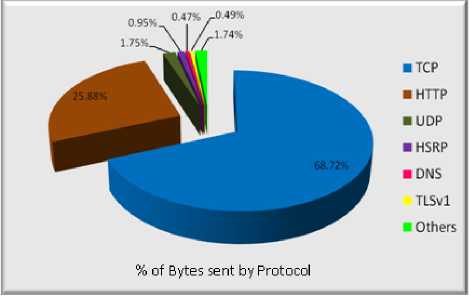
Figure 4: Number of Bytes sent by Protocol
Table 2 shows the attack type and number of attack requests received on the UTM device. It was observed that TCP based ACK or RST packets were dropped considering them as “Invalid Traffic” by UTM, hence 21% of TCP based scan were dropped and majority of the TCP SYN packets were allowed. Similarly, 59% of UDP based port scannin packets were dropped and 39% of HSRP attack packets were dropped by UTM device.
TABLE 2: Summary of Attack Traffic and Dropped Packets
|
Attack |
Packet Type |
No. of Request Packets |
No. of Dropped Packets |
% of Dropped Packets |
|
Port Scan |
TCPScan (SYN/ACK/RST) |
278044 |
59220 |
21% |
|
Port Scan |
UDPScan |
15687 |
9265 |
59% |
|
HSRP Hello/ HSRP Resign |
Hello (State Initial) HSRP HTTP (SYN) |
8206 |
3165 |
39% |
|
Sub Total |
301937 |
71650 |
24% |
|
|
Other |
Other Attacks |
5364 |
— |
|
|
HTTP Request |
HTTP Request |
14557 |
11 |
The statistic presented in Table 2 indicates that there is a need of countering the TCP SYN based port scan attacks as the current mechanism of the UTM is not able to cater such attack packets.
V. EXPERIMENTAL RESULTS AND MITIGATION OF THE ATTACK
5.1 Observations and Proposed Solution(s) for Open Issue(s)
5.2 Mitigation of Port Scan Attack
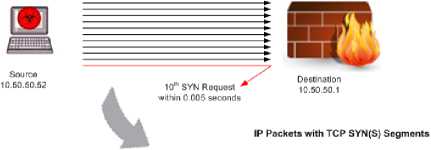
A port scan is mainly used to find out whether the victim’s machine is up or not, and if it is up then the second step is to find out what services the system is running with. A port scan takes place when one source IP address sends out IP packets comprising only TCP SYN segments to up to 10 different ports at the same destination IP address within a pre-defined interval (the default time is 5000 microseconds or 0.005 seconds). In general, the main objective of port scans is to find out the available service of the targeted machine by getting replies to the port scan requests. In this experiment, we have taken port scan as an attack and it is launched from multiple attack machines at the same time which generated lots of port scan requests.
To detect the port scan attack, the security device should log the number of different port scan request coming from the remote source. The default settings for pre-defined interval of port scan attack (if a remote host scan 9 ports in 0.005 seconds) is used to identify the port scan attack. Depending on the severity of the attack, the default port scan interval and burst rate could be defined using the IP-Tables for countering such attack. If any source is found sending such packets then such packets needs to be flagged as a port scan attack and the security device would reject all further packets from the remote source. The security device would detect and drop the tenth packet that meets the port scan attack measure thus dropping all the subsequent packets of port scan.
2233 55 902107 РолС IN IP Ю 50 50 52 60450 > 10 50 50 1 3389 Flags [S], sea 2291759432.
2233 55 902162 P«lG. IN: IP 10.50.50.52 60450 > Ю 50 50 1 3306 Flags [S], sea 2291759432, 22 33 55 902213 EMC. IN. IP 10.50.50.52 60450 > 10.50.50 1.587 Flags [S], seq 2291759432,
22 33 55 902262 ggflG, IN. IP 10 50 50 52 60450 >10 50 501.111 Flags |S], seq 2291759432,
223355 902324 РолС IN IP 10 50 50 52 60450 > 10 50 50 1 445 Flags [S], seq 2291759432,
223355 902374 РолС IN IP 10 50 50 52 60450 > 10 50 50 1 1025 Flags (Sj, seq 2291759432,
22 33 55 902423 EMC. IN. IP 10.50.50.52 60450 > 10.50.50 1.554 Flags |S], seq 2291759432.
22 33 55 902473 РолС. IN IP 10 50 50 52 60450 > Ю 50 50 1 1720 Flags [8]. seq 2291759432.
■Should he 22 33 55 902524 PmIC IN: IP 10 50 50 52 60450 > 10 50 50 1 139 Flags [5]. seq 2291759432.
Rejected-------* 22 33 55 902649 P^ IN: |P Ю.60.60.62.6045» > 10.50.50.1.41402 Flags [S|. seq 2291759432.
Figure 5: Mitigate Port Scan Attack Originating from a Source
As per Fig. 5, the enhancement is done on the UTM device to mitigate port scan attack. The security device makes an entry in its session table for the first 9 connection attempts from 10.50.50.52 to 10.50.50.1 and it does a route lookup and a policy lookup for these requests. If no policy allows these connection undertakes, the security device tags these packets as invalid packets and it removes them from the session table which occurs at regular interval (e.g. every 2 seconds or so). After the ninth attempt, the device rejects all further connection attempts coming from the same source IP address. The limit of the port scan detection could be lowered to 5 connection attempts in 5ms, and burst limit can be set up to 10 packets in 5ms. This experiment is carried out with the 10 attack packets per 5ms.
The experiment was carried out again as depicted in section 4 after implementing the port scan mitigation technique on UTM. Three tests were carried through to monitor CPU, Memory, Load Average and Packet Loss. The logs were captured and used to calculate the effectiveness of attack traffic on the genuine traffic along with the UTM using TCPDUMP and Wireshark utility. It was observed that most of all the TCP SYN based port scan attack packets were dropped by the
UTM device after implementation of the above mentioned mitigation technique.
5.3 CPU-Memory Usage Vs Traffic flow
Fig. 6 shows the CPU and Memory usage results in conjunction with the volume of the network traffic in severe attack situations.
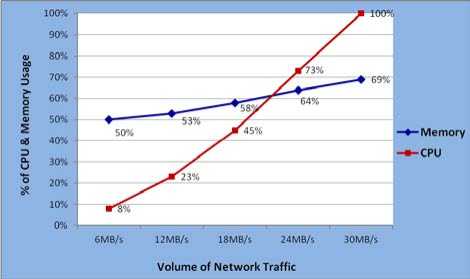
Figure 6: CPU and Memory Usage Results in Attack Situation
It is observed that in normal condition, the memory usage stays around 50% and CPU usage stays around 8% in UTM. As the attack load is increasing on the UTM device, the CPU and Memory usage are increasing linearly. In high attack load situation, the memory usage reaches to 69% and the CPU usage reaches to 100% resulting in resource unavailability, and the UTM device is not able to serve the genuine traffic efficiently due to the flooded attack data.
Table 3 shows the details of CPU and Memory usage along with the Traffic flow in attack condition and after the performance enhancement for the same attack situation.
It is observed that after applying the performance enhancement parameters, the performance of the UTM is getting improved, and the Memory and CPU usage stays at 64% and 82% respectively in the severe attack situation. This shows significant improvement compared to the severe attack situation.
TABLE 3: CPU and Memory usage of UTM with Reference to Traffic Flow
|
In Attack Scenario |
|||||
|
Volume of Network Traffic |
6 MB/s |
12 MB/s |
18 MB/s |
24 MB/s |
30 MB/s |
|
Memory Usage of UTM |
50% |
53% |
58% |
64% |
69% |
|
CPU Usage of UTM |
8% |
23% |
45% |
73% |
100% |
|
In Attack Scenario - After Performance Enhancement |
|||||
|
Volume of Network Traffic |
6 MB/s |
12 MB/s |
18 MB/s |
24 MB/s |
30 MB/s |
|
Memory Usage of UTM |
50% |
53% |
56% |
61% |
64% |
|
CPU Usage of UTM |
8% |
23% |
35% |
63% |
82% |
Fig. 7 shows the graphical representation of the CPU and Memory usage after applying the performance enhancement parameters on the UTM device for blocking the Port scan attack data.
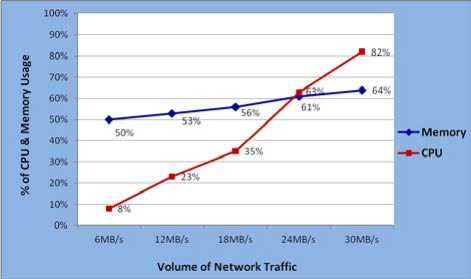
Figure 7: CPU and Memory Usage Results of UTM after Enhancement
5.4 Load Average
It is observed that as the volume of attack traffic is increased on the UTM device, the Load Average is also getting increased. In normal condition, the Load Average should remain below 4 and if in case it goes above 4 then it is considered as high load situation for the UTM device. Under high load average situation, the UTM device could not perform well. In our experiment, it is observed that the packet drop reaches up to 31% in high load average condition. When the load average reaches to 7, the high amount of packet drop is observed and the performance of the UTM device is getting decreased.
TABLE 4: Load Average of UTM with reference to Traffic Flow
|
In Attack Scenario |
|||||
|
Volume of Network Traffic |
6 MB/s |
12 MB/s |
18 MB/s |
24 MB/s |
30 MB/s |
|
Average |
1 |
1.5 |
3.6 |
5.4 |
7 |
|
In Attack Scenario - After Performance Enhancement |
|||||
|
Volume of Network Traffic |
6 MB/s |
12 MB/s |
18 MB/s |
24 MB/s |
30 MB/s |
|
Load Average |
1 |
1.5 |
2.9 |
3.6 |
4.2 |
Table 4 shows the details of load average along with the traffic flow in attack condition and after the performance enhancement for the same attack situation. It is observed that after the enhancement, the load average goes to 4.2 even in the severe attack situation.
Fig. 8 shows the graphical representation of the Load Average after applying the performance enhancement parameters on the UTM device for blocking the Port scan attack data. It is observed that Load Average is reaching up to 4.2 after the applying the performance enhance parameters, and in pick attack condition, the load average stays under control, which shows good improvement.
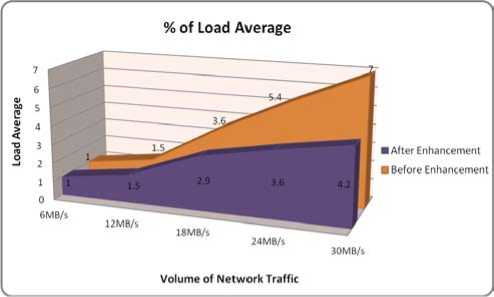
Figure 8: Load Average vs. Volume of Network Traffic of UTM after Performance Enhancement
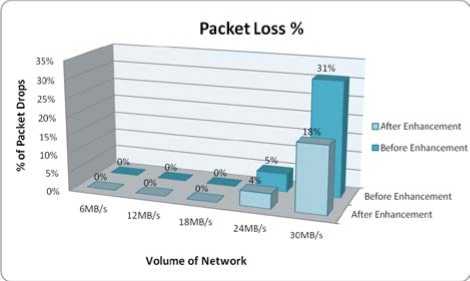
Figure 9: Volume of Network Traffic and Dropped Packets of UTM
5.5 Packet Loss
5.6 Ping Response in Normal Operation and in Attack Situation
Table 5 shows the details of dropped packets along with the traffic flow in attack condition and after the performance enhancement for the same attack situation. It is observed that after applying the performance enhancement parameters on UTM, the load average reaches up to 4.2 even in the severe attack situation. This is quite low compared to the actual attack situation which was around 7.
|
In Attack Scenario |
|||||
|
Volume of Network Traffic |
6 MB/s |
12 MB/s |
18 MB/s |
24 MB/s |
30 MB/s |
|
Packet Loss (%) |
0% |
0% |
0% |
5% |
31% |
|
In Attack Scenario - After Performance Enhancement |
|||||
|
Volume of Network Traffic |
6 MB/s |
12 MB/s |
18 MB/s |
24 MB/s |
30 MB/s |
|
Packet Loss (%) |
0% |
0% |
0% |
5% |
18% |
It is observed that the Packet-loss is occurring when the attack traffic reaches above 20 MB. 5% of packetloss is observed with 24MB/s of attack traffic and up to 31% of packet-loss is observed when the attack traffic reaches to 30 MB/s. Based on the packet loss output, it is concluded that at the time of the high amount of attack data, the UTM device is not able to serve the genuine traffic and in result, the genuine traffic is getting dropped.
Fig. 9 shows the graphical representation of % of dropped packets vs. the volume of network traffic in attack situation and after enhancement in the UTM device.
It is observed that in with normal traffic flow, the Ping response remains between 74 to 100 ms whereas, in extreme attack condition, this delay is reaching up to 4425 ms, results in the dropped packets while pinging to Google. At the same time, the browsing becomes very slow. In the extreme attack condition, we have observed that 90 packets did not receive any ping response and out of 90 requests, 63 requests even could not reach to the UTM due to excessive flood/attack data. Table 6 represents the ping response in normal and in an attack situation.
TABLE 6: Ping Response in Normal and in Attack Situation
|
Mode |
Minimum Time(ms) to get the PING response from Google |
Maximum Time(ms) to get the PING response from Google |
|
Normal Operation |
74ms |
100ms |
|
Attack Situation |
906ms |
4425ms |
Fig. 10 shows the graphical representation of the ping response in the normal situation and in the attack situation.
Based on experimental results, it is confirmed that as the attack load is increasing on UTM, the CPU, Memory and the Load Average on the UTM device are increasing linearly. In high attack load situation, the UTM is not able to serve the genuine traffic efficiently.
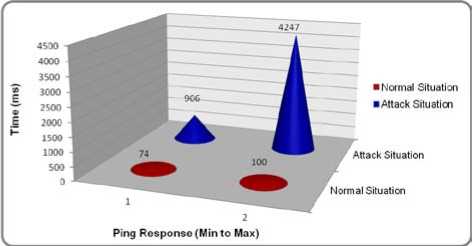
Figure 10: Ping Response in Normal and in Attack Situation
After the performance enhancement, the continuous PING was generated from 10.50.50.55 PC to Google IP address (173.194.36.55) to measure the improvement. Total 251 ICMP packets sent to Google and out of 251 packets, 206 replies were received and 44 packets got lost, resulting in 18% of Ping Drop (packet loss). This result shows around 13% improvement in packet loss data.
TABLE 7: Statistics of Ping for 10.50.50.55 Workstation after Performance Enhancement
|
Source IP |
Destination IP |
ICMP Packets Sent |
ICMP Reply Received |
ICMP Dropped Packets |
% of Dropped Packets |
|
10.50.50.55 |
173.194.36.63 |
251 |
206 |
44 |
18% |
Approximate minimum, maximum and average round trip time (in millisecond) observed after performance enhance during the attack situation for 1000 bytes of ping to Google is given below:
Minimum = 74ms,
Maximum = 4247ms,
Average = 279ms
This data is derived from the command prompt statistics of 10.50.50.55 PC, from where the 1000 bytes of Ping were initiated to Google IP address (173.194.36.55).
The weakness of the security device needs to be identified and threat on/to the system needs to be evaluated. As anomaly based network intrusion detection is a complex process, the focus of this research is on one of the anomaly intrusion which is port scanning. It was found during the experiment that there is no mechanism set on the UTM to counter the port scan attack.
It is observed that the majority of the scans was carried through TCP protocol, with the SYN packets dominating the attack traffic. UDP was another protocol that we have observed during port scan attack but the UDP packets were not that much frequent compared to TCP. In high attack load situation, it is observed that where the 4 different devices starts different attacks on UTM including the port scan attack, the DoS kind of situation is generated, and the performance of the UTM device is getting degraded. In high attack load condition, the CPU usage reaches to100%, the memory usage reaches to 69%, and the load average reaches to 7 resulting up to 31 %packet loss. In this situation, the UTM it is not able to serve the genuine traffic efficiently and resulting in network congestion.
The analysis of the results indicates that implementation of port scan mitigation technique helps in improvising the performance of the UTM device. It is observed that the use of customized port mitigation technique holds promising results and it is able to drop mostly all the TCP based SYN port scan attack packets which occur within 10 milliseconds. Significant level of improvement observed in CPU, Memory and Load Average where in the CPU usage decreased to 82%, the memory usage decreased to 64% and the load average came down to 4.2 after implementing the port scan mitigation technique in the UTM device. The packet loss is also getting decreased and reaches to 18% compared to 31% in the peak load condition after the implementation of port scan mitigation. The same port scan mitigation mechanism is applicable to all the models of the UTM devices.
The issue of detecting and mitigating the low rate port scan is still open because most of the current port scan detection methods are able to detect the port scan that occurs within the time of 5 milliseconds.
The limitation of the data sets in this work is that the port scan carried out on the known victim hosts on the test-bed network. It is more likely that in active networks, there could be more port scan activity going on to different systems, hence there is a scope of more research in the area of live/real networking.
References Performance Analysis and Enhancement of UTM Device in Local Area Network
- S. Lee and C. Shields, “Tracing the Source of Network Attack: A Technical, Legal and Societal Problem.” Proc. 2001 IEEE Workshop on Information Assurance and Security, IEEE Press, pp 239-246, 2001.
- “Network Attacks” in Tech-FAQ. Available at: http://www.tech-faq.com/network-attacks.html (Accessed: 10th August 2012).
- S. Handman, “A Taxonomy of Network and Computer Attack Methodologies”, November 2003, http://www.cosc.canterbury.ac.nz/research/reports/HonsReps/2003/hons_0306.pdf (Accessed/downloaded 9th July 2012).
- M. Vivo, E. Carrasco, G. Isern, G. Vivo, “A review of port scanning techniques”, ACM SIGCOMM Computer Communication Review, vol. 29 Issue 2, pp. 41 – 48, April 1999
- S. Panjwani, S. Tan, M. K.M. Jarrin, M. Cukier, "An experimental evaluation to determine if port scans are precursors to an attack", published in Dependable Systems and Networks, IEEE International Conference, pp 602-611, 2005.
- “Bro Intrusion Detection System” in The Bro Network Security Monitor. Available at http://www.bro.org (Accessed on 9th July 2012)
- “SNORT: an Open Source Network Intrusion Prevention and Detection System” at IDS web page. Available at http://www.snort.org (Accessed on 9th July 2012)
- S. Kim and A. L. N. Reddy, “A Study of Analyzing Network Traffic as Images in Real-Time. In IEEE International Conference of Communication, 2005.
- P. Casas, J. Mazel, P. Owezarski, “Unsupervised Network Intrusion Detection Systems: Detecting the Unknown without Knowledge”, Computer Communications Vol. 35, pp.772-783, July 2012.
- M. Thottan and C. Ji “Anomaly Detection in IP Networks.” Proc. IEEE Transactions on Signal Processing, Vol 51, No 8, August 2003.
- R. Rao, S. Singh, G Varghese “On Scalable Attack Detection in the Network”, ACM Transactions on Networking, October 2007.
- A. Lakhina, M. Crovella, C. Diot, “Diagnosing Network-Wide Anomalies”, ACM, 2004.
- P. Garcia-Teodoro, J. Diaz-Verdejo, G. Macia-Fernandez, E. Vazquez “Anomaly-based Network Intrusion Detection: Techniques, Systems and Challenges”, Elsevier (ScienceDirect) August 2008.
- K. Hong-shan, Z Ming-qing, T. Jun, L Chang-yuan “The Research of Simulation for Network Security Based on System Dynamics”, Fifth International Conference on Information Assurance and Security, IEEE Computer Society, 2009.
- W. El-Hajj1,H. Hajj2, Z. Trabelsi1, F. Aloul3, "Updating snort with a customized controller to thwart port scanning", Security and Communication Networks, John Wiley & Sons, vol. 4, Issue 8, pp. 807-814, 2011
- A. Boschetti, C. Muelder, L. Salgarelli, K. Ma, “TVi: A Visual Querying System for Network Moniroting and Anomaly Detection”, ACM, 2011.
- M. Bellaiche, J. Gregoire, “Stateful of Stateless Flooding Attack Detection”, Seventh International Conference on Networking and Services, IARIA, 2011.
- T. Peng, C. Leckie, and R. Kotagiri, “Protection from Distributed Denial of Service Attack Using History-based IP Filtering,” in International Conference on Communications, IEEE, vol. 1, pp. 482-486, June 2003.
- Y. Murthy, G. Jagadish, K. Mrunalini, K. Siva, P. Satyanarayana, V. Kumar, “A Novel Approach to Troubleshoot Security Attacks in Local Area Networks”, vol. 11, No. 9, IJCSNS, September 2011.
- Wireshark Utility – Available on http://www.wireshark.org (Accessed on 9th July 2011)
- HTTP Traffic Generator in NS Auditor – Available at: http://www.nsauditor.com/web_tools_utilities/http_traffic_generator.html#.UWZQDze3oqA (Accessed on 9th July 2012)
- Zenmap in Nmap – Available at: http://nmap.org/zenmap/ (Accessed on 9th July 2012)
- HyenaeFE – Available at: http://sourceforge.net/projects/hyenae/ (Accessed on 9th July 2012)
