Performance analysis of statistical approaches and NMF approaches for speech enhancement

Author: Ravi Kumar Kandagatla, P. V. Subbaiah
Journal: International Journal of Image, Graphics and Signal Processing @ijigsp
Article in issue: 7 vol.11, 2019.
Free access
Super-Gaussian Based Bayesian Estimators plays significant role in noise reduction. However, the traditional Bayesian Estimators process only DFT spectral amplitude of noisy speech and the phase is left unprocessed. While deriving Bayesian estimators, consideration of phase information provides improved results. The main objective of this paper is twofold. Firstly, the Super-Gaussian based Complex speech coefficients given Uncertain Phase (CUP) based Bayesian estimators are compared under different noise conditions like White noise, Babble noise, Pink noise, Modulated Pink noise, Factory noise, Car noise, Street noise, F16 noise and M109 noise. Secondly, a novel speech enhancement method is proposed by combining CUP estimators with different NMF approaches and online bases updation. The statistical estimators show less effective results under completely non-stationary assumptions. Non-negative Matrix Factorization (NMF) based algorithms show better performance for non stationary noises. The drawback of NMF is, it requires training and/or requires clean speech and noise signals. This drawback can be overcome by taking the advantages of both statistical approaches and NMF approaches. Such approaches like Posteriori Regularized NMF (PR-NMF), Weibull Rayleigh NMF (WR-NMF), Nakagami Rayleigh (NR-NMF), CUP estimator with Gamma and Generalized Gamma distributions + NMF + Online bases Update (CUP-GG + NMF + OU) and CUP-GG + WR-NMF / NR-NMF + OU are considered for comparison. The objective of this paper is to analyze the performance of speech enhancement methods using Bayesian estimators, NMF approaches, Combination of statistical and NMF approaches. The objective performance measures Perceptual Evaluation of Speech Quality (PESQ), Short-Time Objective Intelligibility (STOI), Signal to Noise Ratio (SNR), Signal to Distortion Ratio (SDR), Segmental SNR (Seg SNR) are considered for comparison.
Non-Negative Matrix Factorization, CUP Estimator, Noise Reduction, PESQ
Short address: https://sciup.org/15016065
IDR: 15016065 | DOI: 10.5815/ijigsp.2019.07.02
Text of the scientific article Performance analysis of statistical approaches and NMF approaches for speech enhancement
Published Online July 2019 in MECS DOI: 10.5815/ijigsp.2019.07.02
Speech is an important means for communicating thoughts between person to person / human to machine. But the speech communicated, is affected/corrupted by the noise present in the environment. Speech enhancement is the technique used in reducing noise from corrupted signal. The objective of speech enhancement is twofold in which it can improve quality as well as intelligibility. Quality deals with SNR of the signal and intelligibility deals with how much percent of words will be understood correctly.
Traditional speech enhancement approaches include Minimum Mean Square Error (MMSE) estimators and Bayesian estimators assume the speech Discrete Fourier Transform (DFT) spectral coefficients and noise spectral coefficients as Gaussian distribution [1-2]. Later it is observed that, improved results are obtained by considering Super-Gaussian (Gamma, Rayleigh, Chi, Exponential, Nakagami) distributions rather than assuming Gaussian for speech and noise spectral coefficients [3-,4]. Thus in this work, the comparison of statistical estimators namely Harmonic Regeneration for Noise Reduction (HRNR), Harmonic Regeneration for Noise Reduction with Speech Presence Uncertainty Estimator (HRNR-SPU) is discussed [5]. Traditional Bayesian estimators process only DFT amplitudes and phase is left unprocessed. In enhanced speech signal reconstruction, the unprocessed phase of noisy speech is used [6]. Later in [7] the Bayesian estimators that use phase information for amplitude estimation is derived. It is observed that performance of Bayesian estimators is improved by considering phase information [7-8]. In this work, Super Gaussian based estimators which used phase information like CUP, CUP-NG and CUP-GG are considered for comparison.
It is observed that template based approaches like NMF approach perform better under non-stationary noises. But the disadvantage is that it requires apriori information of speech and noise which is not required in statistical approaches. By combining the advantages of both statistical and NMF approaches, the speech enhancement methods like PR-NMF, WR-NMF and GR NMF are considered for comparison.
In combined approach, the traditional algorithm for speech enhancement [7] is used in first stage. In the second stage, different NMF approaches are considered and combined with online bases update. The performance of proposed method is compared with traditional and recent approaches of speech enhancement.
The paper is organized as follows. In Section II different statistical approaches are discussed. In Section III the variation of NMF approaches are discussed. In Section IV the speech enhancement approach using combination of statistical and NMF approaches with online bases update is discussed. Section V discusses the Results and Section V1 provides conclusion on the paper.
-
II. S tatistical A pproaches for S peech E nhancement
The most traditional statistical approach for speech enhancement is Wiener Filter approach. The gain of the wiener filter is obtained by assuming speech DFT coefficients as Gaussian and under MMSE sense. The gain depends on priori SNR. But the disadvantage is that the calculation of priori SNR of current frame depends on past frame and thus the gain applied to current frame depends on past frame. To overcome this problem, new speech enhancement approaches TSNR and HRNR are proposed in literature. The HRNR approach shows inferior performance under low SNR conditions. Thus in this paper, HRNR method is combined with Speech Presence Uncertainty (SPU) estimator. It is observed that there is performance improvement in HRNR-SPU approach.
The above mentioned approaches process only noisy amplitudes but phase is left unprocessed and the unprocessed noisy phase is considered for reconstruction. It is noted that the above mentioned algorithms work under Gaussian assumption. Later, it is observed that using Super-Gaussian assumption based estimators provide better results as the distribution gives best fit to the data. In this work, Super-Gaussian based estimators are derived by considering phase information and different CUP estimators are taken for comparison [5-8].
The Complex speech coefficients given Uncertain Phase (CUP) estimator is derived by assuming speech as Chi distribution and noise as Gaussian. CUP estimator estimates the amplitude by considering phase information. The phase information of clean speech is estimated by noisy signal phase. Where as in CUP-NG and CUP-GG, it is assumed that noise spectral coefficients follow Generalized Gamma distribution where as speech spectral coefficients follow Nakagami and Gamma respectively [9]. The equations of gain are summarized in table I.
Let s(n) be the clean speech, n(n) be the noise and y(n) be the noisy speech. Assume the additive noise and the noisy speech in STFT domain be Y (k, i), the clean speech S ( k, i) and noise be N ( k, i), then noisy speech can be mathematically represented as
Y ( k , i ) = S ( k , i ) + N ( k , i ) (1)
Where k , i are the indices of frequency and time respectively. The complex spectral coefficients of clean speech, noisy speech and noise are represented as
Where Y , S , W represents the complex spectral coefficients and R, A, N be the amplitudes and e j^Y , ejj>s , в^Б be the phases of noisy speech, clean speech and noise respectively. The priori knowledge of clean speech is estimated from noisy speech using [8]. The estimate of clean speech is obtained using E ( S| Y ^ ) , where ф5 denotes the priori knowledge of the clean speech estimate. Also from [2], it is noted that by taking compressed amplitudes with parameter β provides perceptual benefit in enhancement process. Thus including compressed amplitude and the final estimate of the enhanced speech is obtained by calculating
Si ( e ) = E ( A e e j Ф S | y , ф ) =
J J ' a P e 1 6 sP a ,ф$, y , ф ( a, Ф s | y , ^ s ) d Ф s da 00
By using Bayes rule, the posterior function can be modeled using
P y , a , ф s , Ф s ( У , a ф A )
p A , Ф s|y ф ( a , ^ s| y ф ) =
P y|S ф ( y\a , Ф s , ф ) P.
P y , ф s ( У ф ) ,фД a , Ф s , ф )
Assuming that amplitudes and phases are mutually dependent, then the PDF of amplitudes can be written as
Pa,фs,Фs (a,Фs,^S ) = Pa (a)Pфs,Фs (^s,^s ) = Pa (a) Pф$ф (^s ^s ) Pфs (^s )
By substituting eq.(5) in eq.(4) , the posterior results in
p
P y / s ( y\ a , Ф s ) P a ( a ) p Ф S , ф * (/s , ^ s )
J J P yS ( ya , Ф s ) P a ( a ) p Ф. Ф ( Ф * , Ф * ) dad Ф s
Now assume the speech spectral coefficients PDF pA ( a ) as Gamma, Nakagami and noise spectral coefficients, p^ s( y\a ) , as Gaussian, Generalized Gamma distribution. The resultant estimators gain [see Appendix A, Appendix B for proofs and for information regarding different parameters of gain functions] is obtained as given in Table I.
Table 1. Gain functions of different cup Estimators
|
Estimator |
Gain Equation |
|
|
CUP [8] |
S ( в ) = 1 - - 2 (V 2 P + ^ , |
2n vv , Г ( 2 p + в , { е Ф е-О=; „ И р ( Ф ‘ ф * ) ^Ф’ Г < P X J e^ Dw , . ( , ) p ( ф * ф » ) Ф ° 0 |
|
CUP-NG[9] |
S( в ) = E ( А в е у Ф S | y , ф Г ( 2 k + 2 v + в - 1)( = Г ( 2 k + 2 v - 1 ) k (8) |
$)= 2 n f A 2 ' ( к A-f в A J e j" S exp 1 I exp 1 T I D - ( 2 v +2 k + в -1 ) И p Ф s ф * ( ф * Ф ) dф s 2 + ^p ^-N^^2- |
|
I ^- N - 2 JI 2 П f r. A f и 2 A J exp | I exp | V I D - ( 2 v +2 k -1 ) ( U ) Р Ф;Ф ( Ф * Ф * ) d Ф S 0 V C N J V 2 J |
||
|
CUP-GG[9] |
S ( в ) = E ( А в е Ф S | y , ф _ Г( 2 v + k + в - 1)| = Г ( 2 v + k - 1 ) 1 |
’ ) = 2 n 2 s A -f в ) J e* exp | T I D - (2 v + k + в - 1) U ) РФр Ф ( Ф * Ф * ) d ф S (9) 2 p _o________ V 2 J ________________________________ CT 2 I 2 n ( 2 V N J J exp It I D - (2 v + k - 1) ( u ) p ф, Ф ( Ф * Ф * ) d ф s 0 V 2 J |
-
III. N mf A pproaches for S peech E nhancement
NMF based speech enhancement methods deal well with non-stationary noises. In NMF techniques the priori information is given by assuming statistical distributions of speech and noise. The distributions are selected such that, they provide better fit and less Kullback-Leibler (KL) divergence. The assumption of Gaussian noise suits well as sum of different noises tends to Gaussian (Central Limit Theorem). If DFT coefficients follow Gaussian, then the magnitudes follow Rayleigh distribution. In NMF, the factorization is performed by considering magnitudes. Thus the penalties or priori for noise is assumed as Rayleigh distribution. Similarly speech spectral magnitudes better fit under super Gaussian assumption and here Nakagami and Weibull distributions are assumed. NMF update rules are obtained by gradient descent algorithm which minimizes Kullback-Leibler divergence. The complete algorithm of posterior regularized NMF is given below.
Basically in NMF analysis, the STFT magnitudes of noisy speech, i.e., a spectrogram matrix X of M rows and N columns is factorized into product of two matrices (Note that M , N also indicates the no. of frequency bins and frames respectively). The two matrices contain nonnegative elements and let the two matrices be W (Bases Matrix) and H (Encoding Matrix). Here W is a matrix of size M rows and r columns and H is a matrix of size r rows and N columns, where r is the sum of number of speech ( r ) and noise ( r ) bases. Each of W, H individually contains speech and noise components. They are represented mathematically as W = [WsWn ] ,
H = [ HTSHT T ] , where size of W , H matrices is M x ( r + r ) , where suffixes indicate speech and noise.
Let s ( n ) the clean speech, n ( n ) be the noise and x ( n ) be the noisy speech. For better fit, the noise PDF coefficients are modeled by Rayleigh prior distribution. The Rayleigh PDF is given as
- X 2
f ( x—)=Ae 2- 2 —
Here the parameter CT is estimated by using Maximum likelihood parameter estimation and it would be given as
1 N
7 2 =--Xx22 N £ 1
Speech Enhancement Algorithm using WR-NMF (Weibull Rayleigh NMF)
Apply negative logarithm on both sides
X g >f x t , % Observed normalized data
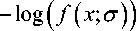
—log (f (x;7)) = — log
— x
N S
—
Number of sources
1 ( x Y xx
—log 1771+577 к 7 J 1 7
Л S ( New )
= 0
Thus, the penalty/regularization considered noise magnitudes prior distribution is
with the
Л =Л
S1
X2
N(old) = 2 72
—
Л N = Л S 1 =
Л S 2 = Л SP ( old ) =
x 2 ( x ) (13)
. . — log I 77 I
1 7 к 7 J
where, 8 = 0.68
* \8
x
X ,
—
log
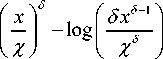
8 ( X S 2 )
X
The magnitudes of the speech signal are better fit by assuming powerful Weibull distribution from [3]. It can be shown that the smoothed KL divergence error is less for Weibull than the other distributions. Thus magnitudes of speech signal is modeled using Weibull distribution with adjustable scale parameter as
Repeat
For all s do л s (old) ^ exp{—As}, % Update penalties using LMS (22)
8 ( x
X к X
exp
—
I X
With the estimated scale parameter as
X =
^s
\ Г(1 + 2/8)
Where ^ ( k ) = E \Xk |2
, x > 0 (14)
End For
, (here k is frequency bin
which is omitted in formula). The regularization / penalty term for the speech sample is obtained by taking the negative logarithm on both sides.
Л SP = Л s 2 =
8 x 8 — 1 )
X
, x > 0
End For
The proposed algorithm is implemented with the following step by step process. Here the Weibull distribution is used and can replace the same with Nakagami to implement Nakagami Rayleigh NMF (NR-NMF).
For all s do
|
Л S =( 1 ^ ) Л s ( old ) + Д ^ s ( New ) |
(23) |
|
Л s ( old ) = Л s ( New ) |
(24) |
|
X s ^ X A s |
(25) |
|
r ^ Z ( w. > HM) ^ . s |
(26) |
|
z ^ X s- г |
(27) |
|
ZHT W ^ W s ( s ) ( s ) ( s ) 1hT> ( s ) |
(28) |
|
H ( • H») ( WHZ s ) |
(29) |
Reconstruction
For all s do
W ( s ) H ( s )
Ms <--———, % Computes the Filter s WH
X ^ MX, % Filter Mixture ss (31)
xs ^ ISTFT ( Xs , XX , P ) %P-STFT parameters (32)
А. =Л
S 1
ˆ 2
XS 1
N ( old )
— log
S 1
r2
Update x
I ^
Г ( 1 + 2/ S )
Л, =Л
S 2
■ SP ( old )
- 4 s
'
x
—
log
S ( XXS2 )
x
Where, ^ ( k ) = E [| Xk |2 J
Л s ( New ) = exp ( —Л s ( old ) ) (36)
End For
End update
Untill Convergence
Return: Time domain signals x
The above mentioned algorithm is completely described with the help of Block diagram as shown in Fig.1
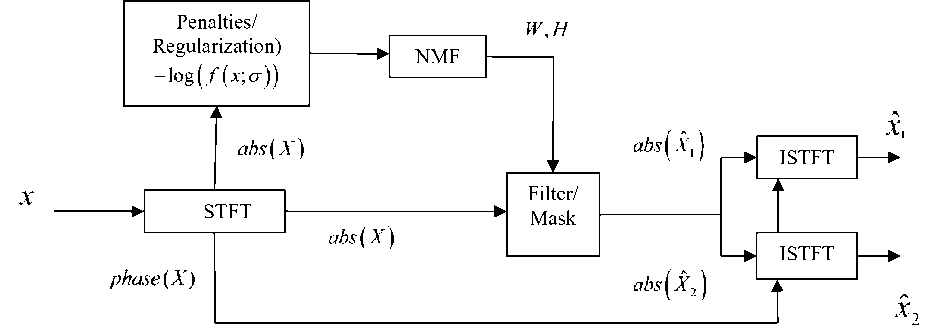
Fig.1. Block Diagram for Posteriori Regularization Based Speech Enhancement
Table 2. Different distributions and its negative logarithms in mathematical form
PDF f (x ;r)
Parameters
Nakagami
9 U .AU
[ P_ I 2 ц —1
г ( ц\ r 2 J
( Ц 2 exp I-- ^ x
V r
—
Wiebull
Regularization or penalty
, , Г x 2 и
— ( 2 ц — 1 ) log x + I V r
Ц < 1 allows Super- Gaussian
I I x V x J
Rayleigh
— x
2L ex r2
Г exp

S = 0.68
n
2 1 2
Г =-L xv n l:1
^
\] г(1 + 2/S)
X $ ( k ) : E [| X k f ]
N r2 : x2
2 N f 1
In the first step of Fig, 1, Short Time Fourier Transform (STFT) is applied and the distributions of magnitude spectral coefficients are assumed. Negative logarithms of assumed distributions are considered for providing regularization with NMF approach
-
IV. C ombination O f N ovel E stimator A nd NMF A pproach F or S peech E nhancement
The proposed speech enhancement process is performed in two steps. In the first step, the speech enhancement method proposed in [12] is used to enhance the noisy speech. In the later stage, the NMF with online bases update is used for further processing. The added feature in this method is estimating the gain using novel phase based CUP estimator. The complete process of proposed method is shown in Fig.2. The estimated speech S ˆ and N ˆ is obtained using
Where the basis matrix and weight matrix updates are obtained with KL divergence as follows
ZHT
W wn -Ц(^
( s ) ( s ) 1H T.
( s )
h ^ hJwAzJ
( s ) ( s )\ ( s ) s/
In β-NMF, the update is done as follows
W T [ ( WH ) . ( e -2 ) V ]
H ^ H . WT [ WH ]^ e - 1 )
Г ( wh ) . ( e - 2 ) v 1 ht W ^ W .L----^r^--
[ WH ] . ( e - 1 ) H T
HRNR – The Harmonic Regeneration for Noise Reduction, is one in which the gain depends on priori SNR. The priori SNR is calculated such that the current frame priori SNR depends on current samples. A non linear function is used for generating harmonics artificially.
HRNR-SPU - The HRNR gain is modified according to Speech Presence Uncertainty estimator Gain.
PR-NMF - It is the Posterior Regularized NMF technique. In this the importance of regularization in NMF approach is discussed in [11 ].
WR-NMF - It is similar to PR-NMF approach, but regularization is provided by assuming magnitudes of speech and noise as Weibull and Rayleigh distributions respectively and negative logarithm of assumed distributions is used for providing regularization.
CUP Estimator - It is derived under statistical assumption that speech spectral coefficients follow Chi distribution and noise spectral coefficients follow Gaussian distribution.
CUP- NG Estimator- It is derived under statistical assumption that speech spectral coefficients follow Nakagami distribution and noise spectral coefficients follow Generalized Gamma distribution.
CUP-GG Estimator - It is derived under statistical assumption that speech spectral coefficients follow Gamma distribution and noise spectral coefficients follow Generalized Gamma distribution
SE+NMF+OU- It is the cascade of Speech Enhancement (A highly Non-Stationary Speech Enhancement) and NMF approach with online bases update.
SE+NMF+CUP-GG+OU - CUP estimator is used in the second stage of SE+NMF+OU
SE+β-NMF+CUP-GG+OU - It is same as SE+NMF+ CUP-GG+OU and the NMF variant β-NMF is used.
SE+WR-NMF+CUP-GG+OU - In the approach SE+NMF+CUP-GG+OU the NMF is modified as WR-NMF
SE+NR-NMF+CUP-GG+OU-In the approach SE+NMF+CUP-GG+OU the NMF is modified as NR-NMF.
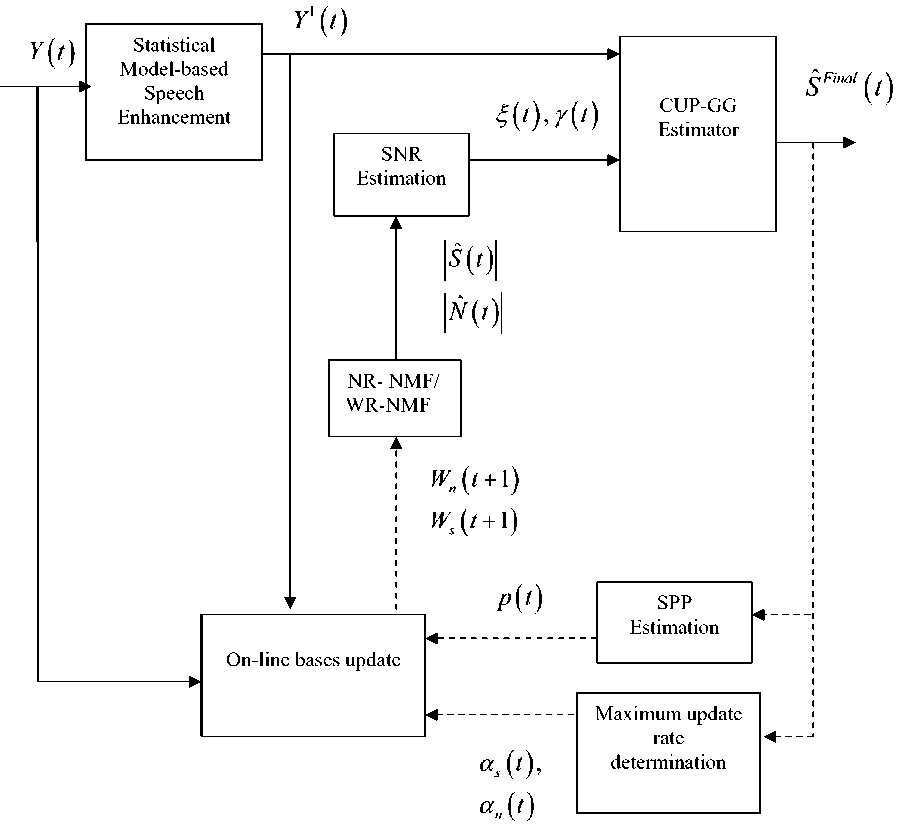
Fig.2. Block Diagram for Proposed Method
-
V. R esult A nalysis
The performance evaluation of the proposed methods Bayesian estimators and different NMF approaches is implemented by taking the speech samples from NOIZEUS speech corpus data base. Out of 30 sentences considered, 15 sentences were spoken by male speakers and 15 sentences were spoken by female speakers and the signals are corrupted additively under different noise environments. In analysis and synthesis of signal, Hanning window with 75% overlap is considered. In this work, white, pink and babble noise are taken from Noisex Database and corrupted with the clean speech signals of NOIZEUS database at different input SNRs of -10 dB, -5 dB, 0 dB, 5 dB, 10 dB, 15 dB. The objective performance measures Perceptual Evaluation of Speech Quality (PESQ) and Short Time Objective Intelligibility (STOI) is considered for comparison of different speech enhancement methods. For better evaluation, ∆PESQ and % Improvement in STOI are considered for comparison. ∆PESQ is obtained by taking the difference between the PESQ measured between enhanced speech, clean speech and clean speech, noisy speech. % STOI is measured as the percentage of improvement in STOI value when STOI value of clean speech, noisy speech is compared with STOI value of clean speech, enhanced speech.
Performance evaluation of speech enhanced methods HRNR, HRNR-SPU, CUP, CUP-GG, CUP-NG, NMF+OU,SE+CUP+WR/NRNMF+OU, is discussed and performance comparison is given in Table 3 to Table 29.
Table 3. comparison of Average PESQ, ∆PESQ performance measures for the 30 speech signals corrupted by white noise under Input SNRs of -10 dB, -5dB, 0dB, 5 dB, 10 dB, 15 dB
|
Input SNR in dB Method |
Performance Measure |
-10 |
-5 |
0 |
5 |
10 |
15 |
|
Without Processing |
PESQ |
1.35 |
1.45 |
1.33 |
1.92 |
2.08 |
2.27 |
|
SE+CUP-GG+NR-NMF+OU |
PESQ |
1.64 |
2.01 |
2.51 |
3.17 |
3.27 |
3.41 |
|
∆ PESQ |
0.29 |
0.56 |
1.18 |
1.25 |
1.19 |
1.14 |
|
|
SE+CUP-GG+WR-NMF+OU |
PESQ |
1.62 |
1.96 |
2.55 |
3.14 |
3.25 |
3.39 |
|
∆ PESQ |
0.27 |
0.51 |
1.19 |
1.22 |
1.17 |
1.12 |
|
|
SE+CUP-GG+β-NMF+OU |
PESQ |
1.6 |
1.93 |
2.52 |
3.13 |
3.23 |
3.38 |
|
∆ PESQ |
0.25 |
0.48 |
1.19 |
1.21 |
1.15 |
1.11 |
|
|
SE+CUP GG+NMF[9] |
PESQ |
1.58 |
1.94 |
2.49 |
3.11 |
3.19 |
3.39 |
|
∆ PESQ |
0.23 |
0.49 |
1.16 |
1.19 |
1.11 |
1.12 |
|
|
NMF+OU[12] |
PESQ |
1.52 |
1.86 |
2.11 |
2.69 |
2.83 |
2.99 |
|
∆ PESQ |
0.17 |
0.41 |
0.78 |
0.77 |
0.75 |
0.72 |
|
|
CUP-GG[9] |
PESQ |
1.54 |
1.91 |
2.25 |
2.9 |
2.99 |
3.16 |
|
∆ PESQ |
0.19 |
0.46 |
0.92 |
0.98 |
0.91 |
0.89 |
|
|
CUP-NG[9] |
PESQ |
1.52 |
1.88 |
2.17 |
2.8 |
2.9 |
3.03 |
|
∆ PESQ |
0.17 |
0.43 |
0.84 |
0.88 |
0.82 |
0.76 |
|
|
CUP[8] |
PESQ |
1.49 |
1.84 |
2.06 |
2.67 |
2.79 |
2.96 |
|
∆ PESQ |
0.14 |
0.39 |
0.73 |
0.75 |
0.71 |
0.69 |
|
|
WR NMF[14] |
PESQ |
1.54 |
1.74 |
2.01 |
2.61 |
2.7 |
2.88 |
|
∆ PESQ |
0.19 |
0.29 |
0.68 |
0.69 |
0.62 |
0.61 |
|
|
NR NMF[14] |
PESQ |
1.52 |
1.7 |
1.84 |
2.48 |
2.6 |
2.76 |
|
∆ PESQ |
0.17 |
0.25 |
0.51 |
0.56 |
0.52 |
0.49 |
|
|
PR NMF[11] |
PESQ |
1.5 |
1.6 |
1.75 |
2.28 |
2.46 |
2.61 |
|
∆ PESQ |
0.15 |
0.15 |
0.42 |
0.36 |
0.38 |
0.34 |
|
|
HRNR-SPU[13] |
PESQ |
1.46 |
1.68 |
1.86 |
2.45 |
2.56 |
2.7 |
|
∆ PESQ |
0.11 |
0.23 |
0.53 |
0.53 |
0.48 |
0.43 |
|
|
HRNR[5] |
PESQ |
1.44 |
1.62 |
1.78 |
2.35 |
2.45 |
2.61 |
|
∆ PESQ |
0.09 |
0.17 |
0.45 |
0.43 |
0.37 |
0.34 |
Table 4. Comparison of Average STOI, % STOI performance measures for the 30 speech signals corrupted by white noise under Input SNRs of -10 B, -5dB, 0 dB, 5 dB, 10 dB, 15 dB
|
Input SNR in dB Method |
Performance Measure |
-10 |
-5 |
0 |
5 |
10 |
15 |
|
Without Processing |
STOI |
0.4602 |
0.5902 |
0.7273 |
0.7816 |
0.9296 |
0.9435 |
|
SE+CUP-GG+NR- |
% STOI |
7.15 |
6.04 |
3.76 |
2.64 |
2.04 |
1.12 |
|
NMF+OU |
STOI |
0.4885 |
0.6243 |
0.7525 |
0.8013 |
0.9462 |
0.9509 |
|
SE+CUP-GG+WR- |
% STOI |
6.16 |
5.78 |
3.47 |
2.52 |
1.79 |
0.79 |
|
NMF+OU |
STOI |
0.4885 |
0.6243 |
0.7525 |
0.8013 |
0.9462 |
0.9509 |
|
SE+CUP-GG+β-NMF+OU |
% STOI |
6.23 |
5.76 |
3.52 |
2.43 |
1.87 |
0.78 |
|
STOI |
0.4889 |
0.6242 |
0.7529 |
0.8006 |
0.9469 |
0.9508 |
|
|
SE+CUP GG+NMF[9] |
% STOI |
7.12 |
5.97 |
3.68 |
2.56 |
1.98 |
0.97 |
|
STOI |
0.493 |
0.6254 |
0.7541 |
0.8016 |
0.9480 |
0.9527 |
|
|
NMF+OU[12] |
% STOI |
4.25 |
3.35 |
3.24 |
1.32 |
0.89 |
0.75 |
|
STOI |
0.4798 |
0.61 |
0.7509 |
0.7919 |
0.9378 |
0.9506 |
|
|
CUP-GG[9] |
% STOI |
5.21 |
4.87 |
3.45 |
1.99 |
1.57 |
0.67 |
|
STOI |
0.4842 |
0.6189 |
0.748 |
0.7971 |
0.9441 |
0.9498 |
|
|
CUP-NG[9] |
% STOI |
4.76 |
3.95 |
3.46 |
1.45 |
1.32 |
0.87 |
|
STOI |
0.4821 |
0.6135 |
0.7525 |
0.7929 |
0.9418 |
0.9517 |
|
|
CUP[8] |
% STOI |
3.78 |
3.05 |
2.89 |
0.98 |
0.69 |
0.47 |
|
STOI |
0.4623 |
0.5937 |
0.7326 |
0.7877 |
0.9382 |
0.9524 |
|
|
WR NMF[14] |
% STOI |
2.91 |
2.62 |
2.23 |
1.09 |
0.87 |
0.25 |
|
STOI |
0.4736 |
0.6057 |
0.7435 |
0.7901 |
0.9376 |
0.9458 |
|
|
NR NMF[14] |
% STOI |
2.89 |
2.47 |
2.12 |
1.14 |
0.98 |
0.23 |
|
STOI |
0.4735 |
0.6048 |
0.7427 |
0.7905 |
0.9387 |
0.9456 |
|
|
PR NMF[11] |
% STOI |
1.82 |
1.52 |
1.28 |
0.47 |
0.35 |
0.26 |
|
STOI |
0.4686 |
0.5992 |
0.7366 |
0.7852 |
0.9328 |
0.9459 |
|
|
HRNR-SPU[13] |
% STOI |
-1.9 |
-1.62 |
-1.12 |
-1.45 |
-1.02 |
-0.92 |
|
STOI |
0.4515 |
0.5806 |
0.7192 |
0.7702 |
0.9201 |
0.9348 |
|
|
HRNR[5] |
% STOI |
-2.21 |
-1.76 |
-1.27 |
-1.56 |
-1.18 |
-1.03 |
|
STOI |
0.45 |
0.5798 |
0.7181 |
0.7694 |
0.9186 |
0.9337 |
Table 5. Comparison of Average SNR, SDR, Segmental SNR performance measures for the 30 speech signals corrupted by white noise under Input SNRs of -10 dB, -5dB, 0dB, 5 dB, 10 dB, 15 dB
|
Input SNR in dB Method |
Performance Measure |
-10 |
-5 |
0 |
5 |
10 |
15 |
|
SE+CUP-GG+NR-NMF+OU |
SNR |
4.81 |
6.94 |
9.34 |
15.79 |
19.04 |
23.38 |
|
SDR |
4.5 |
4.8 |
9.4 |
15.2 |
18.5 |
22.5 |
|
|
Seg SNR |
3.79 |
5.94 |
7.73 |
12.23 |
16.13 |
20.78 |
|
|
SE+CUP-GG+WR-NMF+OU |
SNR |
4.62 |
6.91 |
9.15 |
15.43 |
18.63 |
23.45 |
|
SDR |
4.68 |
5.1 |
9.2 |
14.8 |
18.3 |
22.2 |
|
|
Seg SNR |
3.83 |
5.89 |
7.58 |
11.98 |
15.95 |
20.14 |
|
|
SE+CUP-GG+β-NMF+OU |
SNR |
4.53 |
6.93 |
8.76 |
14.65 |
18.12 |
23.09 |
|
SDR |
3.9 |
5.4 |
8..9 |
14.2 |
17.9 |
22.6 |
|
|
Seg SNR |
3.71 |
5.78 |
7.25 |
11.76 |
15.42 |
19.93 |
|
|
SE+CUP GG+NMF[9] |
SNR |
4.21 |
6.83 |
8.15 |
14.21 |
17.97 |
23.12 |
|
SDR |
3.4 |
5.3 |
8.6 |
13..8 |
17.5 |
22.2 |
|
|
Seg SNR |
3.81 |
5.98 |
7.12 |
11.54 |
15.23 |
19.87 |
|
|
NMF+OU[12] |
SNR |
2.51 |
4.69 |
6.58 |
12.62 |
16.54 |
20.56 |
|
SDR |
1.8 |
3.68 |
5.69 |
11.53 |
15.69 |
19.56 |
|
|
Seg SNR |
1.32 |
3.05 |
4.95 |
10.25 |
14.41 |
18.36 |
|
|
CUP-GG[9] |
SNR |
3.97 |
6.13 |
7.95 |
13.87 |
17.89 |
22.68 |
|
SDR |
2.9 |
4.8 |
7.9 |
12.1 |
16.6 |
21.6 |
|
|
Seg SNR |
3.67 |
5.87 |
6.98 |
10.98 |
14.98 |
19.11 |
|
|
CUP-NG[9] |
SNR |
2.96 |
5.02 |
7.98 |
13.21 |
17.69 |
22.87 |
|
SDR |
2.3 |
4.4 |
7.1 |
11.8 |
16.1 |
21.2 |
|
|
Seg SNR |
2.29 |
4.87 |
6.92 |
10.77 |
14.67 |
19.03 |
|
|
CUP[8] |
SNR |
2.36 |
4.89 |
7.23 |
12.15 |
16.94 |
21.98 |
|
SDR |
1.9 |
4.2 |
6.8 |
11.65 |
15.6 |
19.5 |
|
|
Seg SNR |
1.83 |
3.12 |
6.36 |
10.23 |
14.76 |
18.78 |
|
|
NR-NMF[14] |
SNR |
-1.34 |
1.78 |
7.23 |
13.87 |
17.68 |
22.34 |
|
SDR |
-1.8 |
-1.1 |
6.8 |
12.7 |
16.6 |
19.8 |
|
|
Seg SNR |
-1.98 |
-1.32 |
4.78 |
9.02 |
15.76 |
18.79 |
|
|
WR-NMF[14] |
SNR |
-1.63 |
1.35 |
6.42 |
11.37 |
17.02 |
22.21 |
|
SDR |
-1.8 |
-0.6 |
5.5 |
11.6 |
15.8 |
21 |
|
|
Seg SNR |
-2.32 |
-1.42 |
4.03 |
8.42 |
14.15 |
18.95 |
|
|
PR NMF [11] |
SNR |
-1.91 |
1.23 |
4.42 |
9.34 |
15.12 |
21.32 |
|
SDR |
-2.1 |
-1.1 |
4.2 |
8.9 |
13.9 |
19.5 |
|
|
Seg SNR |
-2.7 |
-1.47 |
3.14 |
7.21 |
12.43 |
17.52 |
|
|
HRNR-SPU [13] |
SNR |
1.98 |
1.89 |
4.32 |
9.12 |
14.46 |
19.76 |
|
SDR |
1.24 |
1.68 |
2.67 |
8.1 |
13.4 |
18.2 |
|
|
Seg SNR |
0.34 |
1.34 |
2.12 |
6.32 |
11.68 |
17.87 |
|
|
HRNR[5] |
SNR |
1.21 |
1.78 |
2.62 |
7.98 |
14.23 |
18.65 |
|
SDR |
0.94 |
1.54 |
2.56 |
7.6 |
12.3 |
17.2 |
|
|
Seg SNR |
0.13 |
1.02 |
1.78 |
5.15 |
10.69 |
16.56 |
Table 6. .Comparison of Average PESQ, ∆PESQ performance measures for the 30 speech signals corrupted by Babble noise under Input SNRs of -10 dB, -5dB, 0dB, 5 dB, 10 dB, 15 dB
|
Input SNR in dB Method |
Performance Measure |
-10 |
-5 |
0 |
5 |
10 |
15 |
|
Without Processing |
PESQ |
1.24 |
1.35 |
1.79 |
2.11 |
2.41 |
2.58 |
|
SE+CUP-GG+NR-NMF+OU |
PESQ |
1.53 |
1.78 |
2.61 |
2.9 |
3.16 |
3.3 |
|
∆ PESQ |
0.29 |
0.43 |
0.82 |
0.79 |
0.75 |
0.72 |
|
|
SE+CUP-GG+WR-NMF+OU |
PESQ |
1.49 |
1.74 |
2.5 |
2.86 |
3.13 |
3.27 |
|
∆ PESQ |
0.25 |
0.39 |
0.71 |
0.75 |
0.72 |
0.69 |
|
|
SE+CUP-GG+β-NMF+OU |
PESQ |
1.24 |
1.73 |
2.44 |
2.8 |
3.06 |
3.22 |
|
∆ PESQ |
0.26 |
0.38 |
0.65 |
0.69 |
0.65 |
0.64 |
|
|
SE+CUP GG+NMF[9] |
PESQ |
1.45 |
1.69 |
2.41 |
2.76 |
3.07 |
3.22 |
|
∆ PESQ |
0.21 |
0.34 |
0.62 |
0.65 |
0.66 |
0.64 |
|
|
NMF+OU[12] |
PESQ |
1.32 |
1.53 |
2.26 |
2.54 |
2.89 |
2.97 |
|
∆ PESQ |
0.08 |
0.18 |
0.47 |
0.43 |
0.48 |
0.39 |
|
|
CUP-GG[9] |
PESQ |
1.41 |
1.63 |
2.36 |
2.69 |
3 |
3.11 |
|
∆ PESQ |
0.17 |
0.28 |
0.57 |
0.58 |
0.59 |
0.53 |
|
|
CUP-NG[9] |
PESQ |
1.37 |
1.61 |
2.26 |
2.65 |
2.97 |
3.08 |
|
∆ PESQ |
0.13 |
0.26 |
0.47 |
0.54 |
0.56 |
0.5 |
|
|
CUP[8] |
PESQ |
1.31 |
1.5 |
2.2 |
2.55 |
2.88 |
3 |
|
∆ PESQ |
0.07 |
0.15 |
0.41 |
0.44 |
0.47 |
0.42 |
|
|
WR NMF[14] |
PESQ |
1.41 |
1.61 |
2.24 |
2.63 |
2.91 |
3.06 |
|
∆ PESQ |
0.17 |
0.26 |
0.45 |
0.52 |
0.5 |
0.48 |
|
|
NR NMF[14] |
PESQ |
1.36 |
1.57 |
2.22 |
2.61 |
2.89 |
3.04 |
|
∆ PESQ |
0.12 |
0.22 |
0.43 |
0.5 |
0.48 |
0.46 |
|
|
PR NMF[11] |
PESQ |
1.34 |
1.53 |
2.17 |
2.54 |
2.83 |
2.97 |
|
∆ PESQ |
0.1 |
0.18 |
0.38 |
0.43 |
0.42 |
0.39 |
|
|
HRNR-SPU[13] |
PESQ |
1.32 |
1.53 |
2.16 |
2.45 |
2.73 |
2.84 |
|
∆ PESQ |
0.08 |
0.18 |
0.37 |
0.34 |
0.32 |
0.26 |
|
|
HRNR[5] |
PESQ |
1.27 |
1.5 |
2.1 |
2.4 |
2.68 |
2.77 |
|
∆ PESQ |
0.03 |
0.15 |
0.31 |
0.29 |
0.27 |
0.19 |
Table 7. Comparison of Average STOI, % STOI performance measures for the 30 speech signals corrupted by Babble noise under Input SNRs of -10 dB, -5dB, 0dB, 5 dB, 10 dB, 15 dB
|
Input SNR in dB Method |
Performance Measure |
-10 |
-5 |
0 |
5 |
10 |
15 |
|
Without Processing |
STOI |
0.3352 |
0.5612 |
0.6186 |
0.7761 |
0.8629 |
0.9336 |
|
SE+CUP-GG+NR- |
% STOI |
3.22 |
4.36 |
3.15 |
2.21 |
1.66 |
0.54 |
|
NMF+OU |
STOI |
0.346 |
0.5857 |
0.6381 |
0.7932 |
0.8772 |
0.9386 |
|
SE+CUP-GG+WR- |
% STOI |
3.18 |
4.32 |
3.18 |
2.16 |
1.68 |
0.59 |
|
NMF+OU |
STOI |
0.3458 |
0.5854 |
0.6383 |
0.7929 |
0.8774 |
0.9391 |
|
SE+CUP-GG+β-NMF+OU |
% STOI |
3.14 |
4.24 |
3.12 |
2.11 |
1.66 |
0.61 |
|
STOI |
0.3457 |
0.585 |
0.6379 |
0.7925 |
0.8772 |
0.9393 |
|
SE+CUP GG+NMF[9] |
% STOI |
1.98 |
1.45 |
1.37 |
1.41 |
0.96 |
0.65 |
|
STOI |
0.3418 |
0.5693 |
0.6271 |
0.7870 |
0.8712 |
0.9397 |
|
|
NMF+OU[12] |
% STOI |
1.87 |
1.23 |
1.11 |
1.01 |
0.89 |
0.57 |
|
STOI |
0.3415 |
0.5681 |
0.6255 |
0.7839 |
0.8706 |
0.9389 |
|
|
CUP-GG[9] |
% STOI |
-0.02 |
-0.01 |
0.09 |
0.06 |
0.05 |
0.03 |
|
STOI |
0.3351 |
0.5611 |
0.6192 |
0.7766 |
0.8633 |
0.9339 |
|
|
CUP-NG[9] |
% STOI |
-0.35 |
-0.19 |
-0.01 |
0.37 |
0.24 |
0.01 |
|
STOI |
0.3340 |
0.5601 |
0.6185 |
0.7789 |
0.8649 |
0.9337 |
|
|
CUP[8] |
% STOI |
-1.09 |
-0.62 |
-0.17 |
0.25 |
0.15 |
0.02 |
|
STOI |
0.3315 |
0.5577 |
0.6176 |
0.7780 |
0.8642 |
0.9338 |
|
|
WR NMF[14] |
% STOI |
1.32 |
1.13 |
0.78 |
0.65 |
0.34 |
0.12 |
|
STOI |
0.3396 |
0.5675 |
0.6234 |
0.7811 |
0.8658 |
0.9347 |
|
|
NR NMF[14] |
% STOI |
1.23 |
1.11 |
0.72 |
0.58 |
0.24 |
0.09 |
|
STOI |
0.3393 |
0.5674 |
0.6231 |
0.7806 |
0.865 |
0.9344 |
|
|
PR NMF[11] |
% STOI |
0.98 |
0.87 |
0.67 |
0.21 |
0.11 |
0.08 |
|
STOI |
0.3385 |
0.5661 |
0.6227 |
0.7777 |
0.8638 |
0.9343 |
|
|
HRNR-SPU[13] |
% STOI |
-2.12 |
-1.96 |
-1.33 |
-1.61 |
-1.18 |
-1.15 |
|
STOI |
0.3281 |
0.5502 |
0.6104 |
0.7636 |
0.8527 |
0.9229 |
|
|
HRNR[5] |
% STOI |
-2.67 |
-2.13 |
-1.98 |
-1.79 |
-1.27 |
-1.21 |
|
STOI |
0.3262 |
0.5492 |
0.6063 |
0.7622 |
0.8519 |
0.9223 |
Table 8.Comparison of Average STOI, % STOI performance measures for the 30 speech signals corrupted by Babble noise under Input SNRs of -10 dB, -5dB, 0dB, 5 dB, 10 dB, 15 dB
|
Input SNR in dB Method |
Performance Measure |
-10 |
-5 |
0 |
5 |
10 |
15 |
|
SE+CUP-GG+NR-NMF+OU |
SNR |
4.35 |
7.65 |
10.06 |
11.86 |
15.86 |
20.84 |
|
SDR |
4.02 |
6.45 |
8.98 |
10.25 |
13.62 |
18.21 |
|
|
Seg SNR |
3.62 |
5.85 |
7.68 |
9.75 |
12.78 |
16.54 |
|
|
SE+CUP-GG+WR-NMF+OU |
SNR |
4.12 |
6.34 |
8.78 |
10.12 |
13.48 |
19.78 |
|
SDR |
3.56 |
5.87 |
8.84 |
10.14 |
13.54 |
18.03 |
|
|
Seg SNR |
3.45 |
5.68 |
7.65 |
9.94 |
12.86 |
16.23 |
|
|
SE+CUP-GG+β-NMF+OU |
SNR |
4.34 |
6.89 |
8.9 |
10.23 |
13.65 |
18.66 |
|
SDR |
3.45 |
5.76 |
8.56 |
9.89 |
13.27 |
17.76 |
|
|
Seg SNR |
3.26 |
5.69 |
7.35 |
9.85 |
12.82 |
15.87 |
|
|
SE+CUP GG+NMF[9] |
SNR |
3.56 |
6.21 |
8.23 |
9.65 |
12.58 |
18.43 |
|
SDR |
3.23 |
6.24 |
8.41 |
9.75 |
12.98 |
17.54 |
|
|
Seg SNR |
3.03 |
5.43 |
6.92 |
9.17 |
12.36 |
15.38 |
|
|
NMF+OU[12] |
SNR |
3.16 |
3.98 |
7.45 |
8.89 |
12.95 |
17.54 |
|
SDR |
2.87 |
3.24 |
7.48 |
8.62 |
12.23 |
14.85 |
|
|
Seg SNR |
2.54 |
4.21 |
6.21 |
8.17 |
11.56 |
13.89 |
|
|
CUP-GG[9] |
SNR |
3.11 |
5.98 |
7.95 |
9.12 |
12.24 |
17.98 |
|
SDR |
2.97 |
3.56 |
7.79 |
8.94 |
12.86 |
15.74 |
|
|
Seg SNR |
2.98 |
5.11 |
6.8 |
8.97 |
12.11 |
14.65 |
|
|
CUP-NG[9] |
SNR |
3.15 |
4.56 |
7.89 |
9.65 |
13.14 |
17.85 |
|
SDR |
2.98 |
3.38 |
7.56 |
8.89 |
12.78 |
15.56 |
|
|
Seg SNR |
2.19 |
4.11 |
6.45 |
8.42 |
11.43 |
13.71 |
|
|
CUP[8] |
SNR |
3.05 |
3.45 |
7.65 |
9.24 |
12.89 |
17.14 |
|
SDR |
2.76 |
3.15 |
7.11 |
8.56 |
12.43 |
15.13 |
|
|
Seg SNR |
1.64 |
2.35 |
5.97 |
8.15 |
11.32 |
13.57 |
|
|
NR-NMF[14] |
SNR |
1.56 |
3.67 |
6.21 |
8.68 |
13.12 |
15.85 |
|
SDR |
0.76 |
2.46 |
5.67 |
7.89 |
12.03 |
14.87 |
|
|
Seg SNR |
-2.67 |
-0.85 |
3.02 |
6.51 |
10.65 |
13.21 |
|
|
WR-NMF[14] |
SNR |
1.24 |
3.58 |
5.87 |
8.76 |
12.98 |
15.53 |
|
SDR |
0.16 |
2.14 |
5.45 |
7.57 |
12.24 |
14.98 |
|
|
Seg SNR |
-3.22 |
-1.28 |
2.45 |
5.08 |
10.45 |
13.01 |
|
|
PR NMF [11] |
SNR |
0.08 |
2.17 |
4.23 |
7.52 |
11.34 |
14.25 |
|
SDR |
-2.31 |
1.23 |
3.67 |
7.59 |
10.89 |
12.97 |
|
|
Seg SNR |
-3.56 |
-1.54 |
2.12 |
4.87 |
9.45 |
12.02 |
|
|
HRNR-SPU [13] |
SNR |
-4.12 |
-1.34 |
-1.21 |
5.21 |
11.54 |
12.89 |
|
SDR |
-6.54 |
-3.85 |
-0.98 |
2.98 |
6.24 |
12.25 |
|
|
Seg SNR |
-9.03 |
-3.62 |
-1.32 |
2.78 |
6.87 |
9.85 |
|
|
HRNR[5] |
SNR |
-5.42 |
-1.98 |
-0.12 |
5.36 |
10.59 |
12.21 |
|
SDR |
-7.45 |
-2.76 |
-0.28 |
2.69 |
9.87 |
11.41 |
|
|
Seg SNR |
-9.82 |
-4.51 |
-1.41 |
2.05 |
5.87 |
9.14 |
Table 9.Comparison of Average PESQ, ∆PESQ performance measures for the 30 speech signals corrupted by Pink noise under Input SNRs of -10 dB, -5dB, 0dB, 5 dB, 10 dB, 15 dB
|
Input SNR in dB Method |
Performance Measure |
-10 |
-5 |
0 |
5 |
10 |
15 |
|
Without Processing |
PESQ |
1.13 |
1.43 |
1.8 |
2.05 |
2.27 |
2.55 |
|
SE+CUP-GG+NR-NMF+OU |
PESQ |
1.42 |
2.22 |
2.82 |
3.01 |
3.15 |
3.36 |
|
∆PESQ |
0.29 |
0.79 |
1.02 |
0.96 |
0.88 |
0.81 |
|
|
SE+CUP-GG+WR-NMF+OU |
PESQ |
1.4 |
2.05 |
2.77 |
2.97 |
3.13 |
3.34 |
|
∆PESQ |
0.27 |
0.62 |
0.97 |
0.92 |
0.86 |
0.79 |
|
|
SE+CUP-GG+β-NMF+OU |
PESQ |
1.38 |
1.99 |
2.76 |
3 |
3.2 |
3.37 |
|
∆PESQ |
0.25 |
0.56 |
0.96 |
0.95 |
0.93 |
0.82 |
|
|
SE+CUP GG+NMF[9] |
PESQ |
1.35 |
1.92 |
2.64 |
2.87 |
3.09 |
3.34 |
|
∆PESQ |
0.22 |
0.49 |
0.84 |
0.82 |
0.82 |
0.79 |
|
|
NMF+OU[12] |
PESQ |
1.25 |
1.8 |
2.47 |
2.7 |
2.9 |
3.15 |
|
∆PESQ |
0.12 |
0.37 |
0.67 |
0.65 |
0.63 |
0.6 |
|
|
CUP-GG[9] |
PESQ |
1.3 |
1.86 |
2.59 |
2.83 |
3.03 |
3.2 |
|
∆PESQ |
0.17 |
0.43 |
0.79 |
0.78 |
0.76 |
0.65 |
|
|
CUP-NG[9] |
PESQ |
1.27 |
1.84 |
2.54 |
2.78 |
2.97 |
3.19 |
|
∆PESQ |
0.14 |
0.41 |
0.74 |
0.73 |
0.7 |
0.64 |
|
|
CUP[8] |
PESQ |
1.24 |
1.78 |
2.47 |
2.73 |
2.93 |
3.16 |
|
∆PESQ |
0.11 |
0.35 |
0.67 |
0.68 |
0.66 |
0.61 |
|
|
WR NMF[14] |
PESQ |
1.28 |
1.82 |
2.39 |
2.67 |
2.85 |
3.09 |
|
∆PESQ |
0.15 |
0.39 |
0.59 |
0.62 |
0.58 |
0.54 |
|
|
NR NMF[14] |
PESQ |
1.25 |
1.84 |
2.37 |
2.64 |
2.84 |
3.09 |
|
∆PESQ |
0.12 |
0.41 |
0.57 |
0.59 |
0.57 |
0.54 |
|
|
PR NMF[11] |
PESQ |
1.23 |
1.75 |
2.31 |
2.54 |
2.75 |
2.94 |
|
∆PESQ |
0.1 |
0.32 |
0.51 |
0.49 |
0.48 |
0.39 |
|
|
HRNR-SPU[13] |
PESQ |
1.22 |
1.72 |
2.32 |
2.54 |
2.72 |
2.9 |
|
∆PESQ |
0.09 |
0.29 |
0.52 |
0.49 |
0.45 |
0.35 |
|
|
HRNR[5] |
PESQ |
1.17 |
1.62 |
2.21 |
2.45 |
2.63 |
2.84 |
|
∆PESQ |
0.04 |
0.19 |
0.41 |
0.4 |
0.36 |
0.29 |
Table 10. Comparison of Average STOI, % STOI performance measures for the 30 speech signals corrupted by Pink noise under Input SNRs of -10 dB, -5dB, 0dB, 5 dB, 10 dB, 15 dB
|
Input SNR in dB Method |
Performance Measure |
-10 |
-5 |
0 |
5 |
10 |
15 |
|
Without Processing |
STOI |
0.3245 |
0.5343 |
0.6142 |
0.7543 |
0.8123 |
0.9121 |
|
SE+CUP-GG+NR- |
% STOI |
7.09 |
6.23 |
3.68 |
2.45 |
1.78 |
0.89 |
|
NMF+OU |
STOI |
0.3475 |
0.5676 |
0.6368 |
0.7728 |
0.8267 |
0.9202 |
|
SE+CUP-GG+WR- |
% STOI |
7.02 |
6.11 |
3.59 |
2.26 |
1.72 |
0.84 |
|
NMF+OU |
STOI |
0.3473 |
0.5669 |
0.6362 |
0.7713 |
0.8263 |
0.9198 |
|
SE+CUP-GG+β-NMF+OU |
% STOI |
6.87 |
5.86 |
3.52 |
2.45 |
1.73 |
0.85 |
|
STOI |
0.3468 |
0.5656 |
0.6358 |
0.7728 |
0.8264 |
0.9199 |
|
SE+CUP GG+NMF[9] |
% STOI |
6.89 |
5.76 |
3.45 |
2.34 |
1.67 |
0.88 |
|
STOI |
0.3469 |
0.5651 |
0.6354 |
0.772 |
0.8259 |
0.9201 |
|
|
NMF+OU[12] |
% STOI |
4.14 |
3.38 |
2.98 |
1.15 |
0.86 |
0.67 |
|
STOI |
0.3379 |
0.5524 |
0.6325 |
0.763 |
0.8193 |
0.9182 |
|
|
CUP-GG[9] |
% STOI |
4.98 |
4.69 |
2.61 |
1.95 |
1.46 |
0.58 |
|
STOI |
0.3406 |
0.5594 |
0.6302 |
0.7690 |
0.8242 |
0.9174 |
|
|
CUP-NG[9] |
% STOI |
4.59 |
3.81 |
3.29 |
1.23 |
1.15 |
0.54 |
|
STOI |
0.3394 |
0.5547 |
0.6344 |
0.7636 |
0.8216 |
0.917 |
|
|
CUP[8] |
% STOI |
3.61 |
2.98 |
2.79 |
0.9 |
0.44 |
0.34 |
|
STOI |
0.3362 |
0.5502 |
0.6313 |
0.7611 |
0.8159 |
0.9152 |
|
|
WR NMF[14] |
% STOI |
2.73 |
2.34 |
2.01 |
0.93 |
0.62 |
0.24 |
|
STOI |
0.3334 |
0.547 |
0.6265 |
0.7613 |
0.8174 |
0.9143 |
|
|
NR NMF[14] |
% STOI |
2.62 |
2.11 |
1.92 |
0.86 |
0.51 |
0.13 |
|
STOI |
0.3331 |
0.5456 |
0.6259 |
0.7608 |
0.8164 |
0.9133 |
|
|
PR NMF[11] |
% STOI |
1.62 |
1.23 |
1.03 |
0.43 |
0.14 |
0.09 |
|
STOI |
0.3298 |
0.5409 |
0.6205 |
0.7575 |
0.8134 |
0.9129 |
|
|
HRNR-SPU[13] |
% STOI |
-2.24 |
-2.02 |
-1.39 |
-1.72 |
-1.28 |
-1.21 |
|
STOI |
0.3172 |
0.5235 |
0.6057 |
0.7413 |
0.8019 |
0.9011 |
|
|
HRNR[5] |
% STOI |
-2.72 |
-2.26 |
-2.09 |
-1.28 |
-1.36 |
-1.39 |
|
STOI |
0.3157 |
0.5222 |
0.6014 |
0.7447 |
0.8012 |
0.8994 |
Table 11. Comparison of Average SNR, , Seg SNR performance measures for the 30 speech signals corrupted by Pink noise under Input SNRs of -10 dB, -5dB, 0dB, 5 dB, 10 dB, 15 dB
|
Input SNR in dB Method |
Performance Measure |
-10 |
-5 |
0 |
5 |
10 |
15 |
|
SE+CUP-GG+NR-NMF+OU |
SNR |
4.67 |
8.02 |
10.21 |
12.11 |
16.22 |
21.22 |
|
SDR |
4.23 |
6.72 |
9.38 |
11.67 |
15.35 |
18.92 |
|
|
Seg SNR |
3.89 |
6.54 |
7.87 |
11.24 |
15.02 |
17.28 |
|
|
SE+CUP-GG+WR-NMF+OU |
SNR |
4.28 |
7.8 |
10.86 |
11.84 |
16.84 |
20.84 |
|
SDR |
3.86 |
6.91 |
9.58 |
11.64 |
15.76 |
19.27 |
|
|
Seg SNR |
3.68 |
6.14 |
7.93 |
10.42 |
15.11 |
16.97 |
|
|
SE+CUP-GG+β-NMF+OU |
SNR |
4.69 |
7.26 |
10.44 |
11.51 |
15.84 |
20.21 |
|
SDR |
4.12 |
6.62 |
9.18 |
11.01 |
14.95 |
18.56 |
|
|
Seg SNR |
3.78 |
5.95 |
7.87 |
10.23 |
14.84 |
16.46 |
|
|
SE+CUP GG+NMF[9] |
SNR |
4.62 |
7.22 |
9.87 |
11.56 |
15.07 |
19.78 |
|
SDR |
3.95 |
6.24 |
8.96 |
10.68 |
14.69 |
17.05 |
|
|
Seg SNR |
3.69 |
5.87 |
7.57 |
9.89 |
13.68 |
15.87 |
|
|
NMF+OU[12] |
SNR |
3.21 |
4.03 |
7.66 |
11.25 |
15.64 |
17.86 |
|
SDR |
2.25 |
3.11 |
8.69 |
9.96 |
13.96 |
15.76 |
|
|
Seg SNR |
1.78 |
2.42 |
6.95 |
8.79 |
12.59 |
14.83 |
|
|
CUP-GG[9] |
SNR |
4.46 |
6.98 |
9.06 |
10.96 |
15.82 |
19.32 |
|
SDR |
4.21 |
6.81 |
8.96 |
10.88 |
14.08 |
16.21 |
|
|
Seg SNR |
3.45 |
5.56 |
7.15 |
9.12 |
12.75 |
14.98 |
|
|
CUP-NG[9] |
SNR |
4.32 |
5.94 |
8.69 |
10.42 |
14.25 |
18.23 |
|
SDR |
3.12 |
3.89 |
7.8 |
9.28 |
13.16 |
15.84 |
|
|
Seg SNR |
2.26 |
4.76 |
6.87 |
8.67 |
12.12 |
14.25 |
|
|
CUP[8] |
SNR |
2.41 |
3.98 |
7.98 |
9.54 |
13.58 |
17.23 |
|
SDR |
2.87 |
3.21 |
7.12 |
8.78 |
12.84 |
14.95 |
|
|
Seg SNR |
1.79 |
2.34 |
6.11 |
8.47 |
11.13 |
13.98 |
|
|
NR-NMF[14] |
SNR |
1.23 |
4.96 |
5.21 |
9.58 |
15.86 |
18.94 |
|
SDR |
0.96 |
2.96 |
4.94 |
10.68 |
14.69 |
18.36 |
|
|
Seg SNR |
-3.12 |
-0.89 |
3.23 |
6.78 |
10.94 |
13.51 |
|
|
WR-NMF[14] |
SNR |
0.65 |
3.18 |
4.69 |
9.59 |
15.15 |
18.45 |
|
SDR |
0.21 |
2.12 |
4.11 |
9.36 |
13.98 |
17.96 |
|
|
Seg SNR |
-3.67 |
-1.42 |
2.45 |
5.04 |
10.87 |
13.26 |
|
|
PR NMF [11] |
SNR |
0.12 |
1.96 |
4.54 |
8.94 |
13.03 |
17.11 |
|
SDR |
-2.14 |
1.21 |
3.25 |
7.36 |
12.56 |
15.87 |
|
|
Seg SNR |
-4.56 |
-2.34 |
1.34 |
4.21 |
10.34 |
12.23 |
|
|
HRNR-SPU [13] |
SNR |
1.96 |
1.78 |
4.27 |
8.85 |
14.23 |
18.94 |
|
SDR |
1.17 |
1.57 |
2.54 |
5.98 |
11.22 |
14.34 |
|
|
Seg SNR |
0.28 |
1.24 |
2.08 |
3.03 |
7.32 |
10.23 |
|
|
HRNR[5] |
SNR |
1.18 |
1.67 |
2.54 |
6.81 |
13.14 |
16.71 |
|
SDR |
0.86 |
1.48 |
2.36 |
5.53 |
10.41 |
15.36 |
|
|
Seg SNR |
0.11 |
0.98 |
1.72 |
2.35 |
6.21 |
9.45 |
Table 12. Comparison of Average PESQ, ∆PESQ performance measures for the 30 speech signals corrupted by Modulated Pink noise under Input SNRs of -10 dB, -5dB, 0dB, 5 dB, 10 dB, 15 dB
|
Input SNR in dB Method |
Performance Measure |
-10 |
-5 |
0 |
5 |
10 |
15 |
|
Without Processing |
PESQ |
1.02 |
1.37 |
1.86 |
2.12 |
2.11 |
2.37 |
|
SE+CUP-GG+NR-NMF+OU |
PESQ |
1.31 |
2.12 |
2.78 |
3.03 |
3 |
3.21 |
|
∆ PESQ |
0.29 |
0.75 |
0.92 |
0.91 |
0.89 |
0.84 |
|
|
SE+CUP-GG+WR-NMF+OU |
PESQ |
1.3 |
2.08 |
2.75 |
2.98 |
2.93 |
3.14 |
|
∆ PESQ |
0.28 |
0.71 |
0.89 |
0.86 |
0.82 |
0.77 |
|
|
SE+CUP-GG+β-NMF+OU |
PESQ |
1.29 |
2.05 |
2.71 |
2.95 |
2.9 |
3.12 |
|
∆ PESQ |
0.27 |
0.68 |
0.85 |
0.83 |
0.79 |
0.75 |
|
|
SE+CUP GG+NMF[9] |
PESQ |
1.3 |
2.05 |
2.69 |
2.93 |
2.95 |
3.1 |
|
∆ PESQ |
0.28 |
0.68 |
0.83 |
0.81 |
0.84 |
0.73 |
|
|
NMF+OU[12] |
PESQ |
1.24 |
1.96 |
2.64 |
3.01 |
2.9 |
3.08 |
|
∆ PESQ |
0.22 |
0.59 |
0.78 |
0.89 |
0.79 |
0.71 |
|
|
CUP-GG[9] |
PESQ |
1.33 |
1.92 |
2.78 |
2.94 |
2.88 |
3.03 |
|
∆ PESQ |
0.31 |
0.55 |
0.92 |
0.82 |
0.77 |
0.66 |
|
|
CUP-NG[9] |
PESQ |
1.25 |
1.84 |
2.73 |
2.91 |
2.84 |
3.01 |
|
∆ PESQ |
0.23 |
0.47 |
0.87 |
0.79 |
0.73 |
0.64 |
|
|
CUP[8] |
PESQ |
1.22 |
1.82 |
2.62 |
2.81 |
2.67 |
2.94 |
|
∆ PESQ |
0.2 |
0.45 |
0.76 |
0.69 |
0.56 |
0.57 |
|
|
WR NMF[14] |
PESQ |
1.26 |
1.8 |
2.58 |
2.87 |
2.9 |
3.09 |
|
∆ PESQ |
0.24 |
0.43 |
0.72 |
0.75 |
0.79 |
0.72 |
|
|
NR NMF[14] |
PESQ |
2.32 |
3.42 |
4.55 |
5.05 |
5.06 |
5.47 |
|
∆ PESQ |
0.22 |
0.39 |
0.62 |
0.65 |
0.68 |
0.59 |
|
|
PR NMF[11] |
PESQ |
1.19 |
1.71 |
2.45 |
2.68 |
2.65 |
2.85 |
|
∆ PESQ |
0.17 |
0.34 |
0.59 |
0.56 |
0.54 |
0.48 |
|
|
HRNR-SPU[13] |
PESQ |
1.16 |
1.66 |
2.27 |
2.57 |
2.53 |
2.76 |
|
∆ PESQ |
0.14 |
0.29 |
0.41 |
0.45 |
0.42 |
0.39 |
|
|
HRNR[5] |
PESQ |
1.12 |
1.59 |
2.23 |
2.53 |
2.49 |
2.73 |
|
∆ PESQ |
0.1 |
0.22 |
0.37 |
0.41 |
0.38 |
0.36 |
Table 13. Comparison of Average STOI, % STOI performance measures for the 30 speech signals corrupted by Modulated Pink noise under Input SNRs of -10 dB, -5dB, 0dB, 5 dB, 10 dB, 15 dB
|
Input SNR in dB |
Performance Measure |
-10 |
-5 |
0 |
5 |
10 |
15 |
|
Method |
|||||||
|
Without Processing |
STOI |
0.2912 |
0.5042 |
0.5987 |
0.7128 |
0.7965 |
0.8456 |
|
SE+CUP-GG+NR-NMF+OU |
% STOI |
6.89 |
5.12 |
3.34 |
2.16 |
1.76 |
0.89 |
|
STOI |
0.3113 |
0.5300 |
0.6187 |
0.7282 |
0.8105 |
0.8531 |
|
|
SE+CUP-GG+WR-NMF+OU |
% STOI |
6.65 |
5.11 |
3.16 |
2.13 |
1.71 |
0.74 |
|
STOI |
0.3106 |
0.5299 |
0.6176 |
0.728 |
0.8101 |
0.8519 |
|
|
SE+CUP-GG+β-NMF+OU |
% STOI |
6.61 |
5.28 |
3.19 |
2.11 |
1.68 |
0.69 |
|
STOI |
0.3104 |
0.5308 |
0.6178 |
0.7278 |
0.8099 |
0.8514 |
|
SE+CUP GG+NMF[9] |
% STOI |
6.57 |
5.32 |
3.21 |
2.02 |
1.63 |
0.67 |
|
STOI |
0.3103 |
0.5310 |
0.6179 |
0.7272 |
0.8095 |
0.8513 |
|
|
NMF+OU[12] |
% STOI |
4.11 |
3.16 |
2.76 |
1.02 |
0.73 |
0.54 |
|
STOI |
0.3032 |
0.5201 |
0.6152 |
0.7201 |
0.8023 |
0.8502 |
|
|
CUP-GG[9] |
% STOI |
4.91 |
3.95 |
3.64 |
1.96 |
0.44 |
0.27 |
|
STOI |
0.3055 |
0.5241 |
0.6205 |
0.7268 |
0.8 |
0.8479 |
|
|
CUP-NG[9] |
% STOI |
4.73 |
3.64 |
2.98 |
1.61 |
0.49 |
0.32 |
|
STOI |
0.305 |
0.5225 |
0.6165 |
0.7243 |
0.8004 |
0.8483 |
|
|
CUP[8] |
% STOI |
3.51 |
2.76 |
2.49 |
0.95 |
0.26 |
0.12 |
|
STOI |
0.3014 |
0.5181 |
0.6136 |
0.7196 |
0.7986 |
0.8466 |
|
|
WR NMF[14] |
% STOI |
2.67 |
2.12 |
1.98 |
0.87 |
0.45 |
0.3 |
|
STOI |
0.299 |
0.5149 |
0.6105 |
0.719 |
0.8001 |
0.8481 |
|
|
NR NMF[14] |
% STOI |
2.45 |
2.01 |
1.78 |
0.74 |
0.49 |
0.11 |
|
STOI |
0.2984 |
0.5143 |
0.6094 |
0.7181 |
0.8004 |
0.8465 |
|
|
PR NMF[11] |
% STOI |
1.56 |
1.17 |
0.98 |
0.26 |
0.11 |
0.1 |
|
STOI |
0.2957 |
0.5101 |
0.6046 |
0.7146 |
0.7974 |
0.8465 |
|
|
HRNR-SPU[13] |
% STOI |
-2.54 |
-2.29 |
-1.53 |
-1.85 |
-1.39 |
-1.36 |
|
STOI |
0.2838 |
0.4926 |
0.5895 |
0.6996 |
0.7854 |
0.8341 |
|
|
HRNR[5] |
% STOI |
-2.97 |
-2.43 |
-2.18 |
-1.39 |
-1.54 |
-1.76 |
|
STOI |
0.2828 |
0.4922 |
0.5858 |
0.7031 |
0.7844 |
0.8309 |
Table 14. Comparison of Average SNR, SDR, Segmental SNR performance measures for the 30 speech signals corrupted by Modulated Pink noise under Input SNRs of -10 dB, -5dB, 0dB, 5 dB, 10 dB, 15 dB
|
Input SNR in dB Method |
Performance Measure |
-10 |
-5 |
0 |
5 |
10 |
15 |
|
SE+CUP-GG+NR-NMF+OU |
SNR |
4.52 |
7.96 |
10.15 |
12.01 |
16.24 |
20.98 |
|
SDR |
4.11 |
6.58 |
9.21 |
11.52 |
15.12 |
18.79 |
|
|
Seg SNR |
3.76 |
6.42 |
7.65 |
11.12 |
14.94 |
17.58 |
|
|
SE+CUP-GG+WR-NMF+OU |
SNR |
4.05 |
7.64 |
10.68 |
11.78 |
16.95 |
20.64 |
|
SDR |
3.79 |
6.78 |
9.51 |
11.75 |
15.89 |
19.46 |
|
|
Seg SNR |
3.62 |
6.02 |
7.85 |
10.29 |
14.95 |
16.86 |
|
|
SE+CUP-GG+β-NMF+OU |
SNR |
4.52 |
7.03 |
10.57 |
11.62 |
15.78 |
20.06 |
|
SDR |
4.03 |
6.51 |
9.08 |
10.86 |
14.99 |
18.68 |
|
|
Seg SNR |
3.71 |
5.84 |
7.81 |
10.95 |
14.78 |
16.24 |
|
|
SE+CUP GG+NMF[9] |
SNR |
4.54 |
7.12 |
9.65 |
11.69 |
15.98 |
19.95 |
|
SDR |
3.84 |
6.72 |
8.82 |
10.54 |
14.52 |
17.24 |
|
|
Seg SNR |
3.46 |
5.84 |
7.63 |
9.97 |
13.95 |
15.75 |
|
|
NMF+OU[12] |
SNR |
3.12 |
4.21 |
7.81 |
11.21 |
15.42 |
17.89 |
|
SDR |
2.28 |
3.09 |
8.76 |
9.21 |
13.74 |
15.64 |
|
|
Seg SNR |
1.68 |
2.31 |
6.86 |
8.54 |
12.34 |
14.68 |
|
|
CUP-GG[9] |
SNR |
4.63 |
6.89 |
9.21 |
10.93 |
15.72 |
19.23 |
|
SDR |
4.14 |
6.65 |
8.78 |
10.95 |
14.26 |
16.35 |
|
|
Seg SNR |
3.12 |
5.23 |
7.02 |
9.02 |
12.23 |
14.76 |
|
|
CUP-NG[9] |
SNR |
4.13 |
5.78 |
8.51 |
10.25 |
14.11 |
18.14 |
|
SDR |
3.01 |
3.81 |
7.64 |
9.32 |
13.28 |
15.89 |
|
|
Seg SNR |
2.13 |
4.35 |
6.68 |
8.52 |
11.92 |
14.11 |
|
|
CUP[8] |
SNR |
3.06 |
3.76 |
7.75 |
9.21 |
13.14 |
17.21 |
|
SDR |
2.81 |
3.23 |
7.28 |
8.64 |
12.56 |
15.24 |
|
|
Seg SNR |
1.68 |
2.56 |
5.98 |
8.21 |
10.89 |
13.69 |
|
|
NR-NMF[14] |
SNR |
1.22 |
4.72 |
5.35 |
9.62 |
15.89 |
18.86 |
|
SDR |
0.99 |
2.99 |
4.85 |
10.85 |
14.86 |
18.51 |
|
|
Seg SNR |
-3.25 |
-0.92 |
3.12 |
6.64 |
10.85 |
13.44 |
|
|
WR-NMF[14] |
SNR |
0.58 |
3.12 |
4.58 |
9.45 |
15.01 |
18.65 |
|
SDR |
0.19 |
2.52 |
4.21 |
9.24 |
14.05 |
18.11 |
|
|
Seg SNR |
-3.78 |
-1.49 |
2.61 |
5.14 |
10.68 |
13.56 |
|
|
PR NMF [11] |
SNR |
0.11 |
2.01 |
4.35 |
8.85 |
12.85 |
16.89 |
|
SDR |
-2.26 |
1.18 |
3.29 |
7.15 |
12.34 |
15.89 |
|
|
Seg SNR |
-4.67 |
-2.47 |
1.41 |
4.02 |
10.42 |
12.54 |
|
|
HRNR-SPU [13] |
SNR |
-5.34 |
-1.31 |
2.56 |
7.28 |
12.25 |
16.67 |
|
SDR |
-6.65 |
-2.14 |
1.22 |
5.85 |
10.98 |
15.86 |
|
|
Seg SNR |
-8.91 |
-3.54 |
-1.24 |
2.95 |
7.12 |
10.02 |
|
|
HRNR[5] |
SNR |
-5.86 |
-1.35 |
0.51 |
6.57 |
10.42 |
15.11 |
|
SDR |
-7.89 |
-2.89 |
-0.31 |
5.48 |
10.25 |
15.17 |
|
|
Seg SNR |
-9.99 |
-4.35 |
-1.31 |
2.12 |
5.98 |
9.36 |
Table 15. Comparison of Average PESQ, ∆PESQ performance measures for the 30 speech signals corrupted by Factory noise under Input SNRs of -10 dB, -5dB, 0dB, 5 dB, 10 dB, 15 dB
|
Input SNR in dB Method |
Performance Measure |
-10 |
-5 |
0 |
5 |
10 |
15 |
|
Without Processing |
PESQ |
1.28 |
1.53 |
1.93 |
2.07 |
2.35 |
2.67 |
|
SE+CUP-GG+NR-NMF+OU |
PESQ |
1.55 |
2.2 |
2.91 |
3.04 |
3.26 |
3.5 |
|
∆ PESQ |
0.27 |
0.67 |
0.98 |
0.97 |
0.91 |
0.83 |
|
|
SE+CUP-GG+WR-NMF+OU |
PESQ |
1.53 |
2.12 |
2.85 |
3.02 |
3.24 |
3.51 |
|
∆ PESQ |
0.25 |
0.59 |
0.92 |
0.95 |
0.89 |
0.84 |
|
|
SE+CUP-GG+β-NMF+OU |
PESQ |
1.51 |
2.04 |
2.82 |
2.98 |
3.17 |
3.46 |
|
∆ PESQ |
0.23 |
0.51 |
0.89 |
0.91 |
0.82 |
0.79 |
|
|
SE+CUP GG+NMF[9] |
PESQ |
1.49 |
1.95 |
2.74 |
2.86 |
3.11 |
3.4 |
|
∆ PESQ |
0.21 |
0.42 |
0.81 |
0.79 |
0.76 |
0.73 |
|
|
NMF+OU[12] |
PESQ |
1.36 |
1.85 |
2.57 |
2.74 |
3 |
3.27 |
|
∆ PESQ |
0.08 |
0.32 |
0.64 |
0.67 |
0.65 |
0.6 |
|
|
CUP-GG[9] |
PESQ |
1.42 |
1.92 |
2.65 |
2.74 |
3 |
3.3 |
|
∆ PESQ |
0.14 |
0.39 |
0.72 |
0.67 |
0.65 |
0.63 |
|
|
CUP-NG[9] |
PESQ |
1.39 |
1.88 |
2.61 |
2.75 |
2.99 |
3.29 |
|
∆ PESQ |
0.11 |
0.35 |
0.68 |
0.68 |
0.64 |
0.62 |
|
|
CUP[8] |
PESQ |
1.32 |
1.83 |
2.55 |
2.65 |
2.91 |
3.21 |
|
∆ PESQ |
0.04 |
0.3 |
0.62 |
0.58 |
0.56 |
0.54 |
|
|
WR NMF[14] |
PESQ |
1.4 |
1.9 |
2.55 |
2.75 |
2.99 |
3.26 |
|
∆ PESQ |
0.12 |
0.37 |
0.62 |
0.68 |
0.64 |
0.59 |
|
|
NR NMF[14] |
PESQ |
1.39 |
1.92 |
2.58 |
2.74 |
3 |
3.24 |
|
∆ PESQ |
0.11 |
0.39 |
0.65 |
0.67 |
0.65 |
0.57 |
|
|
PR NMF[11] |
PESQ |
1.37 |
1.84 |
2.42 |
2.59 |
2.83 |
3.12 |
|
∆ PESQ |
0.09 |
0.31 |
0.49 |
0.52 |
0.48 |
0.45 |
|
|
HRNR-SPU[13] |
PESQ |
1.35 |
1.8 |
2.38 |
2.49 |
2.7 |
2.98 |
|
∆ PESQ |
0.07 |
0.27 |
0.45 |
0.42 |
0.35 |
0.31 |
|
|
HRNR[5] |
PESQ |
1.34 |
1.7 |
2.31 |
2.38 |
2.62 |
2.92 |
|
∆ PESQ |
0.06 |
0.17 |
0.38 |
0.31 |
0.27 |
0.25 |
Table 16. Comparison of Average STOI, % STOI performance measures for the 30 speech signals corrupted by Factory noise under Input SNRs of -10 dB, -5dB, 0dB, 5 dB, 10 dB, 15 dB
|
Input SNR in dB Method |
Performance Measure |
-10 |
-5 |
0 |
5 |
10 |
15 |
|
Without Processing |
STOI |
0.3109 |
0.5122 |
0.6011 |
0.7476 |
0.8098 |
0.8976 |
|
SE+CUP-GG+NR-NMF+OU |
% STOI |
6.67 |
5.63 |
3.54 |
2.25 |
1.63 |
0.73 |
|
STOI |
0.3316 |
0.5411 |
0.6224 |
0.7644 |
0.8221 |
0.9042 |
|
|
SE+CUP-GG+WR-NMF+OU |
% STOI |
6.58 |
5.45 |
3.35 |
2.16 |
1.59 |
0.67 |
|
STOI |
0.3313 |
0.5401 |
0.6212 |
0.7638 |
0.8226 |
0.9036 |
|
|
SE+CUP-GG+β-NMF+OU |
% STOI |
6.46 |
5.32 |
3.21 |
2.12 |
1.52 |
0.64 |
|
STOI |
0.3310 |
0.5394 |
0.6204 |
0.7634 |
0.8221 |
0.9033 |
|
|
SE+CUP GG+NMF[9] |
% STOI |
6.12 |
5.11 |
3.09 |
1.92 |
1.45 |
0.58 |
|
STOI |
0.3299 |
0.5384 |
0.6197 |
0.7619 |
0.8215 |
0.9028 |
|
NMF+OU[12] |
% STOI |
4.09 |
3.22 |
2.53 |
0.93 |
0.62 |
0.45 |
|
STOI |
0.3236 |
0.5287 |
0.6163 |
0.7545 |
0.8148 |
0.9016 |
|
|
CUP-GG[9] |
% STOI |
3.98 |
3.18 |
2.59 |
1.79 |
0.85 |
0.31 |
|
STOI |
0.3233 |
0.5285 |
0.6167 |
0.7609 |
0.8167 |
0.9004 |
|
|
CUP-NG[9] |
% STOI |
3.61 |
2.98 |
2.91 |
1.18 |
0.69 |
0.19 |
|
STOI |
0.3221 |
0.5275 |
0.6186 |
0.7564 |
0.8154 |
0.8993 |
|
|
CUP[8] |
% STOI |
3.02 |
2.56 |
1.98 |
0.69 |
0.22 |
0.07 |
|
STOI |
0.3203 |
0.5253 |
0.613 |
0.7527 |
0.8116 |
0.8982 |
|
|
WR NMF[14] |
% STOI |
2.62 |
2.21 |
1.86 |
0.79 |
0.38 |
0.12 |
|
STOI |
0.3190 |
0.5235 |
0.6123 |
0.7535 |
0.8128 |
0.8987 |
|
|
NR NMF[14] |
% STOI |
2.34 |
1.97 |
1.64 |
0.67 |
0.23 |
0.13 |
|
STOI |
0.3181 |
0.5223 |
0.6110 |
0.7526 |
0.8117 |
0.8988 |
|
|
PR NMF[11] |
% STOI |
1.62 |
1.19 |
0.92 |
0.21 |
0.06 |
0.09 |
|
STOI |
0.3159 |
0.5183 |
0.6066 |
0.7491 |
0.8103 |
0.8984 |
|
|
HRNR-SPU[13] |
% STOI |
-2.39 |
-2.12 |
-1.45 |
-1.72 |
-1.31 |
-1.29 |
|
STOI |
0.3035 |
0.5013 |
0.5924 |
0.7347 |
0.7992 |
0.886 |
|
|
HRNR[5] |
% STOI |
-2.86 |
-2.35 |
-2.16 |
-1.35 |
-1.48 |
-1.52 |
|
STOI |
0.3020 |
0.5002 |
0.5881 |
0.7375 |
0.7978 |
0.884 |
Table 17. Comparison of Average SNR, SDR, Seg SNR performance measures for the 30 speech signals corrupted by Factory noise under Input SNRs of -10 dB, -5dB, 0dB, 5 dB, 10 dB, 15 dB
|
Input SNR in dB Method |
Performance Measure |
-10 |
-5 |
0 |
5 |
10 |
15 |
|
SE+CUP-GG+NR-NMF+OU |
SNR |
4.41 |
7.85 |
10.12 |
11.97 |
15.98 |
20.85 |
|
SDR |
4.02 |
6.41 |
9.11 |
11.36 |
15.18 |
18.78 |
|
|
Seg SNR |
3.71 |
6.32 |
7.48 |
10.98 |
14.78 |
17.36 |
|
|
SE+CUP-GG+WR-NMF+OU |
SNR |
3.98 |
7.58 |
10.57 |
11.69 |
16.84 |
20.25 |
|
SDR |
3.58 |
6.65 |
9.47 |
11.67 |
15.76 |
19.25 |
|
|
Seg SNR |
3.54 |
5.97 |
7.76 |
10.25 |
14.84 |
16.73 |
|
|
SE+CUP-GG+β-NMF+OU |
SNR |
4.46 |
6.97 |
10.46 |
11.57 |
15.62 |
19.95 |
|
SDR |
3.98 |
6.43 |
8.96 |
10.98 |
14.82 |
18.45 |
|
|
Seg SNR |
3.68 |
5.72 |
7.65 |
10.86 |
14.87 |
16.13 |
|
|
SE+CUP GG+NMF[9] |
SNR |
4.35 |
6.97 |
9.54 |
11.57 |
15.21 |
19.78 |
|
SDR |
3.62 |
6.59 |
8.67 |
10.42 |
14.47 |
16.75 |
|
|
Seg SNR |
3.25 |
5.75 |
7.54 |
9.74 |
13.78 |
15.48 |
|
|
NMF+OU[12] |
SNR |
3.04 |
4.12 |
8.57 |
11.26 |
15.27 |
17.96 |
|
SDR |
2.31 |
3.26 |
8.54 |
9.54 |
13.98 |
15.84 |
|
|
Seg SNR |
1.57 |
2.29 |
6.57 |
8.25 |
12.11 |
14.54 |
|
|
CUP-GG[9] |
SNR |
4.42 |
6.58 |
8.97 |
10.86 |
14.98 |
19.1 |
|
SDR |
3.89 |
6.25 |
8.59 |
10.41 |
13.87 |
16.14 |
|
|
Seg SNR |
3.04 |
5.03 |
6.98 |
8.87 |
12.03 |
14.58 |
|
|
CUP-NG[9] |
SNR |
3.96 |
5.67 |
8.34 |
10.11 |
13.95 |
17.86 |
|
SDR |
2.94 |
3.65 |
7.58 |
9.14 |
13.11 |
15.75 |
|
|
Seg SNR |
1.96 |
4.12 |
6.46 |
8.34 |
11.78 |
14.03 |
|
|
CUP[8] |
SNR |
3.21 |
3.78 |
7.65 |
9.11 |
13.04 |
16.98 |
|
SDR |
2.68 |
3.12 |
7.02 |
8.52 |
12.38 |
15.01 |
|
|
Seg SNR |
1.57 |
2.38 |
5.74 |
8.01 |
10.65 |
13.48 |
|
|
NR-NMF[14] |
SNR |
1.02 |
4.59 |
5.21 |
9.51 |
15.67 |
18.67 |
|
SDR |
0.78 |
2.83 |
4.67 |
10.68 |
14.69 |
18.34 |
|
|
Seg SNR |
-3.12 |
-0.95 |
3.08 |
6.45 |
10.59 |
13.22 |
|
|
WR-NMF[14] |
SNR |
0.46 |
2.98 |
4.35 |
9.21 |
14.97 |
18.54 |
|
SDR |
0.17 |
2.41 |
4.1 |
8.95 |
13.86 |
17.99 |
|
|
Seg SNR |
-3.86 |
-1.58 |
2.83 |
5.11 |
10.45 |
13.14 |
|
|
PR NMF [11] |
SNR |
0.08 |
1.89 |
4.112 |
8.67 |
12.69 |
16.68 |
|
SDR |
-2.35 |
1.26 |
3.12 |
6.98 |
11.96 |
15.24 |
|
|
Seg SNR |
-4.85 |
-2.56 |
1.57 |
3.98 |
10.21 |
12.48 |
|
|
HRNR-SPU [13] |
SNR |
-5.42 |
-1.42 |
2.43 |
7.12 |
12.03 |
16.54 |
|
SDR |
-6.76 |
-2.25 |
1.34 |
5.69 |
10.84 |
15.75 |
|
|
Seg SNR |
-8.76 |
-3.38 |
-1.11 |
2.87 |
6.95 |
9.96 |
|
|
HRNR[5] |
SNR |
-5.74 |
-1.32 |
0.48 |
5.34 |
10.51 |
15.16 |
|
SDR |
-7.92 |
-2.95 |
-0.38 |
5.45 |
10.12 |
15.02 |
|
|
Seg SNR |
-9.98 |
-4.42 |
-1.39 |
2.18 |
5.87 |
9.25 |
Table 18. Comparison of Average PESQ, ∆PESQ performance measures for the 30 speech signals corrupted by Car noise under Input SNRs of -10 dB,
-5dB, 0dB, 5 dB, 10 dB, 15 dB.
|
Input SNR in dB Method |
Performance Measure |
-10 |
-5 |
0 |
5 |
10 |
15 |
|
Without Processing |
PESQ |
1.12 |
1.63 |
1.87 |
2.12 |
2.23 |
2.57 |
|
SE+CUP-GG+NR-NMF+OU |
PESQ |
1.35 |
2.25 |
2.76 |
3.05 |
3.08 |
3.31 |
|
∆ PESQ |
0.23 |
0.62 |
0.89 |
0.93 |
0.85 |
0.74 |
|
|
SE+CUP-GG+WR-NMF+OU |
PESQ |
1.37 |
2.22 |
2.78 |
3.04 |
3.1 |
3.38 |
|
∆ PESQ |
0.25 |
0.59 |
0.91 |
0.92 |
0.87 |
0.81 |
|
|
SE+CUP-GG+β-NMF+OU |
PESQ |
1.35 |
2.19 |
2.73 |
3.01 |
3.07 |
3.35 |
|
∆ PESQ |
0.23 |
0.56 |
0.86 |
0.89 |
0.84 |
0.78 |
|
|
SE+CUP GG+NMF[9] |
PESQ |
1.33 |
2.09 |
2.66 |
2.94 |
2.99 |
3.29 |
|
∆ PESQ |
0.21 |
0.46 |
0.79 |
0.82 |
0.76 |
0.72 |
|
|
NMF+OU[12] |
PESQ |
1.2 |
2 |
2.52 |
2.84 |
2.88 |
3.18 |
|
∆ PESQ |
0.08 |
0.37 |
0.65 |
0.72 |
0.65 |
0.61 |
|
|
CUP-GG[9] |
PESQ |
1.26 |
2.02 |
2.54 |
2.81 |
2.86 |
3.18 |
|
∆ PESQ |
0.14 |
0.39 |
0.67 |
0.69 |
0.63 |
0.61 |
|
|
CUP-NG[9] |
PESQ |
1.23 |
1.99 |
2.48 |
2.75 |
2.82 |
3.13 |
|
∆ PESQ |
0.11 |
0.36 |
0.61 |
0.63 |
0.59 |
0.56 |
|
|
CUP[8] |
PESQ |
1.19 |
1.95 |
2.54 |
2.74 |
2.77 |
3.12 |
|
∆ PESQ |
0.07 |
0.32 |
0.67 |
0.62 |
0.54 |
0.55 |
|
|
WR NMF[14] |
PESQ |
1.24 |
2.01 |
2.46 |
2.77 |
2.81 |
3.09 |
|
∆ PESQ |
0.12 |
0.38 |
0.59 |
0.65 |
0.58 |
0.52 |
|
|
NR NMF[14] |
PESQ |
1.21 |
1.99 |
2.46 |
2.79 |
2.84 |
3.14 |
|
∆ PESQ |
0.09 |
0.36 |
0.59 |
0.67 |
0.61 |
0.57 |
|
|
PR NMF[11] |
PESQ |
1.18 |
1.94 |
2.32 |
2.61 |
2.66 |
2.96 |
|
∆ PESQ |
0.06 |
0.31 |
0.45 |
0.49 |
0.43 |
0.39 |
|
|
HRNR-SPU[13] |
PESQ |
1.15 |
1.84 |
2.26 |
2.5 |
2.54 |
2.85 |
|
∆ PESQ |
0.03 |
0.21 |
0.39 |
0.38 |
0.31 |
0.28 |
|
|
HRNR[5] |
PESQ |
1.13 |
1.79 |
2.25 |
2.46 |
2.51 |
2.81 |
|
∆ PESQ |
0.01 |
0.16 |
0.38 |
0.34 |
0.28 |
0.24 |
Table 19. Comparison of Average STOI, % STOI performance measures for the 30 speech signals corrupted by Car noise under Input SNRs of -10 dB, -5dB, 0dB, 5 dB, 10 dB, 15 dB.
|
Input SNR in dB Method |
Performance Measure |
-10 |
-5 |
0 |
5 |
10 |
15 |
|
Without Processing |
STOI |
0.3122 |
0.5349 |
0.6292 |
0.7682 |
0.8221 |
0.9532 |
|
SE+CUP-GG+NR- |
% STOI |
6.92 |
5.84 |
3.76 |
2.63 |
1.97 |
0.95 |
|
NMF+OU |
STOI |
0.3338 |
0.5661 |
0.6528 |
0.7884 |
0.8383 |
0.9623 |
|
SE+CUP-GG+WR- |
% STOI |
6.85 |
5.76 |
3.75 |
2.52 |
1.96 |
0.96 |
|
NMF+OU |
STOI |
0.3336 |
0.5657 |
0.6528 |
0.7876 |
0.8382 |
0.9623 |
|
SE+CUP-GG+β-NMF+OU |
% STOI |
6.91 |
5.69 |
3.67 |
2.45 |
1.85 |
0.94 |
|
STOI |
0.3338 |
0.5653 |
0.6523 |
0.7870 |
0.8373 |
0.9621 |
|
|
SE+CUP GG+NMF[9] |
% STOI |
6.82 |
5.58 |
3.59 |
2.32 |
1.73 |
0.89 |
|
STOI |
0.3335 |
0.5647 |
0.6518 |
0.7860 |
0.8363 |
0.9616 |
|
NMF+OU[12] |
% STOI |
4.76 |
3.65 |
2.98 |
1.24 |
0.89 |
0.63 |
|
STOI |
0.3270 |
0.5544 |
0.6479 |
0.7777 |
0.8294 |
0.9592 |
|
|
CUP-GG[9] |
% STOI |
4.97 |
3.78 |
3.21 |
1.78 |
0.49 |
0.43 |
|
STOI |
0.3277 |
0.5551 |
0.6494 |
0.7819 |
0.8261 |
0.9573 |
|
|
CUP-NG[9] |
% STOI |
4.86 |
3.68 |
3.06 |
1.67 |
0.51 |
0.28 |
|
STOI |
0.3274 |
0.5546 |
0.6484 |
0.7810 |
0.8263 |
0.9559 |
|
|
CUP[8] |
% STOI |
3.67 |
2.83 |
2.53 |
0.91 |
0.31 |
0.15 |
|
STOI |
0.3236 |
0.5500 |
0.6451 |
0.7752 |
0.8246 |
0.9546 |
|
|
WR NMF[14] |
% STOI |
2.71 |
2.18 |
1.99 |
0.89 |
0.36 |
0.14 |
|
STOI |
0.3206 |
0.5465 |
0.6417 |
0.7750 |
0.8251 |
0.9545 |
|
|
NR NMF[14] |
% STOI |
2.32 |
2.13 |
1.83 |
0.83 |
0.51 |
0.17 |
|
STOI |
0.3194 |
0.5463 |
0.6407 |
0.7746 |
0.8263 |
0.9548 |
|
|
PR NMF[11] |
% STOI |
1.64 |
1.25 |
1.03 |
0.35 |
0.19 |
0.12 |
|
STOI |
0.3173 |
0.5416 |
0.6357 |
0.7708 |
0.8236 |
0.9543 |
|
|
HRNR-SPU[13] |
% STOI |
-2.34 |
-2.24 |
-1.34 |
-1.19 |
-1.18 |
-1.11 |
|
STOI |
0.3048 |
0.5229 |
0.6207 |
0.7590 |
0.8124 |
0.9426 |
|
|
HRNR[5] |
% STOI |
-2.67 |
-2.27 |
-2.01 |
-1.87 |
-1.26 |
-1.21 |
|
STOI |
0.3038 |
0.5227 |
0.6165 |
0.7538 |
0.8117 |
0.9416 |
Table 20. Comparison of Average SNR, SDR, Seg Snr performance measures for the 30 speech signals corrupted by Car noise under Input SNRs of -10 dB, -5dB, 0dB, 5 dB, 10 dB, 15 dB.
|
Input SNR in dB Method |
Performance Measure |
-10 |
-5 |
0 |
5 |
10 |
15 |
|
SE+CUP-GG+NR-NMF+OU |
SNR |
4.89 |
8.14 |
10.13 |
12.05 |
16.17 |
21.18 |
|
SDR |
4.34 |
6.59 |
9.27 |
11.56 |
15.54 |
18.8 |
|
|
Seg SNR |
3.78 |
6.46 |
7.69 |
11.12 |
14.98 |
17.35 |
|
|
SE+CUP-GG+WR-NMF+OU |
SNR |
4.11 |
7.67 |
10.67 |
11.72 |
16.69 |
20.72 |
|
SDR |
3.69 |
6.84 |
9.47 |
11.57 |
15.58 |
19.12 |
|
|
Seg SNR |
3.58 |
6.02 |
7.84 |
10.31 |
15.02 |
16.87 |
|
|
SE+CUP-GG+β-NMF+OU |
SNR |
4.58 |
7.12 |
10.32 |
11.47 |
15.68 |
20.14 |
|
SDR |
4.08 |
6.57 |
9.05 |
10.89 |
14.87 |
18.45 |
|
|
Seg SNR |
3.69 |
5.84 |
7.74 |
10.18 |
14.68 |
16.28 |
|
|
SE+CUP GG+NMF[9] |
SNR |
4.43 |
7.04 |
9.74 |
11.47 |
14.97 |
19.67 |
|
SDR |
3.87 |
6.12 |
8.87 |
10.56 |
14.54 |
16.94 |
|
|
Seg SNR |
3.45 |
5.68 |
7.45 |
9.75 |
13.42 |
15.67 |
|
|
NMF+OU[12] |
SNR |
2.87 |
4.04 |
7.95 |
11.24 |
14.98 |
17.78 |
|
SDR |
2.12 |
3.14 |
7.12 |
9.26 |
13.58 |
15.54 |
|
|
Seg SNR |
1.48 |
1.96 |
6.84 |
8.64 |
12.46 |
14.67 |
|
|
CUP-GG[9] |
SNR |
4.25 |
6.84 |
8.94 |
10.94 |
15.68 |
19.42 |
|
SDR |
3.88 |
6.82 |
8.78 |
10.72 |
13.95 |
16.32 |
|
|
Seg SNR |
3.46 |
5.45 |
7.21 |
9.13 |
12.65 |
15.11 |
|
|
CUP-NG[9] |
SNR |
4.18 |
5.78 |
8.57 |
10.38 |
14.08 |
18.24 |
|
SDR |
3.01 |
3.78 |
7.71 |
9.12 |
13.02 |
15.68 |
|
|
Seg SNR |
2.13 |
4.48 |
6.68 |
8.58 |
12.08 |
14.13 |
|
|
CUP[8] |
SNR |
2.25 |
3.68 |
7.74 |
9.31 |
13.34 |
17.11 |
|
SDR |
2.65 |
3.05 |
6.69 |
8.65 |
12.74 |
14.87 |
|
|
Seg SNR |
1.68 |
2.12 |
5.98 |
7.85 |
10.89 |
13.87 |
|
|
NR-NMF[14] |
SNR |
1.17 |
4.85 |
5.12 |
9.47 |
15.76 |
18.85 |
|
SDR |
0.89 |
2.84 |
4.78 |
10.57 |
14.54 |
18.12 |
|
|
Seg SNR |
-3.24 |
-0.91 |
3.25 |
6.77 |
10.84 |
13.68 |
|
|
WR-NMF[14] |
SNR |
0.64 |
3.12 |
4.57 |
9.45 |
15.02 |
18.42 |
|
SDR |
0.18 |
2.08 |
4.14 |
9.21 |
13.84 |
17.75 |
|
|
Seg SNR |
-3.78 |
-1.54 |
2.52 |
4.98 |
10.67 |
13.14 |
|
|
PR NMF [11] |
SNR |
0.11 |
1.92 |
4.21 |
8.54 |
12.85 |
16.96 |
|
SDR |
-2.17 |
1.28 |
3.12 |
7.02 |
12.21 |
15.34 |
|
|
Seg SNR |
-4.62 |
-2.51 |
1.31 |
3.85 |
9.24 |
11.98 |
|
|
HRNR-SPU [13] |
SNR |
1.94 |
1.81 |
4.32 |
6.97 |
12.42 |
17.43 |
|
SDR |
1.21 |
1.62 |
2.61 |
5.45 |
11.26 |
15.68 |
|
|
Seg SNR |
0.31 |
1.25 |
2.11 |
2.68 |
6.54 |
8.96 |
|
|
HRNR[5] |
SNR |
1.17 |
1.62 |
2.24 |
6.45 |
10.85 |
15.41 |
|
SDR |
0.84 |
1.34 |
2.28 |
5.42 |
10.53 |
15.14 |
|
|
Seg SNR |
0.1 |
0.87 |
1.66 |
2.28 |
6.14 |
9.24 |
Table 21. Comparison of Average PESQ, ∆PESQ performance measures for the 30 speech signals corrupted by F16 noise under Input SNRs of -10 dB, -5dB, 0dB, 5 dB, 10 dB, 15 dB.
|
Input SNR in dB Method |
Performance Measure |
-10 |
-5 |
0 |
5 |
10 |
15 |
|
Without Processing |
PESQ |
1.17 |
1.61 |
1.87 |
2.05 |
2.38 |
2.62 |
|
SE+CUP-GG+NR- |
PESQ |
1.38 |
2.14 |
2.69 |
2.9 |
3.2 |
3.37 |
|
NMF+OU |
∆ PESQ |
0.21 |
0.53 |
0.82 |
0.85 |
0.82 |
0.75 |
|
SE+CUP-GG+WR- |
PESQ |
1.37 |
2.09 |
2.63 |
2.87 |
3.17 |
3.33 |
|
NMF+OU |
∆ PESQ |
0.2 |
0.48 |
0.76 |
0.82 |
0.79 |
0.71 |
|
SE+CUP-GG+β-NMF+OU |
PESQ |
1.35 |
2.07 |
2.56 |
2.81 |
3.13 |
3.31 |
|
∆ PESQ |
0.18 |
0.46 |
0.69 |
0.76 |
0.75 |
0.69 |
|
|
SE+CUP GG+NMF[9] |
PESQ |
1.33 |
2 |
2.51 |
2.76 |
3.01 |
3.18 |
|
∆ PESQ |
0.16 |
0.39 |
0.64 |
0.71 |
0.63 |
0.56 |
|
|
NMF+OU[12] |
PESQ |
1.29 |
1.93 |
2.46 |
2.71 |
2.95 |
3.11 |
|
∆ PESQ |
0.12 |
0.32 |
0.59 |
0.66 |
0.57 |
0.49 |
|
|
CUP-GG[9] |
PESQ |
1.3 |
1.95 |
2.49 |
2.73 |
2.97 |
3.13 |
|
∆ PESQ |
0.13 |
0.34 |
0.62 |
0.68 |
0.59 |
0.51 |
|
|
CUP-NG[9] |
PESQ |
1.28 |
1.9 |
2.36 |
2.61 |
2.92 |
3.09 |
|
∆ PESQ |
0.11 |
0.29 |
0.49 |
0.56 |
0.54 |
0.47 |
|
|
CUP[8] |
PESQ |
1.22 |
1.87 |
2.38 |
2.58 |
2.84 |
3.05 |
|
∆ PESQ |
0.05 |
0.26 |
0.51 |
0.53 |
0.46 |
0.43 |
|
|
WR NMF[14] |
PESQ |
1.33 |
1.96 |
2.44 |
2.68 |
2.96 |
3.16 |
|
∆ PESQ |
0.16 |
0.35 |
0.57 |
0.63 |
0.58 |
0.54 |
|
|
NR NMF[14] |
PESQ |
1.31 |
1.98 |
2.38 |
2.62 |
2.97 |
3.13 |
|
∆ PESQ |
0.14 |
0.37 |
0.51 |
0.57 |
0.59 |
0.51 |
|
|
PR NMF[11] |
PESQ |
1.28 |
1.83 |
2.16 |
2.43 |
2.79 |
2.98 |
|
∆ PESQ |
0.11 |
0.22 |
0.29 |
0.38 |
0.41 |
0.36 |
|
|
HRNR-SPU[13] |
PESQ |
1.24 |
1.69 |
2.12 |
2.34 |
2.7 |
2.9 |
|
∆ PESQ |
0.07 |
0.08 |
0.25 |
0.29 |
0.32 |
0.28 |
|
|
HRNR[5] |
PESQ |
1.04 |
1.71 |
2.05 |
2.24 |
2.55 |
2.77 |
|
∆ PESQ |
-0.13 |
0.1 |
0.18 |
0.19 |
0.17 |
0.15 |
Table 22. Comparison of Average STOI, %STOI performance measures for the 30 speech signals corrupted by F16 noise under Input SNRs of -10 dB,
-5dB, 0dB, 5 dB, 10 dB, 15 dB.
|
Input SNR in dB Method |
Performance Measure |
-10 |
-5 |
0 |
5 |
10 |
15 |
|
Without Processing |
STOI |
0.2912 |
0.5012 |
0.5963 |
0.7256 |
0.8124 |
0.8874 |
|
SE+CUP-GG+NR-NMF+OU |
% STOI |
6.45 |
5.51 |
3.41 |
2.23 |
1.59 |
0.69 |
|
STOI |
0.3099 |
0.5288 |
0.6166 |
0.7417 |
0.8253 |
0.8935 |
|
|
SE+CUP-GG+WR-NMF+OU |
% STOI |
6.37 |
5.36 |
3.31 |
2.11 |
1.48 |
0.61 |
|
STOI |
0.3097 |
0.5281 |
0.6160 |
0.7409 |
0.8244 |
0.8928 |
|
|
SE+CUP-GG+β-NMF+OU |
% STOI |
6.27 |
5.11 |
3.14 |
2.06 |
1.45 |
0.58 |
|
STOI |
0.3094 |
0.5268 |
0.6150 |
0.7405 |
0.8242 |
0.8925 |
|
|
SE+CUP GG+NMF[9] |
% STOI |
6.04 |
5.14 |
2.98 |
1.89 |
1.42 |
0.54 |
|
STOI |
0.3087 |
0.5269 |
0.6140 |
0.7393 |
0.8239 |
0.8922 |
|
NMF+OU[12] |
% STOI |
3.95 |
3.11 |
2.49 |
0.88 |
0.59 |
0.41 |
|
STOI |
0.3027 |
0.5167 |
0.6111 |
0.7319 |
0.8171 |
0.8910 |
|
|
CUP-GG[9] |
% STOI |
3.95 |
3.15 |
2.45 |
1.75 |
0.78 |
0.28 |
|
STOI |
0.3027 |
0.5169 |
0.6109 |
0.7383 |
0.8187 |
0.8898 |
|
|
CUP-NG[9] |
% STOI |
3.54 |
2.84 |
2.93 |
1.06 |
0.58 |
0.15 |
|
STOI |
0.3015 |
0.5154 |
0.6137 |
0.7332 |
0.8171 |
0.8887 |
|
|
CUP[8] |
% STOI |
2.91 |
2.47 |
1.79 |
0.58 |
0.18 |
0.06 |
|
STOI |
0.2996 |
0.5135 |
0.6069 |
0.7298 |
0.8138 |
0.8879 |
|
|
WR NMF[14] |
% STOI |
2.54 |
2.11 |
1.82 |
0.75 |
0.34 |
0.09 |
|
STOI |
0.2985 |
0.5117 |
0.6071 |
0.7310 |
0.8151 |
0.8882 |
|
|
NR NMF[14] |
% STOI |
2.12 |
1.85 |
1.56 |
0.59 |
0.19 |
0.11 |
|
STOI |
0.2973 |
0.5104 |
0.6056 |
0.7298 |
0.8139 |
0.8883 |
|
|
PR NMF[11] |
% STOI |
1.54 |
1.26 |
0.85 |
0.18 |
0.08 |
0.07 |
|
STOI |
0.2956 |
0.5075 |
0.6013 |
0.7269 |
0.8130 |
0.8880 |
|
|
HRNR-SPU[13] |
% STOI |
-2.26 |
-2.11 |
-1.35 |
-1.65 |
-1.21 |
-1.23 |
|
STOI |
0.2846 |
0.4906 |
0.5882 |
0.7136 |
0.8025 |
0.8764 |
|
|
HRNR[5] |
% STOI |
-2.78 |
-2.17 |
-2.09 |
-1.31 |
-1.43 |
-1.5 |
|
STOI |
0.2831 |
0.4903 |
0.5838 |
0.7161 |
0.8007 |
0.8741 |
Table 23. Comparison of Average SNR, SDR, Seg SNR performance measures for the 30 speech signals corrupted by F16 noise under Input SNRs of -10 dB, -5dB, 0dB, 5 dB, 10 dB, 15 dB
|
Input SNR in dB Method |
Performance Measure |
-10 |
-5 |
0 |
5 |
10 |
15 |
|
SE+CUP-GG+NR-NMF+OU |
SNR |
4.21 |
7.57 |
9.89 |
11.78 |
15.68 |
19.85 |
|
SDR |
3.91 |
6.34 |
8.85 |
10.12 |
13.54 |
18.02 |
|
|
Seg SNR |
3.84 |
5.92 |
7.54 |
9.85 |
12.86 |
16.84 |
|
|
SE+CUP-GG+WR-NMF+OU |
SNR |
4.18 |
6.48 |
8.92 |
10.29 |
13.75 |
19.89 |
|
SDR |
3.48 |
5.69 |
8.67 |
10.08 |
13.21 |
17.98 |
|
|
Seg SNR |
3.37 |
5.52 |
7.46 |
9.85 |
12.95 |
16.39 |
|
|
SE+CUP-GG+β-NMF+OU |
SNR |
3.84 |
6.74 |
8.75 |
10.12 |
13.54 |
18.54 |
|
SDR |
3.49 |
5.68 |
8.42 |
9.58 |
13.24 |
17.62 |
|
|
Seg SNR |
3.32 |
5.73 |
7.42 |
9.92 |
12.97 |
15.84 |
|
|
SE+CUP GG+NMF[9] |
SNR |
3.41 |
6.12 |
8.11 |
9.48 |
13.44 |
18.52 |
|
SDR |
3.18 |
6.02 |
8.13 |
9.37 |
13.27 |
17.23 |
|
|
Seg SNR |
2.97 |
5.12 |
6.78 |
9.02 |
12.97 |
15.47 |
|
|
NMF+OU[12] |
SNR |
3.12 |
3.76 |
7.32 |
8.75 |
12.82 |
17..31 |
|
SDR |
2.81 |
3.36 |
7.37 |
8.45 |
11.97 |
14.21 |
|
|
Seg SNR |
2.35 |
4.08 |
6.04 |
8.24 |
11.48 |
13.74 |
|
|
CUP-GG[9] |
SNR |
3.14 |
5.85 |
7.74 |
8.95 |
12.04 |
17.84 |
|
SDR |
2.84 |
3.42 |
7.68 |
8.82 |
12.75 |
15.98 |
|
|
Seg SNR |
2.86 |
5.24 |
6.89 |
8.56 |
12.35 |
14.82 |
|
|
CUP-NG[9] |
SNR |
3.05 |
4.48 |
7.75 |
9.48 |
13.02 |
17.69 |
|
SDR |
2.86 |
3.45 |
7.38 |
8.75 |
12.62 |
15.34 |
|
|
Seg SNR |
2.16 |
4.01 |
6.34 |
8.37 |
11.25 |
13.59 |
|
|
CUP[8] |
SNR |
3.21 |
3.56 |
7.57 |
9.02 |
12.75 |
17.04 |
|
SDR |
2.62 |
3.25 |
7.16 |
8.68 |
12.54 |
15.32 |
|
|
Seg SNR |
1.59 |
2.27 |
5.82 |
8.04 |
11.14 |
13.26 |
|
|
NR-NMF[14] |
SNR |
1.69 |
3.84 |
6.36 |
8.75 |
13.45 |
15.97 |
|
SDR |
0.84 |
2.61 |
5.83 |
7.95 |
12.34 |
14.95 |
|
|
Seg SNR |
-2.43 |
-0.74 |
2.98 |
6.34 |
10.79 |
13.12 |
|
|
WR-NMF[14] |
SNR |
1.28 |
3.72 |
5.92 |
8.67 |
12.88 |
15.67 |
|
SDR |
0.25 |
2.36 |
5.84 |
7.86 |
11.69 |
15.12 |
|
|
Seg SNR |
-3.02 |
-0.98 |
2.57 |
5.32 |
10.85 |
13.64 |
|
|
PR NMF [11] |
SNR |
0.12 |
2.21 |
4.34 |
7.68 |
11.46 |
15.54 |
|
SDR |
-2.11 |
1.32 |
3.12 |
6.98 |
10.21 |
13.02 |
|
|
Seg SNR |
-3.42 |
-1.23 |
2.31 |
4.92 |
9.62 |
12.58 |
|
|
HRNR-SPU [13] |
SNR |
-3.95 |
-1.26 |
0.12 |
5.36 |
11.67 |
15.23 |
|
SDR |
-5.87 |
-3.59 |
-0.12 |
3.14 |
6.45 |
12.05 |
|
|
Seg SNR |
-8.86 |
-3.54 |
-1.24 |
2.86 |
6.95 |
9.87 |
|
|
HRNR[5] |
SNR |
-5.01 |
-1.76 |
-0.02 |
5.52 |
10.72 |
12.41 |
|
SDR |
-7.24 |
-2.66 |
-0.23 |
2.81 |
9.68 |
11.54 |
|
|
Seg SNR |
-9.11 |
-4.23 |
-1.12 |
2.37 |
5.93 |
9.45 |
Table 24. Comparison of Average PESQ, ∆PESQ performance measures for the 30 speech signals corrupted by M109 noise under Input SNRs of -10 dB, -5dB, 0dB, 5 dB, 10 dB, 15 dB.
|
Input SNR in dB Method |
Performance Measure |
-10 |
-5 |
0 |
5 |
10 |
15 |
|
Without Processing |
PESQ |
1.39 |
1.72 |
1.9 |
2.28 |
2.52 |
2.91 |
|
SE+CUP-GG+NR-NMF+OU |
PESQ |
1.61 |
2.26 |
2.78 |
3.19 |
3.38 |
3.73 |
|
∆ PESQ |
0.22 |
0.54 |
0.88 |
0.91 |
0.86 |
0.82 |
|
|
SE+CUP-GG+WR-NMF+OU |
PESQ |
1.58 |
2.21 |
2.76 |
3.17 |
3.34 |
3.72 |
|
∆ PESQ |
0.19 |
0.49 |
0.86 |
0.89 |
0.82 |
0.81 |
|
|
SE+CUP-GG+β-NMF+OU |
PESQ |
1.56 |
2.15 |
2.71 |
3.13 |
3.35 |
3.69 |
|
∆ PESQ |
0.17 |
0.43 |
0.81 |
0.85 |
0.83 |
0.78 |
|
|
SE+CUP GG+NMF[9] |
PESQ |
1.54 |
2.1 |
2.67 |
3.07 |
3.3 |
3.62 |
|
∆ PESQ |
0.15 |
0.38 |
0.77 |
0.79 |
0.78 |
0.71 |
|
|
NMF+OU[12] |
PESQ |
1.51 |
2.01 |
2.52 |
2.88 |
3.1 |
3.45 |
|
∆ PESQ |
0.12 |
0.29 |
0.62 |
0.6 |
0.58 |
0.54 |
|
|
CUP-GG[9] |
PESQ |
1.51 |
2.08 |
2.55 |
2.95 |
3.13 |
3.51 |
|
∆ PESQ |
0.12 |
0.36 |
0.65 |
0.67 |
0.61 |
0.6 |
|
|
CUP-NG[9] |
PESQ |
1.48 |
2 |
2.43 |
2.8 |
2.99 |
3.37 |
|
∆ PESQ |
0.09 |
0.28 |
0.53 |
0.52 |
0.47 |
0.46 |
|
|
CUP[8] |
PESQ |
1.4 |
1.95 |
2.44 |
2.74 |
3 |
3.33 |
|
∆ PESQ |
0.01 |
0.23 |
0.54 |
0.46 |
0.48 |
0.42 |
|
|
WR NMF[14] |
PESQ |
1.5 |
2.06 |
2.48 |
2.89 |
3.15 |
3.47 |
|
∆ PESQ |
0.11 |
0.34 |
0.58 |
0.61 |
0.63 |
0.56 |
|
|
NR NMF[14] |
PESQ |
1.51 |
2.08 |
2.46 |
2.87 |
3.13 |
3.47 |
|
∆ PESQ |
0.12 |
0.36 |
0.56 |
0.59 |
0.61 |
0.56 |
|
|
PR NMF[11] |
PESQ |
1.48 |
1.94 |
2.22 |
2.69 |
2.94 |
3.28 |
|
∆ PESQ |
0.09 |
0.22 |
0.32 |
0.41 |
0.42 |
0.37 |
|
|
HRNR-SPU[13] |
PESQ |
1.45 |
1.81 |
2.18 |
2.57 |
2.82 |
3.16 |
|
∆ PESQ |
0.06 |
0.09 |
0.28 |
0.29 |
0.3 |
0.25 |
|
|
HRNR[5] |
PESQ |
1.28 |
1.79 |
2.06 |
2.49 |
2.72 |
3.08 |
|
∆ PESQ |
-0.11 |
0.07 |
0.16 |
0.21 |
0.2 |
0.17 |
Table 25. Comparison of Average STOI, % STOI performance measures for the 30 speech signals corrupted by M109 noise under Input SNRs of -10 dB, -5dB, 0dB, 5 dB, 10 dB, 15 dB.
|
Input SNR in dB Method |
Performance Measure |
-10 |
-5 |
0 |
5 |
10 |
15 |
|
Without Processing |
STOI |
0.2826 |
0.4965 |
0.5982 |
0.7145 |
0.8147 |
0.8712 |
|
SE+CUP-GG+NR-NMF+OU |
% STOI |
6.23 |
5.46 |
3.44 |
2.26 |
1.61 |
0.65 |
|
STOI |
0.3002 |
0.5236 |
0.6187 |
0.7306 |
0.8278 |
0.8768 |
|
|
SE+CUP-GG+WR-NMF+OU |
% STOI |
6.21 |
5.14 |
3.12 |
2.08 |
1.42 |
0.56 |
|
STOI |
0.3001 |
0.5220 |
0.6168 |
0.7293 |
0.8262 |
0.8761 |
|
|
SE+CUP-GG+β-NMF+OU |
% STOI |
6.14 |
5.04 |
3.09 |
1.96 |
1.41 |
0.57 |
|
STOI |
0.2999 |
0.5215 |
0.6166 |
0.7285 |
0.8261 |
0.8761 |
|
|
SE+CUP GG+NMF[9] |
% STOI |
5.96 |
5.12 |
2.78 |
1.82 |
1.39 |
0.51 |
|
STOI |
0.2994 |
0.5219 |
0.6148 |
0.7275 |
0.8260 |
0.8756 |
|
NMF+OU[12] |
% STOI |
3.89 |
3.01 |
2.51 |
0.92 |
0.58 |
0.43 |
|
STOI |
0.2933 |
0.5114 |
0.6132 |
0.7211 |
0.8194 |
0.8749 |
|
|
CUP-GG[9] |
% STOI |
3.91 |
3.12 |
2.36 |
1.85 |
0.84 |
0.31 |
|
STOI |
0.2936 |
0.5119 |
0.6123 |
0.7277 |
0.8215 |
0.8739 |
|
|
CUP-NG[9] |
% STOI |
3.51 |
2.89 |
2.91 |
1.12 |
0.61 |
0.18 |
|
STOI |
0.2925 |
0.51084 |
0.6156 |
0.7225 |
0.8196 |
0.8727 |
|
|
CUP[8] |
% STOI |
2.81 |
2.42 |
1.74 |
0.56 |
0.14 |
0.03 |
|
STOI |
0.2905 |
0.5085 |
0.6086 |
0.7185 |
0.8158 |
0.8714 |
|
|
WR NMF[14] |
% STOI |
2.49 |
1.98 |
1.75 |
0.71 |
0.28 |
0.12 |
|
STOI |
0.2896 |
0.5063 |
0.6086 |
0.7195 |
0.8169 |
0.8722 |
|
|
NR NMF[14] |
% STOI |
2.15 |
1.79 |
1.52 |
0.56 |
0.21 |
0.13 |
|
STOI |
0.2886 |
0.5054 |
0.6073 |
0.7185 |
0.8164 |
0.8723 |
|
|
PR NMF[11] |
% STOI |
1.53 |
1.22 |
0.89 |
0.21 |
0.11 |
0.06 |
|
STOI |
0.2869 |
0.5025 |
0.6035 |
0.716 |
0.8155 |
0.8717 |
|
|
HRNR-SPU[13] |
% STOI |
-2.18 |
-2.11 |
-1.43 |
-1.57 |
-1.24 |
-1.19 |
|
STOI |
0.2764 |
0.4860 |
0.5896 |
0.7033 |
0.8045 |
0.8608 |
|
|
HRNR[5] |
% STOI |
-2.65 |
-2.14 |
-2.01 |
-1.21 |
-1.36 |
-1.57 |
|
STOI |
0.2751 |
0.4858 |
0.5861 |
0.7058 |
0.8036 |
0.8575 |
Table 26. Comparison of Average SNR, SDR, Seg SNR performance measures for the 30 speech signals corrupted by M109 noise under Input SNRs of -10 dB, -5dB, 0dB, 5 dB, 10 dB, 15 dB
|
Input SNR in dB Method |
Performance Measure |
-10 |
-5 |
0 |
5 |
10 |
15 |
|
SE+CUP-GG+NR-NMF+OU |
SNR |
3.98 |
7.42 |
9.75 |
11.69 |
15.72 |
20.04 |
|
SDR |
3.87 |
6.27 |
8.73 |
10.25 |
13.68 |
18.24 |
|
|
Seg SNR |
3.67 |
5.84 |
7.43 |
9.74 |
12.75 |
16.75 |
|
|
SE+CUP-GG+WR-NMF+OU |
SNR |
4.09 |
6.37 |
8.86 |
10.06 |
13.64 |
19.75 |
|
SDR |
3.34 |
5.57 |
8.53 |
9.98 |
13.14 |
17.85 |
|
|
Seg SNR |
3.32 |
5.41 |
7.38 |
9.76 |
12.87 |
16.27 |
|
|
SE+CUP-GG+β-NMF+OU |
SNR |
3.89 |
6.84 |
8.79 |
10.25 |
13.67 |
18.72 |
|
SDR |
3.36 |
6.45 |
8.34 |
9.42 |
13.11 |
17.39 |
|
|
Seg SNR |
3.24 |
5.62 |
7.28 |
9.85 |
12.82 |
15.71 |
|
|
SE+CUP GG+NMF[9] |
SNR |
3.51 |
6.25 |
8.13 |
9.61 |
13.52 |
18.78 |
|
SDR |
3.14 |
5.97 |
8.09 |
9.24 |
13.18 |
17.16 |
|
|
Seg SNR |
2.82 |
5.04 |
6.63 |
8.87 |
12.76 |
15.31 |
|
|
NMF+OU[12] |
SNR |
3.11 |
3.68 |
7.25 |
8.65 |
12.74 |
17.24 |
|
SDR |
2.72 |
3.12 |
7.02 |
8.27 |
11.86 |
14.13 |
|
|
Seg SNR |
2.23 |
3.97 |
5.89 |
8.13 |
11.34 |
13.62 |
|
|
CUP-GG[9] |
SNR |
3.08 |
5.74 |
7.65 |
8.87 |
11.96 |
17.69 |
|
SDR |
2.86 |
3.31 |
7.57 |
8.74 |
12.66 |
15.84 |
|
|
Seg SNR |
2.64 |
4.86 |
6.75 |
8.52 |
12.21 |
14.76 |
|
|
CUP-NG[9] |
SNR |
2.98 |
4.34 |
7.64 |
9.27 |
12.98 |
17.42 |
|
SDR |
2.78 |
3.38 |
7.17 |
8.68 |
12.58 |
15.21 |
|
|
Seg SNR |
2.12 |
3.94 |
6.03 |
8.24 |
11.03 |
13.62 |
|
|
CUP[8] |
SNR |
3.17 |
3.47 |
7.48 |
8.97 |
12.65 |
16.93 |
|
SDR |
2.54 |
3.16 |
7.09 |
8.57 |
12.38 |
15.24 |
|
|
Seg SNR |
1.42 |
2.11 |
5.74 |
7.94 |
10.97 |
13.16 |
|
|
NR-NMF[14] |
SNR |
1.58 |
3.72 |
6.12 |
8.63 |
13.32 |
15.76 |
|
SDR |
0.79 |
2.58 |
5.72 |
7.88 |
12.26 |
14.83 |
|
|
Seg SNR |
-2.37 |
-0.64 |
2.86 |
6.12 |
10.62 |
13.67 |
|
|
WR-NMF[14] |
SNR |
1.19 |
3.64 |
5.85 |
8.54 |
12.67 |
15.58 |
|
SDR |
0.23 |
2.28 |
5.75 |
7.76 |
11.58 |
15.02 |
|
|
Seg SNR |
-3.11 |
-0.71 |
2.48 |
5.28 |
10.74 |
13.24 |
|
|
PR NMF [11] |
SNR |
0.14 |
2.18 |
3.97 |
7.57 |
11.24 |
15.31 |
|
SDR |
-2.01 |
1.28 |
3.09 |
6.79 |
10.07 |
12.95 |
|
|
Seg SNR |
-3.25 |
-1.18 |
2.38 |
4.75 |
9.54 |
12.47 |
|
|
HRNR-SPU [13] |
SNR |
-3.82 |
-1.13 |
0.09 |
5.48 |
11.79 |
15.38 |
|
SDR |
-5.64 |
-3.02 |
-0.01 |
2.97 |
6.27 |
11.95 |
|
|
Seg SNR |
-7.89 |
-3.85 |
-0.82 |
2.98 |
7.05 |
10.15 |
|
|
HRNR[5] |
SNR |
-4.82 |
-1.64 |
-0.09 |
5.68 |
10.69 |
13.54 |
|
SDR |
-6.98 |
-2.47 |
-0.14 |
2.89 |
9.59 |
11.38 |
|
|
Seg SNR |
-8.12 |
-4.11 |
-0.96 |
2.42 |
5.85 |
9.27 |
Table 27. Comparison of Average PESQ, ∆PESQ performance measures for the 30 speech signals corrupted by street noise under Input SNRs of -10 dB, -5dB, 0dB, 5 dB, 10 dB, 15 dB
|
Input SNR in dB Method |
Performance Measure |
-10 |
-5 |
0 |
5 |
10 |
15 |
|
Without Processing |
PESQ |
1.07 |
1.56 |
1.75 |
2.12 |
2.25 |
2.47 |
|
SE+CUP-GG+NR-NMF+OU |
PESQ |
1.31 |
2.15 |
2.66 |
3.07 |
3.14 |
3.26 |
|
∆ PESQ |
0.24 |
0.59 |
0.91 |
0.95 |
0.89 |
0.79 |
|
|
SE+CUP-GG+WR-NMF+OU |
PESQ |
1.31 |
2.13 |
2.62 |
3.02 |
3.12 |
3.29 |
|
∆ PESQ |
0.24 |
0.57 |
0.87 |
0.9 |
0.87 |
0.82 |
|
|
SE+CUP-GG+β-NMF+OU |
PESQ |
1.29 |
2.14 |
2.63 |
3.04 |
3.08 |
3.23 |
|
∆ PESQ |
0.22 |
0.58 |
0.88 |
0.92 |
0.83 |
0.76 |
|
|
SE+CUP GG+NMF[9] |
PESQ |
1.3 |
2.01 |
2.61 |
2.94 |
3.04 |
3.18 |
|
∆ PESQ |
0.23 |
0.45 |
0.86 |
0.82 |
0.79 |
0.71 |
|
|
NMF+OU[12] |
PESQ |
1.16 |
1.91 |
2.43 |
2.82 |
2.86 |
3.07 |
|
∆ PESQ |
0.09 |
0.35 |
0.68 |
0.7 |
0.61 |
0.6 |
|
|
CUP-GG[9] |
PESQ |
1.22 |
1.97 |
2.44 |
2.83 |
2.9 |
3.1 |
|
∆ PESQ |
0.15 |
0.41 |
0.69 |
0.71 |
0.65 |
0.63 |
|
|
CUP-NG[9] |
PESQ |
1.19 |
1.94 |
2.41 |
2.8 |
2.87 |
3.07 |
|
∆ PESQ |
0.12 |
0.38 |
0.66 |
0.68 |
0.62 |
0.6 |
|
|
CUP[8] |
PESQ |
1.15 |
1.9 |
2.38 |
2.73 |
2.83 |
2.99 |
|
∆ PESQ |
0.08 |
0.34 |
0.63 |
0.61 |
0.58 |
0.52 |
|
|
WR NMF[14] |
PESQ |
1.2 |
1.95 |
2.36 |
2.79 |
2.86 |
3.03 |
|
∆ PESQ |
0.13 |
0.39 |
0.61 |
0.67 |
0.61 |
0.56 |
|
|
NR NMF[14] |
PESQ |
1.18 |
1.93 |
2.39 |
2.81 |
2.87 |
3.06 |
|
∆ PESQ |
0.11 |
0.37 |
0.64 |
0.69 |
0.62 |
0.59 |
|
|
PR NMF[11] |
PESQ |
1.14 |
1.85 |
2.22 |
2.6 |
2.7 |
2.89 |
|
∆ PESQ |
0.07 |
0.29 |
0.47 |
0.48 |
0.45 |
0.42 |
|
|
HRNR-SPU[13] |
PESQ |
1.11 |
1.8 |
2.16 |
2.51 |
2.63 |
2.8 |
|
∆ PESQ |
0.04 |
0.24 |
0.41 |
0.39 |
0.38 |
0.33 |
|
|
HRNR[5] |
PESQ |
1.09 |
1.74 |
2.11 |
2.41 |
2.51 |
2.7 |
|
∆ PESQ |
0.02 |
0.18 |
0.36 |
0.29 |
0.26 |
0.23 |
Table 28. Comparison of Average STOI, % STOI performance measures for the 30 speech signals corrupted by street noise under Input SNRs of -10 dB, -5dB, 0dB, 5 dB, 10 dB, 15 dB
|
Input SNR in dB Method |
Performance Measure |
-10 |
-5 |
0 |
5 |
10 |
15 |
|
Without Processing |
STOI |
0.3212 |
0.5672 |
0.6723 |
0.7562 |
0.8345 |
0.9321 |
|
SE+CUP-GG+NR-NMF+OU |
% STOI |
7.03 |
6.12 |
3.97 |
2.81 |
2.12 |
1.01 |
|
STOI |
0.3437 |
0.6019 |
0.6989 |
0.7774 |
0.8522 |
0.9415 |
|
|
SE+CUP-GG+WR-NMF+OU |
% STOI |
6.94 |
5.91 |
3.89 |
2.63 |
2.03 |
0.97 |
|
STOI |
0.3435 |
0.6007 |
0.6984 |
0.7760 |
0.8514 |
0.9411 |
|
|
SE+CUP-GG+β-NMF+OU |
% STOI |
6.89 |
5.72 |
3.76 |
2.51 |
1.92 |
0.91 |
|
STOI |
0.3433 |
0.5996 |
0.6975 |
0.7752 |
0.8505 |
0.9405 |
|
SE+CUP GG+NMF[9] |
% STOI |
6.76 |
5.34 |
3.63 |
2.45 |
1.69 |
0.88 |
|
STOI |
0.3429 |
0.5974 |
0.6967 |
0.7747 |
0.8486 |
0.9403 |
|
|
NMF+OU[12] |
% STOI |
4.63 |
3.71 |
2.79 |
1.31 |
0.78 |
0.61 |
|
STOI |
0.3360 |
0.5882 |
0.6910 |
0.7661 |
0.8410 |
0.9377 |
|
|
CUP-GG[9] |
% STOI |
4.87 |
3.63 |
3.32 |
1.64 |
0.43 |
0.21 |
|
STOI |
0.3368 |
0.5877 |
0.69462 |
0.7686 |
0.8381 |
0.9340 |
|
|
CUP-NG[9] |
% STOI |
4.74 |
3.61 |
3.16 |
1.72 |
0.48 |
0.22 |
|
STOI |
0.3364 |
0.5876 |
0.6935 |
0.7692 |
0.8385 |
0.9341 |
|
|
CUP[8] |
% STOI |
3.56 |
2.78 |
2.47 |
0.89 |
0.39 |
0.23 |
|
STOI |
0.3326 |
0.5829 |
0.6889 |
0.7629 |
0.8377 |
0.9342 |
|
|
WR NMF[14] |
% STOI |
2.83 |
2.24 |
1.97 |
0.78 |
0.43 |
0.24 |
|
STOI |
0.3302 |
0.5799 |
0.6855 |
0.7621 |
0.8380 |
0.9343 |
|
|
NR NMF[14] |
% STOI |
2.44 |
2.02 |
1.78 |
0.76 |
0.45 |
0.19 |
|
STOI |
0.3289 |
0.5786 |
0.6842 |
0.7619 |
0.8382 |
0.9338 |
|
|
PR NMF[11] |
% STOI |
1.57 |
1.13 |
0.98 |
0.42 |
0.21 |
0.15 |
|
STOI |
0.3262 |
0.5736 |
0.6788 |
0.7593 |
0.8362 |
0.9335 |
|
|
HRNR-SPU[13] |
% STOI |
-2.32 |
-2.01 |
-1.12 |
-1.56 |
-1.09 |
-1.1 |
|
STOI |
0.3137 |
0.5557 |
0.6647 |
0.7443 |
0.8254 |
0.9218 |
|
|
HRNR[5] |
% STOI |
-2.73 |
-2.54 |
-1.98 |
-1.87 |
-1.54 |
-1.23 |
|
STOI |
0.3124 |
0.5527 |
0.6589 |
0.7420 |
0.8216 |
0.9206 |
Table 29. Comparison of Average SNR, SDR, Seg SNR performance measures for the 30 speech signals corrupted by street noise under Input SNRs of -10 dB, -5dB, 0dB, 5 dB, 10 dB, 15 dB
|
Input SNR in dB Method |
Performance Measure |
-10 |
-5 |
0 |
5 |
10 |
15 |
|
SE+CUP-GG+NR-NMF+OU |
SNR |
4.97 |
8.12 |
10.24 |
12.15 |
16.25 |
21.09 |
|
SDR |
4.21 |
6.52 |
7.54 |
11.63 |
15.63 |
18.97 |
|
|
Seg SNR |
3.83 |
6.34 |
7.58 |
10.98 |
14.79 |
17.13 |
|
|
SE+CUP-GG+WR-NMF+OU |
SNR |
4.21 |
7.58 |
10.31 |
11.61 |
16.57 |
20.85 |
|
SDR |
3.92 |
6.52 |
9.12 |
11.23 |
14.95 |
19.25 |
|
|
Seg SNR |
3.64 |
5.57 |
7.11 |
9.58 |
13.32 |
15.36 |
|
|
SE+CUP-GG+β-NMF+OU |
SNR |
4.59 |
7.08 |
10.21 |
11.64 |
15.96 |
20.48 |
|
SDR |
3.85 |
6.24 |
8.98 |
10.52 |
14.56 |
16.88 |
|
|
Seg SNR |
3.56 |
5.41 |
6.98 |
9.45 |
13.11 |
15.28 |
|
|
SE+CUP GG+NMF[9] |
SNR |
4.53 |
7.32 |
9.85 |
11.56 |
14.89 |
19.95 |
|
SDR |
3.74 |
5.98 |
8.68 |
10.35 |
14.38 |
16.78 |
|
|
Seg SNR |
3.32 |
5.57 |
7.31 |
9.64 |
13.28 |
15.48 |
|
|
NMF+OU[12] |
SNR |
2.75 |
3.89 |
7.84 |
11.14 |
14.84 |
18.58 |
|
SDR |
2.15 |
3.07 |
6.87 |
9.12 |
13.24 |
15.28 |
|
|
Seg SNR |
1.42 |
1.78 |
6.75 |
8.56 |
12.2 |
14.58 |
|
|
CUP-GG[9] |
SNR |
4.11 |
6.76 |
8.85 |
10.76 |
15.54 |
19.25 |
|
SDR |
3.78 |
6.77 |
8.59 |
10.64 |
13.87 |
16.27 |
|
|
Seg SNR |
3.27 |
5.34 |
7.07 |
8.86 |
12.54 |
15.04 |
|
|
CUP-NG[9] |
SNR |
4.14 |
5.67 |
8.46 |
10.29 |
13.95 |
19.12 |
|
SDR |
2.95 |
3.84 |
7.65 |
8.97 |
12.97 |
18.15 |
|
|
Seg SNR |
2.08 |
4.37 |
6.62 |
8.49 |
11.98 |
13.98 |
|
|
CUP[8] |
SNR |
2.26 |
3.57 |
7.86 |
9.42 |
13.57 |
18.12 |
|
SDR |
2.58 |
2.96 |
6.57 |
8.54 |
12.46 |
14.68 |
|
|
Seg SNR |
1.59 |
2.07 |
5.84 |
7.42 |
10.76 |
13.74 |
|
|
NR-NMF[14] |
SNR |
1.23 |
4.77 |
5.01 |
9.34 |
15.68 |
18.65 |
|
SDR |
0.92 |
2.78 |
4.67 |
10.45 |
14.38 |
18.24 |
|
|
Seg SNR |
-3.12 |
-0.87 |
3.21 |
6.64 |
10.75 |
13.54 |
|
|
WR-NMF[14] |
SNR |
0.58 |
2.98 |
4.37 |
9.32 |
14.86 |
18.24 |
|
SDR |
0.15 |
1.97 |
3.97 |
9.14 |
13.75 |
1.7.67 |
|
|
Seg SNR |
-3.65 |
-1.38 |
2.41 |
4.85 |
10.56 |
13.08 |
|
|
PR NMF [11] |
SNR |
0.09 |
1.78 |
4.06 |
8.21 |
12.69 |
17.12 |
|
SDR |
-1.89 |
1.23 |
2.97 |
6.86 |
12.07 |
15.14 |
|
|
Seg SNR |
-4.14 |
-2.42 |
1.28 |
3.76 |
8.79 |
11.84 |
|
|
HRNR-SPU [13] |
SNR |
1.87 |
1.74 |
3.87 |
6.76 |
12.25 |
16.86 |
|
SDR |
1.12 |
1.51 |
2.45 |
5.31 |
10.45 |
14.12 |
|
|
Seg SNR |
0.24 |
1.14 |
1.98 |
2.54 |
6.31 |
8.68 |
|
|
HRNR[5] |
SNR |
1.14 |
1.45 |
2.12 |
6.25 |
10.65 |
15.89 |
|
SDR |
0.78 |
1.25 |
2.14 |
5.31 |
10.37 |
15.11 |
|
|
Seg SNR |
0.09 |
0.67 |
1.54 |
2.11 |
5.75 |
8.96 |
VI. C onclusion
Statistical approaches and NMF approaches shows significant performance for speech Enhancement task. The assumption of speech spectral coefficients and noise spectral coefficients as super Gaussian provides improved PESQ, STOI, SNR values than to traditional speech enhancement methods. Template based Non-Negative Matrix Factorization (NMF) approach provides better
results than to traditional speech enhancement methods for Non-Stationary signals like speech. By combining the advantages of both statistical approaches and NMF approach the performance measures PESQ, SNR and STOI are improved significantly. This work gives the importance of statistical approaches, NMF approach and proposed work by combining statistical approaches and NMF. It is observed that combination of statistical and variants of NMF provides better noise enhanced speech.
APPENDIX
APPENDIX A
(Derivation of CUP Estimator by assuming Nagakami PDF for speech prior and Generalized Gamma Prior for noise )
The CUP estimator by assuming speech as Nagakami prior and noise as GGD is derived as in [8]
Assume the speech prior as Nagakami PDF as
Pa ( a ) =
( k
Г( k ) V 5 2 J
, 2 k - 1
( k 2) exp-- r a
V 5 J
(A.1)
Assume the noise prior as GGD as
x 2 v - 1
N V
—
„ 2
^N J
exp -ц
_ 2
5 NT /
(A.2)
In table 3, the comparison of average PESQ, ∆PESQ performance measures for the 30 speech signals corrupted by white noise under input SNRs of -10 dB, -5dB, 0dB, 5 dB, 10 dB, 15 dB is listed. It is observed that the SE + CUP-GG + NR-NMF + OU provides improved performance than all compared methods and it provides a ∆ PESQ value of 1.18 for the input signal corrupted under white noise at 0dB SNR. It is observed that SE+CUP-GG + NMF approach provides an ∆ PESQ of 1.16. Also it is observed that CUP-GG estimator provides an improved ∆ PESQ value of 0.92 compared to posterior WR-NMF of 0.68 at 0dB input SNR. It is noted that the Bayesian estimators exhibited comparable improvement under low SNRs than to traditional NMF approach. Also noted that combination of Bayesian estimator with NMF approach provides improved results in case of white noise.
In table 4, the Comparison of Average STOI, %STOI performance measures for the 30 speech signals corrupted by White noise under Input SNRs of -10 dB, -5dB, 0dB,
5 dB, 10 dB, 15dB is listed. It is observed that % STOI improvement of STOI values for SE + CUP –GG + NR -NMF+OU approach is 7.15, 6.04, 3.76, 2.64, 2.04, 1.12 and for CUP-GG estimator is 5.21, 4.87, 3.45, 1.99, 1.57, 0.67 and for WR-NMF approach is 2.91, 2.62, 2.23, 1.09, 0.87, 0.25 at input SNRs of -10 dB, -5dB, 0dB, 5 dB, 10 dB, 15 dB respectively. It is noted that at -10 dB and -5 dB SNRs there is significant improvement in SE+CUP-GG+NMF based approaches than to all other methods.
In table 5, the Comparison of Average SNR, SDR, Seg SNR performance measures for the 30 speech signals corrupted by White noise under input SNRs of -10 dB, -5dB, 0dB, 5 dB, 10 dB, 15 dB is listed. The proposed method SE+CUP-GG+NR-NMF+OU provides SNR values of 4.81, 6.94, 9.34, 15.79, 19.04, 23.38 and that for SE+CUP-GG+NMF approach are 4.21, 6.83, 8.15, 14.21, 17.97, 23.12. The NR-NMF approach provides SNR values of -1.34, 1.78, 7.23, 13.87, 17.68 and 22.34.
In table 6, the Comparison of Average PESQ, ∆PESQ performance measures for the 30 speech signals corrupted by Babble noise under input SNRs of -10 dB, -5dB, 0dB, 5 dB, 10 dB, 15 dB is listed. It is observed that the, SE + CUP-GG + NR-NMF + OU provides improved performance than to all compared methods and it provides a ∆ PESQ value of 0.82 for the input signal corrupted under Babble noise at 0dB SNR. It is observed that SE+ CUP-GG + NMF approach provides an PESQ improvement of 0.62. Also it is observed that CUP-GG estimators provides an improved ∆ PESQ value of 0.57 compared to posterior WR-NMF of 0.45 at 0dB input SNR. It is noted that the Bayesian estimators shown comparable improvement under low SNRs than to traditional NMF approach. Also noted that combination of Bayesian estimator with NMF approach provides improved results in case of Babble noise.
In table 7, the Comparison of Average STOI, %STOI performance measures for the 30 speech signals corrupted
by Babble noise under Input SNRs of -10 dB, -5dB, 0dB, 5 dB, 10 dB,
15dB is listed. It is observed that % STOI improvement of STOI values for SE + CUP –GG + NR -NMF+OU approach is 3.22, 4.36, 3.15, 2.21, 1.66, 0.54 and for CUP-GG estimator is -0.02, -0.01, 0.09, 0.06, 0.05, 0.03 and for WR-NMF approach is 1.32, 1.13, 0.78, 0.65, 0.34, 0.12 at input SNRs of -10 dB, -5dB, 0dB, 5 dB, 10 dB, 15 dB respectively. It is noted that at -10dB, -5 dB SNRs there is significant improvement in SE+CUP-GG+NMF based approaches than to all other methods.
In table 8, the Comparison of Average SNR, SDR, Seg SNR performance measures for the 30 speech signals corrupted by Babble noise under Input SNRs of -10 dB, -5dB, 0dB, 5 dB, 10 dB, 15 dB is listed. The proposed method SE+CUP-GG+NR-NMF+OU provides an SNR of 4.35, 7.65, 10.06, 11.86, 15.86, 20.84 and for SE+CUP-GG+NMF approach is 3.56, 6.21, 8.23, 9.65, 12.58, 18.43. The NR-NMF approach provides an SNR of 1.56, 3.67, 6.21, 8.68, 13.12, and 15.85
In Table 9, the comparison of Average PESQ, ∆PESQ performance measures for the 30 speech signals corrupted by Pink noise under input SNRs of -10 dB, -5dB, 0dB, 5 dB, 10 dB, 15 dB is listed. It is observed that the, SE + CUP-GG + NR-NMF + OU provides improved performance than to all compared methods and it provides a ∆ PESQ value of 1.02 for the input signal corrupted under Pink noise at 0dB SNR. It is observed that SE+CUP-GG + NMF approach provides PESQ improvement of 0.84. Also it is observed that CUP-GG estimators provides an improved ∆ PESQ value of 0.79 compared to posterior WR-NMF of 0.59 at 0dB input SNR. It is noted that the Bayesian estimators shown comparable improvement under low SNRs than to traditional NMF approach. Also noted that combination of Bayesian estimator with NMF approach provides improved results in case of Pink noise
In Table 10, the comparison of Average STOI, %STOI performance measures for the 30 speech signals corrupted by Pink noise under Input SNRs of -10 dB, -5dB, 0dB, 5
dB, 10 dB, 15dB is listed. It is observed that % STOI improvement of STOI values for SE + CUP –GG + NR -NMF+OU approach is 7.09, 6.23, 3.68, 2.45, 1.78, 0.89 and for CUP-GG estimator is 5.21, 4.87, 3.45, 1.99, 1.57, 0.64.98, 4.69, 2.61, 1.95, 1.46, 0.58 and for WR-NMF approach is 2.73, 2.34, 2.01, 0.93, 0.62, 0.24 at input SNRs of -10 dB, -5dB, 0dB, 5 dB, 10 dB, 15 dB respectively. It is noted that at -10 d, -5 dB SNRs there is significant improvement in SE+CUP-GG+NMF based approaches than to all other methods.
In table 11, the Comparison of Average SNR, SDR, Seg SNR performance measures for the 30 speech signals corrupted by Pink noise under Input SNRs of -10 dB, -5dB, 0dB, 5 dB, 10 dB, 15 dB is listed. The proposed method SE+CUP-GG+NR-NMF+OU provides an SNR of 4.67, 8.02, 10.21, 12.11, 16.22, 21.22 and for SE+CUP-GG+NMF approach is 4.62, 7.22, 9.87, 11.56, 15.07, 19.78. The NR-NMF approach provides an SNR of 1.23, 4.96, 5.21, 9.58, 15.86 and 18.94.
In table 12, the Comparison of Average PESQ, ∆PESQ performance measures for the 30 speech signals corrupted by Modulated Pink noise under input SNRs of -10 dB, -5dB, 0dB, 5 dB, 10 dB, 15 dB is listed. It is observed that the, SE + CUP-GG + NR-NMF + OU provides improved performance than to all compared methods and it provides a ∆ PESQ value of 0.91 for the input signal corrupted under Modulated Pink noise at 0dB SNR. It is observed that SE+CUP-GG + NMF approach provides an PESQ improvement of 0.83. Also it is observed that CUP-GG estimators provides an improved ∆ PESQ value of 0.92 compared to posterior WR-NMF of 0.72 at 0dB input SNR. It is noted that the Bayesian estimators shown comparable improvement under low SNRs than to traditional NMF approach. Also it is noted that combination of Bayesian estimator with NMF approach provides improved results in case of Modulated Pink noise.
In table 13, the Comparison of Average STOI, %STOI performance measures for the 30 speech signals corrupted
by Modulated Pink noise under input SNRs of -10 dB, -5dB, 0dB, 5 dB, 10 dB, 15dB is listed.It is observed that % STOI improvement of STOI values for SE + CUP – GG + NR-NMF +OU approach is 6.89, 5.12, 3.34, 2.16, 1.76, 0.89 and for CUP-GG estimator is 4.91, 3.95, 3.64, 1.96, 0.44, 0.27 and for WR-NMF approach is 2.67, 2.12, 1.98, 0.87, 0.45, 0.3 at input SNRs of -10 dB, -5dB, 0dB, 5 dB, 10 dB, 15 dB respectively. It is noted that at -10 d, -5 dB SNRs there is significant improvement in SE+CUP-GG+NMF based approaches than to all other methods.
In table 14, the Comparison of Average SNR, SDR, Seg SNR performance measures for the 30 speech signals corrupted by White noise under Input SNRs of -10 dB, -5dB, 0dB, 5 dB, 10 dB, 15 dB is listed. The proposed method SE+CUP-GG+NR-NMF+OU provides an SNR of 4.52, 7.96, 10.15, 12.01, 16.24, 20.98 and for
SE+CUP-GG+NMF approach is 4.54, 7.12, 9.65, 11.69, 15.98, 19.95. The NR-NMF approach provides an SNR of 1.22, 4.72, 5.35, 9.62, 15.89, 18.86.
In table 15, the Comparison of Average PESQ, ∆PESQ performance measures for the 30 speech signals corrupted by Factory noise under input SNRs of -10 dB, -5dB, 0dB, 5 dB, 10 dB, 15 dB is listed. It is observed that the, SE + CUP-GG + NR-NMF + OU provides improved performance than to all compared methods and it provides a ∆ PESQ value of 0.98 for the input signal corrupted under Factory noise at 0dB SNR. It is observed that SE+CUP-GG + NMF approach provides an PESQ improvement of 0.81. Also it is observed that CUP-GG estimators provides an improved ∆ PESQ value of 0.72 compared to posterior
WR-NMF of 0.62 at 0dB input SNR. It is noted that the Bayesian estimators shown comparable improvement under low SNRs than to traditional NMF approach. Also noted that combination of Bayesian estimator with NMF approach provides improved results in case of Factory noise
In table 16, the Comparison of Average STOI, %STOI performance measures for the 30 speech signals corrupted
by Factory noise under Input SNRs of -10 dB, -5dB, 0dB, 5 dB, 10 dB, 15dB is listed. It is observed that% STOI improvement of STOI values for
SE + CUP –GG + NR -NMF+OU approach is 6.67, 5.63, 3.54, 2.25, 1.63, 0.73 and for CUP-GG estimator is 3.98, 3.18, 2.59, 1.79, 0.85, 0.31 and for WR-NMF approach is 2.62, 2.21, 1.86, 0.79, 0.38, 0.12 at input SNRs of -10 dB, -5dB, 0dB, 5 dB, 10 dB, 15 dB respectively. It is noted that at -10 d, -5 dB SNRs there is significant improvement in SE+CUP-GG+NMF based approaches than to all other methods.
In Table 17, the Comparison of Average SNR, SDR, Seg SNR performance measures for the 30 speech signals corrupted by Factory noise under Input SNRs of -10 dB, -5dB, 0dB, 5 dB, 10 dB, 15 dB is listed. The proposed method SE+CUP-GG+NR-NMF+OU provides an SNR of 4.41, 7.85, 10.12, 11.97, 15.98, 20.85 and for SE+CUP-GG+NMF approach is 4.54, 7.12, 9.65, 11.69, 15.98, 19.95. The NR-NMF approach provides an SNR of 1.02, 5.49, 5.21, 9.51, 15.67, 15.67.
In table 18, the Comparison of Average PESQ, ∆PESQ performance measures for the 30 speech signals corrupted by Car noise under input SNRs of -10 dB, -5dB, 0dB, 5 dB, 10 dB, 15 dB is listed. It is observed that the, SE + CUP-GG + NR-NMF + OU provides improved performance than to all compared methods and it provides a ∆ PESQ value of 0.89 for the input signal corrupted under Car noise at 0dB SNR. It is observed that SE+CUP-GG + NMF approach provides an PESQ improvement of 0.79. Also it is observed that CUP-GG estimators provides an improved ∆ PESQ value of 0.67 compared to posterior WR-NMF of 0.59 at 0dB input SNR. It is noted that the Bayesian estimators shown comparable improvement under low SNRs than to traditional NMF approach. Also noted that combination of Bayesian estimator with NMF approach provides improved results in case of Car noise
In table 19, the Comparison of Average STOI, %STOI performance measures for the 30 speech signals corrupted
by Car noise under Input SNRs of -10 dB, -5dB, 0dB, 5 dB, 10 dB, 15dB is listed. It is observed that % STOI improvement of STOI values for SE + CUP –GG + NR -NMF+OU approach is 6.92, 5.84, 3.76, 2.63, 1.97, 0.95 and for CUP-GG estimator is 4.97, 3.78, 3.21, 1.78, 0.49, 0.43 and for WR-NMF approach is 2.71, 2.18, 1.99, 0.89, 0.36,0.14 at input SNRs of -10 dB, -5dB, 0dB, 5 dB, 10 dB, 15 dB respectively. It is noted that at -10 dB, -5 dB SNRs there is significant improvement in SE+CUP-GG+NMF based approaches than to all other methods.
In Table 20, the Comparison of Average SNR, SDR, Seg SNR performance measures for the 30 speech signals corrupted by Car noise under Input SNRs of -10 dB, -5dB, 0dB, 5 dB, 10 dB, 15 dB is listed. The proposed method SE+CUP-GG+NR-NMF+OU provides an SNR of 4.89, 8.14, 10.13, 12.05, 16.17, 21.18 and for SE+CUP-
GG+NMF approach is 4.43, 7.04, 9.74, 11.47, 14.97, 19.67. The NR-NMF approach provides an SNR of 1.17, 4.85, 5.12, 9.47, 15.76, 18.85.
In table 21, the Comparison of Average PESQ, ∆PESQ performance measures for the 30 speech signals corrupted by F16 noise under input SNRs of -10 dB, -5dB, 0dB, 5 dB, 10 dB, 15 dB is listed. It is observed that the, SE + CUP-GG + NR-NMF + OU provides improved performance than to all compared methods and it provides a ∆ PESQ value of 0.82 for the input signal corrupted under F16 noise at 0dB SNR. It is observed that SE+CUP-GG + NMF approach provides an PESQ improvement of 0.64. Also it is observed that CUP-GG estimators provides an improved ∆ PESQ value of 0.62 compared to posterior WR-NMF of 0.57 at 0dB input SNR. It is noted that the Bayesian estimators shown comparable improvement under low SNRs than to traditional NMF approach. Also noted that combination of Bayesian estimator with NMF approach provides improved results in case of F16 noise.
In table 22, the Comparison of Average STOI, %STOI performance measures for the 30 speech signals corrupted
by F16 noise under Input SNRs of -10 dB, -5dB, 0dB, 5 dB, 10 dB,15dB is listed. It is observed that % STOI improvement of STOI values for SE + CUP –GG + NR -NMF+OU approach is 6.45, 5.51, 3.41, 2.23, 1.59, 0.69 and for CUP-GG estimator is 3.95, 3.15, 2.45, 1.75, 0.78, 0.28 and for WR-NMF approach is 2.54, 2.11, 1.82, 0.75, 0.34, 0.09 at input SNRs of -10 dB, -5dB, 0dB, 5 dB, 10 dB, 15 dB respectively. It is noted that at -10 dB, -5 dB SNRs there is significant improvement in SE+CUP-GG+NMF based approaches than to all other methods.
In Table 23, the Comparison of Average SNR, SDR, Seg SNR performance measures for the 30 speech signals corrupted by F16 noise under Input SNRs of -10 dB, -5dB, 0dB, 5 dB, 10 dB, 15 dB is listed. The proposed method SE+CUP-GG+NR-NMF+OU provides an SNR of 4.21, 7.57, 9.89, 11.78, 15.68, 19.85, and for SE+CUP-GG+NMF approach is 3.41, 6.12, 8.11, 9.48, 13.4, 18.52. The NR-NMF approach provides an SNR of 1.69, 3.84, 6.36, 8.75, 13.45, 15.97.
In table 25, the Comparison of Average PESQ, ∆PESQ performance measures for the 30 speech signals corrupted by M109 noise under input SNRs of -10 dB, -5dB, 0dB, 5 dB, 10 dB, 15 dB is listed. It is observed that the, SE + CUP-GG + NR-NMF + OU provides improved performance than to all compared methods and it provides a ∆ PESQ value of 0.88 for the input signal corrupted under M109 noise at 0dB SNR. It is observed that SE+CUP-GG + NMF approach provides an PESQ improvement of 0.77. Also it is observed that CUP-GG estimators provides an improved ∆ PESQ value of 0.65 compared to posterior WR-NMF of 0.58 at 0dB input SNR. It is noted that the Bayesian estimators shown comparable improvement under low SNRs than to traditional NMF approach. Also it is noted that combination of Bayesian estimator with NMF approach provides improved results in case of M109 noise.
In table 26, the Comparison of Average STOI, %STOI performance measures for the 30 speech signals corrupted
by M109 noise under Input SNRs of -10 dB, -5dB, 0dB, 5 dB, 10 dB, 15dB is listed. It is observed that % STOI improvement of STOI values for SE + CUP –GG + NR -NMF+OU approach is 6.23, 5.46, 3.44, 2.26, 1.61, 0.65 and for CUP-GG estimator is 3.91, 3.12, 2.36, 1.85, 0.84, 0.31 and for WR-NMF approach is 2.49, 1.98, 1.75, 0.71, 0.28, 0.12 at input SNRs of -10 dB, -5dB, 0dB, 5 dB, 10 dB, 15 dB respectively. It is noted that at -10 dB, -5 dB SNRs there is significant improvement in SE+CUP-GG+NMF based approaches than to all other methods.
In table 27, the Comparison of Average SNR, SDR, Seg SNR performance measures for the 30 speech signals corrupted by M109 noise under Input SNRs of -10 dB, -5dB, 0dB, 5 dB, 10 dB, 15 dB is listed. The proposed method SE+CUP-GG+NR-NMF+OU provides an SNR of 3.98, 7.42, 9.75, 11.69, 15.72, 20.04, and for SE+CUP-GG+NMF approach is 3.51, 6.25, 8.13, 9.61, 13.52, 18.78. The NR-NMF approach provides an SNR of 3.51, 6.25, 8.13, 9.61, 13.52, 18.78
In table 27, the Comparison of Average PESQ, ∆PESQ performance measures for the 30 speech signals corrupted by Street noise under input SNRs of -10 dB, -5dB, 0dB, 5 dB, 10 dB, 15 dB is listed. It is observed that the, SE + CUP-GG + NR-NMF + OU provides improved performance than to all compared methods and it provides a ∆ PESQ value of 0.91 for the input signal corrupted under Street noise at 0dB SNR. It is observed that SE+CUP-GG + NMF approach provides an PESQ improvement of 0.86. Also it is observed that CUP-GG estimators provides an improved ∆ PESQ value of 0.69 compared to posterior WR-NMF of 0.61 at 0dB input SNR. It is noted that the Bayesian estimators shown comparable improvement under low SNRs than to traditional NMF approach. Also it is noted that combination of Bayesian estimator with NMF approach provides improved results in case of Street noise.
In table 28, the Comparison of Average STOI, %STOI performance measures for the 30 speech signals corrupted
by Street noise under Input SNRs of -10 dB, -5dB, 0dB, 5 dB, 10 dB, 15dB is listed. It is observed that % STOI improvement of STOI values for SE + CUP –GG + NR -NMF+OU approach is 7.03, 6.12, 3.97, 2.81, 2.12, 1.01 and for CUP-GG estimator is 4.87, 3.63, 3.32, 1.64, 0.43, 0.21and for WR-NMF approach is 2.83, 2.24, 1.97, 0.78, 0.43, 0.24 at input SNRs of -10 dB, -5dB, 0dB, 5 dB, 10 dB, 15 dB respectively. It is noted that at -10 dB, -5 dB SNRs there is significant improvement in SE+CUP-GG+NMF based approaches than to all other methods.
In table 29, the Comparison of Average SNR, SDR, Seg SNR performance measures for the 30 speech signals corrupted by Street noise under Input SNRs of -10 dB, -5dB, 0dB, 5 dB, 10 dB, 15 dB is listed. The proposed method SE+CUP-GG+NR-NMF+OU provides an SNR of 4.97, 8.12, 10.24, 12.15, 16.25, 21.09, and for SE+CUP-GG+NMF approach is 6.76, 5.34, 3.63, 2.45, 1.69, 0.88. The NR-NMF approach provides an SNR of 1.23, 4.77, 5.01, 9.34, 15.68, 18.65.
The CUP estimator is derived as in [8] using
S ( ^ E ( Ae ф S |y ф ) =
2 п да a ' ej ф ■ j J
f k
Г ( k ) V 5
k
I a 2 k -\
e xp
—
2 п да Л
2 ( k
Г ( k ) V 5 2 J
k
a
, 2 k - 1
V f k
k 2 — a
5 S J
2 ц' Г ( v ) 5 N
/ x 2 v -1
v a I 2ц
-
V 5 n J Г ( v ) 5 N
( A 2 v - 1
-
V 5 N J
exp r a
V 5 S
J
7 A
a
2 v - 1 /
2 o v ( a
x 2 v - 1
(A.3)
Г ( v ) 5 N V 5 N J
Г ( v 5 N V 5 2 J
exp
X---
- ц
-2
N J
exp
- ц
-2
N J
S ( р ) = E
2 n e j J 0
2 n
4^
Г(k)Г(v IK)k ^N (^N)
_ ' r 2 ) . 1 exPl ""Г
J
4^k
Г(k )Г(v )(.,) k aN (^N)
2^ exp

—
(A.4)
z
J a2 k+2 v+р—2 exp x 0-------------7
z
J a 2 k + 2 v — 2 exp
0 V
k
^ S
k
S 2
L I 7 2 I a
J N 7
L I й2 _ 2 I a
—
—
2 ur cos А ф |
----I a p
^ n 7 7
2ur cos Аф ।
----I a p
^ n 7 7
( ф | ф ) dad^
*ф$Ф (ф 1Ф) dod^
After rearranging and simplification using Gradshteyn and Ryzhik (2007 Eq. (3.462.1))
z
J xp 1 e — 2 x 2 "y x
— P 'У2 I
= ( 2 2 ) 2 Г ( p ) exp ^ I D — p '^ I
(A.5)
V 8 2 7 V 2n 2 7
By Comparing, the obtained terms are
p = 2k + 2v — 1; 2 = k "' 7 = 2rL cos Аф as°N °N (A.6)
By Substituting all parameters after simplification
TS( e ) = E ( A^e ф S | J , ф ) =
2? 4Wkk Г( 2 k + 2 v + р — 1) J0 Г(k)Г(V)^2)k (.N)2v
21* ^L
V S^N ^S
( r2 I с,ф exp l — ^
(A.7)
2 n 4 u v kk Г ( 2 k + 2 v — 1 )
J0 Г(k)Г(v)(.2)k (.N)2v
—
21 k
2 --^2* ^2
V S^N
exp
^2
V °n 7
(р ) = E ( А р е , ф S| y , ф ) =
exp exp
2 | D — ( 2 v + 2 k + в — 1 ) ( U ) p ф$ ф ( Ф 5 | Ф 5 ) d ф S ' ^ 1 D —( 2,. 2 . — 1 , U ) p ф, ф ( Ф , Ф , ) ^ Ф ,
2 п
Г ( 2 k + 2 v + р — 1 ) Г ( 2 k + 2 v — 1 )
k Ту 2 —т + ^г V T^ N C S.
—I
,Ф r и e^s exp exp — D
. 2 V 2 —
2 п
exp exp о V °n 7
u l D
—I
- ( 2 v + 2 k + р — 1 ) ( u ) p ф$ ф ( ф , ф , ) d ф S
—
- ( 2 v + 2 k — 1 ) ( u ) p фs ф ( ф , ф ) d ф s
(A.8)
APPENDIX B
(Derivation of CUP Estimator by assuming Gamma PDF for speech prior and Generalized Gamma Prior for noise priori)
The CUP estimator by assuming speech as Gamma prior and noise as GGD is derived as in [8]
Assume the speech prior as Gamma PDF as
/ \ 1 k-1 _ I a p.lai = t / x a exp — A ’ 9kГ(k) ( 9
(B.1)
Assume the noise prior as GGD as
Pys ( у к ) =
2 Ц r ( v ) a N
n 2 v - 1 a
V a N )
exp -ц
у - a

(B.2)
The CUP estimator is derived as in [20] and from Gradshteyn and Ryzhik (2007 Eq. (3.462.1))
^2 - P
J xp 1 e-2 = ( 2 2 ) 2 r ( p ) exp
— D „
V 8 2 ) p

(B.3)
By comparing the parameters we obtain parameters
3 Ц - 1 2 Ц У cos ( ф - ф )
p = 2 v + k + P - 1; 2 = —2 ; у =2------
^ N ^ S ^ N
The Numerator term is obtained finally as
2 n J 0
2Ц
Г ( k ) 9k r ( v ) a N


2 v + k + в - 1
Г ( 2 v + k + в -1 ) exp
| 1 2цу cos ( ^ S - ф¥ ) |
V ^ S ^ v )
8цкг м
Let
1 - 2 у ц^ у cos ( ф у - ф ¥ ) + ^ N Л
V 2 ^ N CT s Jv )
Divide Numerator for above U with C7S and ПN
x D - ( 2 v + k + в - 1 )
। 1 2 цу cos ( ф у - ф¥ )^
2 ^ S ^ N
2 V ^I^ N
(B.4)
a S - 2 У Ц^ cos( ф s - Ф Y )
then U =-------------7=------
2 ^^ n ЧЦ
Finally the estimated signal using (3) and using simplified equation as
2 Ц 1 2 ц
Г ( k ) 9 k Г ( v ) ( a N ) 2 v V ^ N )

Г ( 2 v + k + в - 1 ) exp U D x ' 2 )
-I
• (2 v + k + в - 1)
(U)
S < в ) = E ( А в е фS | y ф ) =
2f 2 Ц | 1 J 2 V - 1 1 2 Ц
J r ( k у r ( v И V и J V ^ N
Г ( 2 v + k + в - 1 ) exp
| 1 2 ц у cos ( ф - ф )
И____ ^ n
8 МИ
2 n q v 2 V 1 A n A [ 2 J
[ , . Ц Ц Г ( 2 v + k - 1 ) exp
J г ( k ) e k г ( v И V ^ N J V ^ N J ( )
| 1 2 ц у cos ( ф 8 - ф Y ) ]
-- — -------------
I _2 I
V as ________ g n _____ J
8 ц и 2
। 1 2 ц у cos ( ф - ф Y )^
---
- ( 2 v + k + в -1 )
S
2 N
2 N
P ф. ф ( ф 1 Ф ) d ^
S
X
। 1 2 ц у cos ( ф - ф Y p
---
da
- ( 2 v + k -1 )
S
P ф.
I ф ( ф ^ S ) d ^
(B.5)
S ( в ) = E ( А в е у ф S| y , ф ) =
I k + в - 1 )
2n(l Т1v+J
J И г Г ( 2 v + k + в - 1 ) exp YI D - (2 v + k e - 1) ( u ) P ф5 ф ( ф ^ S ) d ф S
0 V ^ N JV 2 J
_ I
2п < гч Л Iv + 2 J /2 A
J "J T Г ( 2 v + k - 1 ) exp YI D - (2 v + k - 1) ( U ) P ф5 ф ( ф S ^ S ) d Ф s
0 V CTN JV
(B.6)
^?(в ) = E ( A P e j " S | y , ф ) =
2 n
Г ( 2 v + k + в - 1 ) 1 2 ц )
-V в J J
eij>s exp
U и
D - (2 v + k p - 1) ( U ) P ф$ ф ( ф ^ S ) d Ф s
Г ( 2 v + k - 1 ) V ^ N J
2 n
7 и 2 J
J exp у I D
V 2
-
.(2 v + k - 1) ( U ) P ф$ ф (^ ^ S ) й Ф 5
References Performance analysis of statistical approaches and NMF approaches for speech enhancement
- R. Martin, “Speech enhancement based on minimum mean-square error estimation and super-Gaussian priors,” IEEE Trans. Speech Audio Process., vol. 13, no. 5, pp. 845–856, Sep. 2005.
- C.H.You, S. N.Koh, and S. Rahardja, “β-order MMSE spectral amplitude estimation for speech enhancement,” IEEE Trans. Speech Audio Process., vol. 13, no. 4, pp. 475–486, Jul. 2005
- B. Fodor, T. Fingscheidt, “MMSE speech enhancement under speech presence uncertainty assuming (generalized) gamma speech prioris throughout” IEEE International conf. on Acoustics, Speech and Signal Processing (ICASSP), pp.4033-4036, 25-30 March, 2012
- Lotter, T., Vary, P., Jan. 2005. Speech enhancement by MAP spectral amplitude estimation using a super-Gaussian speech model. EURASIP J. Appl. Signal Process. 2005 (7), 1110–1126
- Cyril Plapous, Clande Marro, Pascal Scalart, “Speech enhancement using Harmonic Regeneration” IEEE conf. on Acoustics, speech, and signal processing (ICASSP),Vol.1, pp. 157-160, 18-23 March, 2005
- K. Paliwal, K. W´ojcicki, and B. Shannon, “The importance of phase in speech enhancement,” Speech Commun., vol. 53, no. 4, pp. 465-494, Apr.2011
- Gerkmann, T., Krawczyk, M., Feb. 2013. MMSE-optimal spectral amplitude estimation given the STFT-phase. IEEE Signal Process. Lett. 20 (2), 129– 132.
- T. Gerkman, “Bayesian estimation of clean speech spectral coefficients given a priori knowledge of the phase,” IEEE Trans, Signal Process., vol. 62, no. 16, pp. 4199-4208, Aug. 2014
- Ravi Kumar. K, P. V. Subbaiah, “ Speech enhancement using MMSE estimation of amplitude and complex speech spectral coefficients under phase uncertainty” in Speech Communication journal, Vol.96, pp.10-27, 2018.
- D. D. Lee, H. S. Seung, “Algorithms for non-negative matrix factorization” in Proc. Advances in Neural information processing systems (NIPS)., pp. 556 – 562, 2001.
- N. J. Bryan, G. J. Mysore, “ An efficient posterior regularized latent variable model for interactive sound source separation, ” in International Conference of Machine Learning (ICML)., pp.208 – 216, June 2013
- Kwon Kisoo , Jong Won Shin , Nam Soo Kim “ NMF-based speech enhancement using bases update”. Sig Process Lett IEEE 2015;22(4):450–4
- Ravi Kumar K, P.V. Subbaiah, “Enhancement of noisy speech using sub-band harmonic regeneration and speech presence uncertain estimator” in Proc. IEEE International conference on Recent Trends in Electronics, Information & Communication Technology January, 2017
- Ravi Kumar, P.V. Subbaiah “ Posteriori Regularization based Non-Negative Matrix Factorization approach for
- Speech Enhancement, in International Journal of Innovative Technology and Exploring Engineering, V0l.8, Issue-5S, March, 2019
