Performance Comparison of the Optimized Ensemble Model with Existing Classifier Models

Author: Mukesh Kumar, Nidhi, Anas Quteishat, Ahmed Qtaishat
Journal: International Journal of Modern Education and Computer Science @ijmecs
Article in issue: 3 vol.14, 2022.
Free access
The purpose of this study is to conduct an empirical investigation and comparison of the effectiveness of various classifiers and ensembles of classifiers in predicting academic performance. The study will evaluate the performance and efficiency of ensemble techniques that employ several classifiers against the performance and efficiency of a single classifier. Reducing student attrition is a serious concern for educational institutions worldwide. Educators are looking for strategies to boost student retention and graduation rates. This is only achievable if at-risk students are appropriately recognized early on. However, most commonly used predictive models are inefficient and inaccurate due to intrinsic classifier limitations and the usage of minor factors. The study contributes to the body of knowledge by proposing the development of optimized ensemble learning model that can be used for improving academic performance prediction. Overall, the findings demonstrate that the approach of employing optimized ensemble learning (OEL) model approaches is extremely efficient and accurate in terms of predicting student performance and aiding in the identification of students who are in the fear of attrition.
Educational Data Mining, Feature Selection, Correlation Attribute Evaluator, Information Gain Attribute Evaluation, Gain Ratio Attribute Evaluation
Short address: https://sciup.org/15018461
IDR: 15018461 | DOI: 10.5815/ijmecs.2022.03.05
Text of the scientific article Performance Comparison of the Optimized Ensemble Model with Existing Classifier Models
Currently, data mining is used in fields such as finance, marketing, healthcare, engineering, government, security, and education. An established field for finding significant patterns and relationships that help users extract information and value from data. Data mining can be used in higher education to find student patterns, automate tasks and predict academic success and this is called Education Data Mining (EDM) [1]. The efficiency and performance prediction accuracy of the generated models are not good enough to ensure early student identification and intervention. As a result, student retention, development, and graduation rates have been poor, negatively impacting society and the economy [2].
The increased use of technology in schools has made data available. EDM delivers a wealth of useful data and a clearer understanding of learners and their learning processes. It employs data mining to analyse data and solve educational problems. EDM, like other data mining approaches, extracts novel, interpretable, and relevant information from educational data [3]. However, it aims to build approaches that leverage unique data types in educational systems. These strategies are then utilized to learn more about educational phenomena, students, and learning environments. Developing data-driven computational approaches will help improve teaching and learning. Practically, EDM allows users to mine student data for knowledge. For example, this knowledge can be used to evaluate an educational system, improve teaching and learning processes, and establish the framework for a more successful learning process [4]. Similar techniques have been used successfully to boost sales revenues in various datasets, including e-commerce systems. The success of data mining in business data supports its implementation in other knowledge domains. Data mining has been used extensively in educational studies to improve student learning, guide student learning, and better explain educational phenomena. While EDM has less development than other sectors, this is changing because of an increased interest in using data mining in education [5]. Machine Learning (ML) is the important part of artificial intelligence. It is the machines or system’s ability to learn new things without a particular program. Learning in the sense, how to make a decision in a particular situation. It uses an algorithm to learn from data patterns. In our daily life, we are using emails. We get many spam emails in the spam folder. How does the spam filter know which email is a spam one! Spam filters generally use machine-learning technique to find out spam emails and it put those emails in spam folder [6]. The main aim of the ML algorithms is to teach computer that, how to learn by itself. As we know that humans become proficient with experience, so in the same way, computer needs to be experienced. The experience in the computer is created with the help of data that may be in different form like text data, image of any object, audio as well as video of any object etc. In the ML, we have three different types of algorithms like supervised, unsupervised and reinforcement learning algorithms [7]. The need for high-precision prediction models to evaluate and enhance student achievement has expanded dramatically. Data mining's strongest predictor is academic data. Moreover, several studies have shown that employing ensemble learning to predict student performance helps construct a good student performance prediction model.
Importance of the Current Study: Previously, authors have mostly ignored the process structure necessary to achieve outcomes; instead, they have relied heavily on data-centric techniques. The authors primarily work on singlelevel classification issues, and the technique of implementing machine learning models is dataset-specific. Historically, some work has omitted pre-processing procedures, while others have employed single or multiple feature selection methods prior to categorization. The majority of the work was motivated by the current objectives.
Objectives of this Research: The primary objective in predictive modelling is to find the most effective prediction algorithms that are accurate enough. For this we have developed a heterogenous model which consists of stacking and voting techniques along with different machine learning algorithms.
The remainder of the study is divided into seven sections. Section-2 highlights related work on using predictive analytics and ensembles of classifiers to forecast student performance. Section-3 outlines the numerous classifications employed in the study, as well as the algorithms and ensemble techniques used. Section-4 discusses proposed OEL model design with its different steps explanation. Section-5 discusses the implementation part of the proposed model with all seven classification algorithms taken into consideration. Section-6 is all about the comparative analysis of all the classifiers build with OEL model and Section-7 concludes the research work done in this paper.
2. Literature Review
Predicting student retention and performance goes way back to the early years of the American education system, when only the elite attended a two-year college programme. Johnson conducted one of the earliest studies on retention in 1926, while McNeely explored the influence of student "mortality" on academic failure and its effect on student attrition in 1938. Several decades later, research revealed and offered various models for explaining predictive modelling of student performance, retention, and success. Numerous researches examined the factors for students' perseverance and non-persistence in higher education and generated various theoretical models based on the United States' higher education system. Sokkhey, P., & Okazaki, T. gave emphasis on shifting from forecasting student achievement to predicting student cognitive capacity, LMS activity logs, and demographic data [8]. While several of the investigations employed machine learning languages such as Artificial Neural Network, Support Vector Machine, and Naive Bayes algorithms instead of the more widely used logistic regression, the results were mixed. Saa, A. A., Al-Emran, M., & Shaalan, K. used LMS log data to estimate students' final grades. They employ variables like online sessions, login frequency, original post read/made, follow-up post created, content page seen, and posts read. To measure quality rather than quantity in online learning, some research looked at timing, volume, and consistency of access or log in [9]. These variables were shown to be more precise when included in the study. The most typically utilized LMS predictor factors include posts viewed, time spent online, access to course materials, and login frequency. Malaysia University students' performance was predicted using a questionnaire developed by Yadav, A., Alexander, V., & Mehta, S. Among the information gathered are their interest in the subject matter, study engagement time, study behaviour, beliefs, and family support [10]. The findings indicate that there is a considerable relationship between students' mental health and their academic success. Students' intrinsic and personality characteristics were collected by survey questionnaire approaches by Ruiz, S., Urretavizcaya, M., Rodríguez, C., & Fernández-Castro, I. which were not easily available in any database for the purpose of forecasting student performance. These researchers looked at how students' personality traits, learning styles and personalities, as well as their learning tactics and motivation facto influenced their academic success and overall well-being [11]. Using a brief questionnaire that included five different personality variables, as well as the student's learning style, psychological well-being, and educational achievement, Raga, R. C., & Raga, J. D. examined the impact of academic performance on psychological well-being [12]. To examine the effectiveness of three predictive models, Sokkhey, P., & Okazaki, T. used a survey-based retention methodology, open data sources, and institutional internal databases [13]. When using logistic regression, the surveybased model outperformed the institutional internal databases in terms of accuracy, sensitivity, and specificity. Bowers, A. J., & Zhou, X. in his study found that combining the questionnaire with institutional databases improved performance accuracy compared to using only institutional databases [14]. Finally, when looking at student performance as a whole, various researchers have demonstrated that the reasons for poor performance and student attrition from HEIs are not those that are often recorded officially; rather, they are external factors that are beyond the control of the institutions of higher learning [15]. The majority of these criteria are dependent on the student and, as a result, require the student to participate in a survey in order to provide the data. Furthermore, the elements that influence and decide student performance are not isolated entities in nature, but rather are interconnected, correlated, and interdependent in their effects and outcomes [16]. A new framework that takes a thorough and holistic approach is required as a result of the research that is currently being conducted. This research attempts to build a decision-making paradigm for senior high schools for high school students. The model was developed using the fuzzy logic idea. The Fuzzy K-nearest neighbour technique is used to transform crisp sets into fuzzy ones. The MATLAB environment was used to implement the model. Indicators of the model's accuracy and specificity were used as performance indicators in the evaluation of its performance. Based on the results, accuracy was determined to be 90.22%. This indicates that the model is about 90% accurate. It also has a specificity value of 96.97%. According to these findings, the model supports students in making decisions while avoiding the difficulties of hesitation and floundering that are associated with deciding on a career path among upper elementary and secondary students. The approach can also be used by career specialists to improve their work [17]. According to our plan, our university's current education system would be tested and then implemented across the country as a testing ground for the proposed system. Our country's most well-informed educators and policymakers are working to improve our educational system, and they are employing a variety of approaches to do it. According to the authors of this report, the Random Forest method for predictive modelling outperformed the other algorithms used in this study. The Random Forest algorithm's correct classification rate is 61.40%, with a recall value of 1 being very high. Our goal in writing this article is to determine the optimum outcome based solely on a few specific attributes, such as academics and familial ties. As a result of this work, researchers can focus more on the student's academic and family characteristics than their personal characteristics. Because students may not put in the right information during the gathering of personal attributes, and this may affect our results as well [18]. The findings of this study aid model designers in seriously considering and working on these attributes. Next, we plan to test our findings on a wide range of datasets and classification algorithms. Using this method, we can find the best algorithm for each dataset and make sure it works almost perfectly.
Previously, authors have mostly ignored the process structure necessary to achieve outcomes; instead, they have relied heavily on data-centric techniques. The authors primarily work on single-level classification issues, and the technique for implementing machine learning models is dataset-specific. Historically, some work has omitted preprocessing procedures, while others have employed single or multiple feature selection methods prior to categorization. The majority of the work was motivated by the current objectives.
3. Learning-based Self-adaptation with Reusability
This section is the building block for the implementation of the proposed research work. As in this section we select our dataset, defining pre-processing steps and finally discuss about the final classification algorithms used for implementation.
Dataset Description: This data set pertains to student achievement in secondary education at two Portuguese educational institutions. School reports and questionnaires were used to gather the data, which included student grades as well as demographic, social, and school-related characteristics, among other things. This dataset contains information about the performance of subjects who are fluent in the Portuguese language (por). The datasets used in [Cortez and Silva, 2008] were classified and regressed using binary/five-level classification and regression tasks. The student performance dataset used in this study has collected from UCI Machine Learning Repository [19]. The data was collected for academic session 2005-2006 from schools of Alentejo region Portugal. It includes 649 instances with 33 attributes including student grades, demographic, social and school related feature.
Discretization: This method is used to convert the desired data from numerical to nominal value by transforming it through the discretization process. Some classifiers are inapplicable to continuous data, while others are. As a result, the nominalization of the target attribute G3 Grade has occurred. The 20-point grading scale is used in the Portuguese educational system, as is the case in other nations. In which 0 represents the lowest possible score and 20 represents the highest possible score. By adopting the following rule, the student's grade points from three sessions have been converted into nominal intervals of five levels for the desired nominal intervals (Table 1.). For better results, we identify the final grade of the student by finding the average of all grades and creating a new attribute entitled "Final Grade" in the given dataset, which contains the letters G1, G2, and G3, as well as the grades achieved by different individuals. Because of this, I 've divided the class levels into five groups, each designated by the letters A (Final Grade >=16), B
(Final Grade >=14 and =15), C (Final Grade >=12 and =13), D (Final Grade>=10 and Final Grade=11), and F (Final Grade<=9).
Table 1. Proposed Grading System for Academic Dataset
|
Level-1 |
Level-2 |
Level-3 |
Level-4 |
Level-5 |
|
Final Grade >=16 |
Final Grade >=14 and =15 |
Final Grade >=14 and =15 |
Final Grade>=10 and Final =11 |
Final Grade<=9 |
|
A |
B |
C |
D |
F |
Data Pre-processing: Pre-processing plays an essential in data mining. Its objective is to convert raw data into an appropriate format which may be used by mining algorithms. Following tasks are performed in this phase.
Data Cleaning: During this phase, missing and noisy data are dealt with in order to achieve uniformity in the data. There are no missing values, outliers, or other anomalies in the dataset used for this investigation.
Classification Algorithms: Classification is a data mining technique that is used to categories or classify the objects contained in a dataset. The purpose of classification is to accurately predict the target class for each occurrence of data. For example, a classification model could be used to categories loan applicants as low, medium, or high credit risks. The following are some of the classification algorithms that have been chosen for implementation:
Naïve Bayes: The Naïve Bayes technique is a type of supervised learning based on the Bayes theorem that is used to solve classification problems [20]. This classifier is a straightforward and effective classification algorithm that enables the rapid generation of accurate machine learning models.
Random Forest: Also known as random choice forests, random forests are an ensemble learning technique for classification, regression, and other problems that involves training a large number of decision trees [2 1]. The random forest output is the class selected by the majority of trees in classification problems.
Decision Tree: An algorithm for inducing decision trees, also known as the decision tree algorithm or induction of decision trees, is a predictive modelling tool that is used in statistics, data mining, and machine learning.
Multi-layer Perceptron: This is a sort of feedforward neural network (ANN). It is trained using a technique known as backpropagation, which is a form of supervised learning. MLP differs from a linear perceptron in that it has multiple layers and non-linear activation. It is capable of separating non-linearly separable data [22].
Decision Table: A decision table is a table-formatted scheduled rule logic entry that contains conditions denoted by row and column names and actions denoted by the intersection points of the table's conditional cases. The most effective use of decision tables is when dealing with business rules that contain multiple circumstances.
JRip: This class implements a propositional rule learner. This approach was developed by William W. Cohen as an IREP-appropriate algorithm. It uses Repeated Incremental Pruning to minimize errors (RIPPER).
Logistic Regression: When several explanatory variables are present, logistic regression is used to calculate the odds ratio. Although the procedure is relatively similar to multiple linear regression, the response variable is binomial. The outcome is the effect of each variable on the odds ratio of the observed event [23].
Algorithms for Feature Selection (FS): Feature selection algorithms attempt to reduce the number of input variables to those that are regarded to be most useful in predicting the target variable. The goal of feature selection is to exclude predictors that are uninformative or redundant from the model [24]. The Correlation Attribute Evaluator determines an attribute's value by evaluating the correlation (Pearson's correlation coefficient) between it and the class. Nominal attributes are analysed value by value, with each value serving as a proxy for the next. The overall correlation of a nominal attribute is determined using a weighted average.
4. Proposed Optimized Ensemble Learning (OEL) Model
In order to address the common concerns identified in the preceding literature review, such as class imbalance, data high-dimensionality, and classification errors, this study has developed a model that is divided into the following phases. As we saw throughout the literature review step, the majority of authors relied solely on data to arrive at the best outcome. However, in our OEL Model, we outlined a process that must be followed whenever heterogeneous ensemble predictive modelling is used. In the OEL Model, we divide our predictive process into distinct steps, and each step will tackle its own set of problems. The following is a block diagram of the OEL Model is saw in Fig.1. below:
Step-2:
Data pre-processing: Il is a data mining technique which is used to transform rhe raw data in a useful and efficient format.
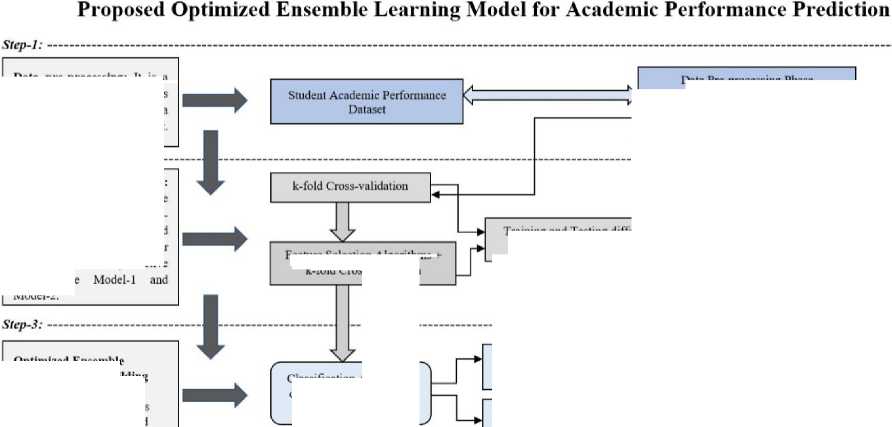
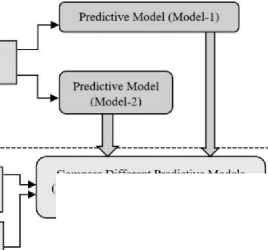
Optimized Ensemble Learning Model Building Phase: Different Classification algorithms is used to build an Optimized Ensemble Learning Model
Predictive Model by Stacking
Technique (Model-3)
Predictive Model by Voting Technique (Model-4)
Training and Testing different Classification Models
Compare Different Predictive Models (Model-1. Model-2. Model-3. Model-4) to get best Predictive Model.
Classification Algorithms considered for Ensemble Modelling
Data Pre-processing Phase (Data Cleaning. Handling Missing _ Value. Class Imbalance Problem)
Fig.1. Design of Optimized Ensemble Learning (OEL) Model
Training and Testing Phase: Train the model using the training set using к-fold crossvalidation on one side and Feature selection on the other side. We got two predictive model here Model-2.
Feature Selection Algorithms -к-fold Cross-validation
Optimized Ensemble Learning Model
Step-1: Prior to moving to the next step, manage missing values (by mean and median), outliers’ detection, and class imbalances in the dataset.
Step-2: At this step, various classification methods are implemented and verified for accuracy (both with the complete dataset and with feature selection). We have two classifier models, Model-1 and Model-2.
Step-3: This section evaluates only those algorithms that have been selected for implementation at step-2, and it is intended to be brief. This step leads to the generation of predictive classifier models (Model-3 and Model-4). Find out which of the four prediction models (Models 1 through 4) gives the best results on the different performance metrics.
The majority of data mining and machine learning researchers are focused on constructing an algorithm that can find meaningful information from enormous amounts of data after processing. The main challenge in predictive modelling is to find the most effective prediction algorithms that are accurate enough. As a result, we created a heterogeneous strategy that used correlation attribute evaluation, ensemble learning like stacking and voting techniques, and seven different machine learning algorithms to improve prediction accuracy. The prediction performance of the classification algorithms was examined using k-fold cross-validation.
Now, it’s time to select which ensemble learning algorithms need to be implemented to test the classifications algorithms. All the necessary requirement are now set to implement the above-mentioned heterogeneous classification algorithms with the help of feature selection and feature selection algorithms. At the end we need to compare all the implemented algorithms with each other to find the best on, which gave use the maximum accuracy in prediction the result.
5. Implementation of the Proposed OEL Model
In this section, our aim is to explore whether selecting the best attributes from the given dataset will improve the performance of these ensemble methods or not. As we know that, reducing attributes of a dataset is an essential step before any analysis of the data can be performed in many real-world classification problems. The importance for reducing the attributes in the dataset is to preserve most of the relevant information of the original data according to some optimality criteria.
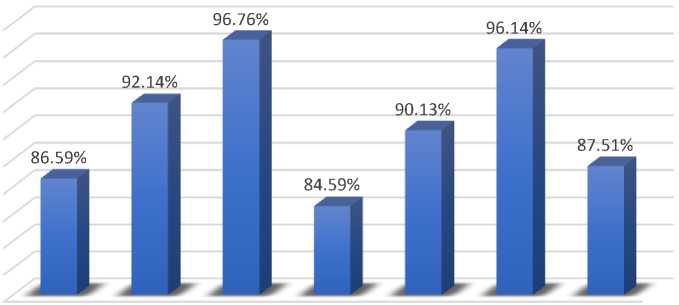
We implement the following classification algorithms: Naïve Bayes, Random Forest, J48, Multilayer Perceptron, DecisionTable, JRip, and Logistic Regression. The Table 2. below summarizes the implementation results of various categorization algorithms using ten cross-validation (k-fold cross validation) approaches. As our dataset is a balanced dataset with nearly equal distribution of data across five distinct classifications. According to the Table 2., Decision Tree classification method had the greatest accuracy of 96.76 % when compared to other classification algorithms such as Naive Bayes, Random Forest, Decision Table, Multilayer Perceptron, JRip, and Logistic Regression. As shown, the Multilayer Perceptron method achieves the lowest accuracy of 84.59 %. Random Forest and JRip algorithms also obtained an acceptable level of accuracy, at 92.14 % and 96.14 %, respectively. To implement these algorithms, all of the dataset's attributes (up to 33) are considered. Other performance metrics such as Mean Absolute Error (MAE), Precision, Recall are also considered in this table. As our dataset contains no outliers, we will use accuracy as our primary parameter for evaluating our classifier's effectiveness.
Table 2. Accuracy achieved by classification algorithm
|
Classification Algorithms |
Accuracy |
MAE |
Precision |
Recall |
|
Naïve Bayes |
86.59% |
0.063 |
0.870 |
0.866 |
|
Random Forest |
92.14% |
0.118 |
0.924 |
0.921 |
|
Decision Tree |
96.76% |
0.017 |
0.968 |
0.968 |
|
MultilayerPerceptron |
84.59% |
0.078 |
0.846 |
0.846 |
|
Decision Table |
90.13% |
0.146 |
0.909 |
0.901 |
|
JRip |
96.14% |
0.024 |
0.962 |
0.961 |
|
Logistic Regression |
87.51% |
0.049 |
0.877 |
0.875 |
Classification algorithm’s accuracy is defined as the total number of correct predictions divided by the total number of predictions made by an algorithm for a given dataset. Below Fig.2., shows the graphical representation of the above-mentioned implementation of the classification algorithms with k-fold cross validation method. The figure clearly shows that Decision Tree classification algorithm perform exceptionally well as compared to other algorithms taken into consideration.
Accuracy by Classification Algorithms
Naïve Bayes Random Decision Multilayer Decision JRip
Logistic
Forest Tree Perceptron Table
Regression
98.00%
96.00%
94.00%
92.00%
90.00%
88.00%
86.00%
84.00%
82.00%
80.00%
78.00%
Fig.2. Graphical representation of accuracy of classification algorithms
Feature Selection Method: Classification, grouping, and regression algorithms all utilise a training dataset to establish weight factors that may be applied to previously unseen data for predictive purposes. Prior to executing a data mining technique, it is required to narrow down the training dataset to the most relevant attributes. Dimensionality reduction is the process of modifying a dataset in order to extract only the characteristics required for training. Due to its simplicity and computational efficiency, dimension reduction is critical since it minimises overfitting. Thus, dimensionality reduction is critical throughout the data pre-processing phase.
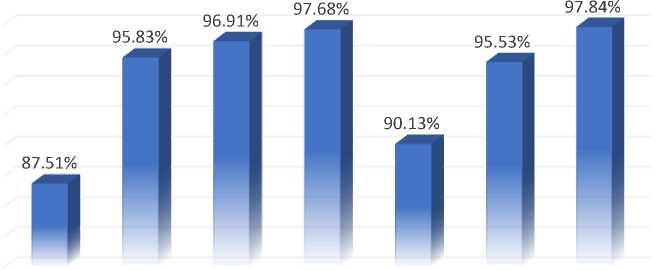
A correlation-based feature selection method selects attributes based on the usefulness of individual features for predicting the class label, as well as the degree of connection between them. We avoid strongly linked and irrelevant features. The CAE determines an attribute's value in a data set by calculating the correlation between the attribute and the class attribute. Nominal qualities are assessed individually, with each value acting as a signal. A weighted average is used to generate an overall correlation for a nominal characteristic. We picked the top ten attributes with a threshold value larger than 1 using the aforementioned attribute evaluator CAE in conjunction with the Ranker search strategy. The following Table 3. summarises the results of the implementation of several classification algorithms using CAE and the test option as k-fold cross validation approaches. As shown in the Table 3., the combination Logistic Regression-CAE achieved the greatest accuracy of 97.84% when compared to other classification algorithms such as Naive Bayes, Random Forest, Decision Tree, Multilayer Perceptron, Decision Table and JRip. As can be seen, the Multilayer Perceptron technique improves accuracy to 97.68%, which is significantly higher than the accuracy obtained without utilising the feature selection approach. The remainder of the algorithms are also accurate to an acceptable level. Only the top fifteen attributes of the dataset are considered when implementing these methods.
Table 3. Accuracy achieved by classification algorithm with CAE
|
Classification Algorithms |
Accuracy |
MAE |
Precision |
Recall |
|
Naïve Bayes |
87.51% |
0.058 |
0.878 |
0.875 |
|
Random Forest |
95.83% |
0.061 |
0.959 |
0.958 |
|
Decision Tree |
96.91% |
0.0169 |
0.969 |
0.969 |
|
MultilayerPerceptron |
97.68% |
0.0172 |
0.977 |
0.977 |
|
Decision Table |
90.13% |
0.146 |
0.909 |
0.901 |
|
JRip |
95.53% |
0.0252 |
0.956 |
0.955 |
|
Logistic Regression |
97.84% |
0.0087 |
0.979 |
0.978 |
Below Fig.3. is a graphical illustration of the implementation of the classification algorithms discussed previously using CAE and k-fold cross validation as testing methods? The graph clearly demonstrates that the logistic regression algorithm outperforms all other algorithms considered. However, as illustrated in Fig.1., practically all classification systems obtain a prediction accuracy of greater than 90%.
Accuracy by Classification Algorithm with CAE
98.00%
96.00%
94.00%
92.00%
90.00%
88.00%
86.00%
84.00%
82.00%
Naïve Bayes Random Decision Multilayer Decision
Forest Tree Perceptron Table
JRip Logistic
Regression
Fig. 3. Graphical representation of accuracy by classification algorithms with CAE
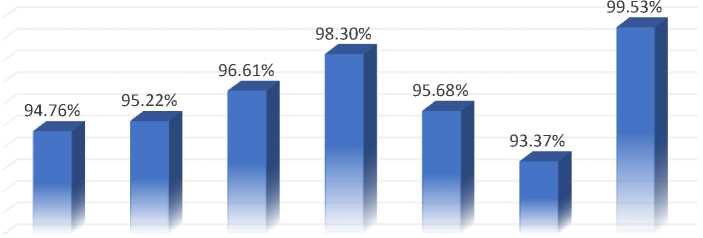
Stacking Ensemble Learning Model: In this step, a feature selection approach such as CAE is employed to lower the dimensionality of the dataset, hence increasing the accuracy of the model formed by stacking ensemble with k-fold cross validation. The following table summarises the results of implementing several classification algorithms (in combination) utilising CAE and Stacking Ensemble and k-fold cross validation methods. In this implementation, we used a mix of distinct classification algorithms like Logistic Regression and Simple Logistic in combination, which are both function-based methods, to achieve a maximum accuracy of 99.53%. Other classification algorithms such as Multilayer Perceptron and Simple Logistic, Decision Tree and REPTree, which are function-based and tree-based algorithms respectively, achieved accuracy of up to 98.30% and 96.61%, which is close to the highest accuracy achieved by the newly generated model Logistic Regression and Simple Logistic for prediction. Furthermore, when multiple classification methods are used, the prediction accuracy in all cases exceeds 93.37%. The following Table 4. details the performance metric for each categorization algorithm.
Table 4. Accuracy by Stacking Ensemble Learning Model
|
Classification Algorithms |
Accuracy |
MAE |
Precision |
Recall |
|
Naïve Bayes - BayesNet |
94.76% |
0.0309 |
0.948 |
0.948 |
|
Random Forest - REPTree |
95.22% |
0.0232 |
0.952 |
0.952 |
|
Decision Tree - REPTree |
96.61% |
0.0262 |
0.966 |
0.966 |
|
MultilayerPerceptron - Simple Logistic |
98.30% |
0.0112 |
0.983 |
0.983 |
|
Decision Table - PART |
95.68% |
0.0245 |
0.958 |
0.957 |
|
JRip - PART |
93.37% |
0.0339 |
0.935 |
0.934 |
|
Logistic Regression - Simple Logistic |
99.53% |
0.0021 |
0.995 |
0.995 |
In Fig.4., which shows the graphical representation of the above-mentioned implementation of the classification algorithms with Stacking and CAE with k-fold cross validation methods. The graph clearly shows that Logistic Regression and Simple Logistic classification algorithms perform exceptionally well as compared to other algorithms taken into consideration like Naïve Bayes and BayesNet, Random Forest and REPTree, Decision Tree and REPTree, Multilayer Perceptron and Simple Logistic, Decision Table and PART, JRip and PART achieved maximum prediction accuracy. But in this implementation of classification algorithms with Stacking and CAE with k-fold cross validation, all the combination of sub-models performed exceptionally well and achieved accuracy more than 93.00%.
Accuracy By Stacking Ensemble Learning Model
Naïve Bayes -BayesNet
Random Forest -REPTree
Decision Tree Multilayer Decision JRip - PART
- REPTree Perceptron - Table - PART
Simple
Logistic
Logistic
Regression -Simple Logistic
100.00%
99.00%
98.00%
97.00%
96.00%
95.00%
94.00%
93.00%
92.00%
91.00%
90.00%
Fig.4. Graphical Representation of accuracy by Stacking Ensemble Learning Model
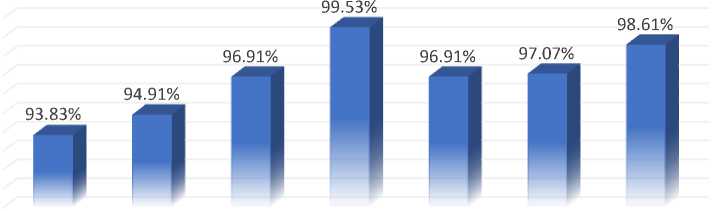
Voting Ensemble Learning Model: In Table 5., the results of the implementation of several classification algorithms (in combination) utilising CAE with voting ensemble and k-fold cross validation methods is given. In our implementation, we used a mix of several classification algorithms like Multilayer Perceptron and Simple Logistic, which is a function-based method, and achieved a maximum accuracy of 99.53%. The combination of other classification algorithms, such as Logistic Regression and Simple Logistic, achieves an accuracy of up to 98.61%, which is close to the highest accuracy achieved by the newly generated model Multilayer Perceptron and Simple Logistic for prediction using the voting ensemble method. Additionally, the integration of additional classification algorithms results in a prediction accuracy of greater than 93.83% in all circumstances.
Table 5. Accuracy by Voting Ensemble Learning Model
|
Classification Algorithms |
Accuracy |
MAE |
Precision |
Recall |
|
Naïve Bayes - BayesNet |
93.83% |
0.0247 |
0.939 |
0.938 |
|
Random Forest - REPTree |
94.91% |
0.0203 |
0.950 |
0.949 |
|
Decision Tree - REPTree |
96.91% |
0.0123 |
0.969 |
0.969 |
|
MultilayerPerceptron - Simple Logistic |
99.53% |
0.0018 |
0.995 |
0.995 |
|
Decision Table - PART |
96.91% |
0.0123 |
0.970 |
0.969 |
|
JRip - PART |
97.07% |
0.0117 |
0.971 |
0.971 |
|
Logistic Regression - Simple Logistic |
98.61% |
0.0055 |
0.986 |
0.986 |
In Fig.5., which shows the graphical representation of the above-mentioned implementation of the different classification algorithms like voting with CAE and k-fold cross validation method. The graph clearly shows that Multilayer Perceptron and Simple Logistic algorithms perform exceptionally well as compared to other algorithms taken into consideration like Naïve Bayes and BayesNet, Random Forest and REPTree, Decision Tree and REPTree, Logistic Regression and Simple Logistic, Decision Table and PART, JRip and PART, Logistic Regression and Simple Logistic with CAE and k-fold cross validation method achieved the maximum prediction accuracy up to 99.53%. But in this implementation of classification algorithms with voting and CAE with k-fold cross validation, all the combination of predictive models performed exceptionally well and achieved accuracy more than 93.83%.
100.00%
99.00%
98.00%
97.00%
96.00%
95.00%
94.00%
93.00%
92.00%
91.00%
90.00%
Accuracy By Voting Ensemble Learning Model
Naïve Bayes -BayesNet
Random Decision Tree Multilayer Decision JRip - PART Logistic
Forest - - REPTree Perceptron - Table - PART Regression -
REPTree Simple Simple
Logistic Logistic + CAE
Fig.5. Graphical Representation of accuracy by Voting Ensemble Learning Model
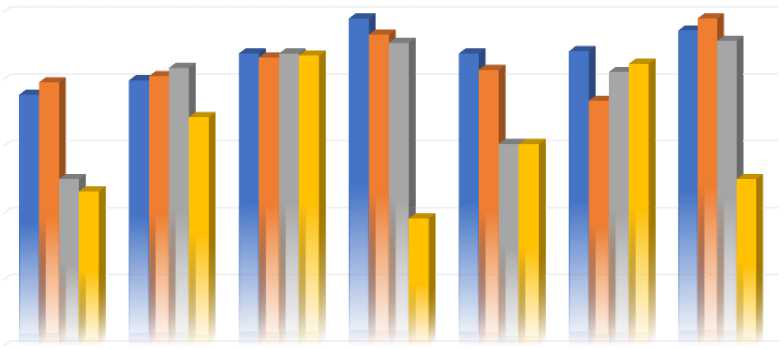
6. Comparative analysis of all classifiers builds from OEL Model
In this section, we will look at a comparative study of all of the algorithms that have been implemented. Using k-fold cross validation as a testing option, we first examine the prediction accuracy of classification algorithms that use Ensemble Learning with and without ensemble learning. We can examine the following algorithms one by one in Table 6., which has a list of the algorithms taken into consideration.
Here a detail analysis of different algorithms taken into consideration one by one from Table 6. given below:
Naïve Bayes - BayesNet Ensemble Learning Model: We used two distinct ensemble learning methods in our implementation, using k-fold cross validation as a testing option. In our observations, we discovered that Stacking Ensemble (Model-3) with CAE and k-fold cross validation performed significantly better on the given dataset and achieved a maximum accuracy of 94.76 % when compared to other methods such as Voting (Model-4) ensemble learning, simple CAE (Model-2) implementation, and basic classification algorithm implementation (Model-1).
Random Forest - REPTree Ensemble Learning Model: According to our observations, voting and stacking ensemble learning with k-fold cross validation performed exceptionally well on the supplied dataset, reaching maximum accuracy of 94.91 % and 95.22 %, respectively. However, the maximum accuracy (95.83 %) is attained by CAE implementation (Model-2), and heterogeneous ensembles make little difference.
Table 6. Accuracy by all Predictive Classifiers by OEL Model
|
Classification Algorithm |
Voting (Model-4) |
Stacking (Model-3) |
CAE (Model-2) |
Basic Classifier (Model-1) |
|
Naïve Bayes - BayesNet |
93.83% |
94.76% |
87.51% |
86.59% |
|
Random Forest - REPTree |
94.91% |
95.22% |
95.83% |
92.14% |
|
Decision Tree - REPTree |
96.91% |
96.61% |
96.91% |
96.76% |
|
Multilayer Perceptron - Simple Logistic |
99.53% |
98.30% |
97.68% |
84.59% |
|
Decision Table - PART |
96.91% |
95.68% |
90.13% |
90.13% |
|
JRip - PART |
97.07% |
93.37% |
95.53% |
96.14% |
|
Logistic Regression - Simple Logistic |
98.61% |
99.53% |
97.84% |
87.51% |
Decision Tree - REPTree Ensemble Learning Model: In our observations, we discovered that the voting ensemble approach with CAE and k-fold cross validation performed exceptionally well on the given dataset, achieving a maximum accuracy of 96.91% when compared to other methods such as stacking ensemble learning.
Multilayer Perceptron - Simple Logistic Ensemble Learning Model: According to our observations, voting ensemble learning and CAE with k-fold cross validation performed significantly better on the given dataset and achieved a maximum accuracy of 99.53%, compared to alternative approaches such as stacking ensemble learning.
Decision Table - PART Ensemble Learning Model: In our observations, we discovered that the voting ensemble approach with CAE and k-fold cross validation performed exceptionally well on the given dataset, achieving a maximum accuracy of 96.91% when compared to other methods such as stacking ensemble learning.
JRip - PART Ensemble Learning Model: In our observations, we discovered that the voting ensemble approach with CAE and k-fold cross validation performed exceptionally well on the given dataset, achieving a maximum accuracy of 97.07% when compared to other methods such as stacking ensemble learning.
Logistic Regression - Simple Logistic Ensemble Learning Model: In our observations, we discovered that Stacking Ensemble with CAE and k-fold cross validation performed significantly better on the given dataset and achieved a maximum accuracy of 99.53% when compared to other methods.
Accuracy By All Predictive Classifiers By OEL Model
100.00%
95.00%
90.00%
85.00%
80.00%
75.00%
Naïve Bayes - Random
BayesNet Forest -
REPTree
Decision Tree - REPTree
Multilayer Decision JRip - PART
Perceptron - Table - PART
Simple
Logistic
Logistic
Regression -Simple Logistic
-
■ Voting (Model-4) ■ Stacking (Model-3)
-
■ CAE (Model-2)
Basic Classifier (Model-1)
Fig.6. Comparison of Prediction Accuracy by all predictive classifiers by OEL Model
7. Conclusion
From the above Fig.6., it clearly shows that voting ensemble learning method with CAE and k-fold cross validation method performed exceptionally well in almost four out of seven classification algorithms. Classification algorithms like Multilayer Perceptron and Simple Logistic, Decision Tree and REPTree, Decision Table and PART, JRip and PART got the maximum accuracy as compared to other ensemble methods like Stacking. But Logistic Regression and Simple Logistic achieved the highest performance accuracy up to with stacking ensemble learning methods.
At the end, different heterogeneous ensemble learning methods of Data Mining are taken into consideration to predict the academic performance of the students. Heterogeneous Ensemble Learning methods like Stacking and Voting are taken into consideration for implementation along with Correlation Attribute Evaluator as a feature selection method. At the end of this paper, we can say that any classification algorithm which is implemented with the help of heterogeneous ensemble learning and Correlation Attribute Evaluator is performing well as compared to algorithms who are implemented without ensemble learning or without feature selection. It means the ensemble learning; feature selection also plays a significant role to improve the classification or prediction accuracy. Follow-up studies will investigate the development and deployment of an automated prediction system referred to as the Students' Academic Performance Prediction Framework, which will collect data through the online submission and provide a prediction result for a student's academic performance. The approach provided in this study will assist educational administrators and policymakers in developing new policies and curriculum related to student retention in higher education. This research can also help identify pupils in danger of dropping out of school early, allowing for timely support and intervention. We obtain the performance accuracy and efficiency of single classifiers versus ensembles of classifiers.
Acknowledgment
I am grateful to my guide Dr. Bhisham Sharma for valuable suggestion provided by them during the study.
References Performance Comparison of the Optimized Ensemble Model with Existing Classifier Models
- Wang, Xizhe, et al. "Fine-grained learning performance prediction via adaptive sparse self-attention networks." Information Sciences 545 (2021): 223-240.
- Romero, Cristobal, and Sebastian Ventura. "Educational data mining and learning analytics: An updated survey." Wiley Interdisciplinary Reviews: Data Mining and Knowledge Discovery 10.3 (2020): e1355.
- Iatrellis, Omiros, et al. "A two-phase machine learning approach for predicting student outcomes." Education and Information Technologies 26.1 (2021): 69-88.
- Romero, Cristóbal, and Sebastián Ventura. "Educational data mining: a review of the state of the art." IEEE Transactions on Systems, Man, and Cybernetics, Part C (Applications and Reviews) 40.6 (2010): 601-618.
- Jauhari, Farid, and Ahmad Afif Supianto. "Building student’s performance decision tree classifier using boosting algorithm." Indones. J. Electr. Eng. Comput. Sci 14.3 (2019): 1298-1304.
- Hamoud, Alaa, Ali Salah Hashim, and Wid Akeel Awadh. "Predicting student performance in higher education institutions using decision tree analysis." International Journal of Interactive Multimedia and Artificial Intelligence 5 (2018): 26-31.
- Slater, Stefan, et al. "Tools for educational data mining: A review." Journal of Educational and Behavioral Statistics 42.1 (2017): 85-106.
- Sokkhey, Phauk, and Takeo Okazaki. "Hybrid machine learning algorithms for predicting academic performance." Int. J. Adv. Comput. Sci. Appl 11.1 (2020): 32-41.
- Saa, Amjad Abu, Mostafa Al-Emran, and Khaled Shaalan. "Mining student information system records to predict students’ academic performance." International conference on advanced machine learning technologies and applications. Springer, Cham, 2019.
- Yadav, Aman, Vivian Alexander, and Swati Mehta. "Case-based Instruction in Undergraduate Engineering: Does student confidence predict learning." Int. J. Eng. Educ 35.1 (2019).
- Ruiz, Samara, et al. "Predicting students’ outcomes from emotional response in the classroom and attendance." Interactive Learning Environments 28.1 (2020): 107-129.
- Raga, Rodolfo C., and Jennifer D. Raga. "Early prediction of student performance in blended learning courses using deep neural networks." 2019 International Symposium on Educational Technology (ISET). IEEE, 2019.
- Sokkhey, Phauk, and Takeo Okazaki. "Comparative study of prediction models on high school student performance in mathematics." 2019 34th International Technical Conference on Circuits/Systems, Computers and Communications (ITC-CSCC). IEEE, 2019.
- Bowers, Alex J., and Xiaoliang Zhou. "Receiver operating characteristic (ROC) area under the curve (AUC): A diagnostic measure for evaluating the accuracy of predictors of education outcomes." Journal of Education for Students Placed at Risk (JESPAR) 24.1 (2019): 20-46.
- Moreno-Marcos, Pedro Manuel, et al. "Analysis of the factors influencing learners’ performance prediction with learning analytics." IEEE Access 8 (2020): 5264-5282.
- Magalhães, Paula, et al. "Online vs traditional homework: A systematic review on the benefits to students’ performance." Computers & Education 152 (2020): 103869.
- Awoyelu I.O., Oguntoyinbo E. O., Awoyelu T. M., " Fuzzy K-Nearest Neighbour Model for Choice of Career Path for Upper Basic School Students ", International Journal of Education and Management Engineering (IJEME), Vol.10, No.4, pp.18-32, 2020. DOI: 10.5815/ijeme.2020.04.03
- Phyo Thu Thu Khine, Htwe Pa Pa Win, Tun Min Naing, "Towards Implementation of Blended Teaching Approaches for Higher Education in Myanmar", International Journal of Education and Management Engineering (IJEME), Vol.11, No.1, pp. 19-27, 2021. DOI: 10.5815/ijeme.2021.01.03
- Mohammed Abdullah Al-Hagery, Maryam Abdullah Alzaid, Tahani Soud Alharbi, Moody Abdulrahman Alhanaya, "Data Mining Methods for Detecting the Most Significant Factors Affecting Students’ Performance", International Journal of Information Technology and Computer Science(IJITCS), Vol.12, No.5, pp.1-13, 2020. DOI: 10.5815/ijitcs.2020.05.01
- Alshanqiti, Abdullah, and Abdallah Namoun. "Predicting student performance and its influential factors using hybrid regression and multi-label classification." IEEE Access 8 (2020): 203827-203844.
- Rastrollo-Guerrero, Juan L., Juan A. Gómez-Pulido, and Arturo Durán-Domínguez. "Analyzing and predicting students’ performance by means of machine learning: A review." Applied sciences 10.3 (2020): 1042.
- Cui, Ying, et al. "Predictive analytic models of student success in higher education: A review of methodology." Information and Learning Sciences (2019).
- Zohair, Lubna Mahmoud Abu. "Prediction of Student’s performance by modelling small dataset size." International Journal of Educational Technology in Higher Education 16.1 (2019): 1-18.
- Hussain, Mushtaq, et al. "Using machine learning to predict student difficulties from learning session data." Artificial Intelligence Review 52.1 (2019): 381-407.
