Performance Evaluation and Comparative Analysis of Different Filters for Noise Reduction

Author: Rupinder Kaur, Raman Maini
Journal: International Journal of Image, Graphics and Signal Processing(IJIGSP) @ijigsp
Article in issue: 7 vol.8, 2016.
Free access
The quality of microscopic images is generally degraded during the image acquisition by quantizing noise, electrical noise, light illumination etc. Noise reduction is considered as a very important preprocessing step as the quality of the images can determine the accuracy of the results. The work done focuses on the noise reduction using different filters on the different types of noises applied on the common digital images and specifically the Leukemia images. 40 images were taken for the comparison purpose; 20 digital images and 20 Leukemia images of different types of Leukemia. The qualitative as well as quantitative analysis of the performance of the filters on the different noises is done. For the quantitative analysis the parameters used for the evaluation of the images are MSE, PSNR and CoC. For the qualitative analysis visual analysis in terms of quality is also done using the resultant images and their histograms. Simulation has been done in Matlab 11b. From the test cases it has been observed that Adaptive Filter produces good results on Salt and Pepper, Speckle and Gaussian noise in case of the digital images. Whereas in case of Leukemia images results of Median Filter are best for the Gaussian, Poisson and Speckle noise corrupted images.
Peak Signal to Noise Ratio, Mean Square Error, CoC, Filters, Noise, Chronic Myelogenous Leukemia
Short address: https://sciup.org/15013992
IDR: 15013992
Text of the scientific article Performance Evaluation and Comparative Analysis of Different Filters for Noise Reduction
Published Online July 2016 in MECS DOI: 10.5815/ijigsp.2016.07.02
Degradation in the quality of the microscopic images can be credited to image resolution, image intensity levels, dynamic ranges and the image pixel size. Optical system relates the first two factors and the last two are in concern to the detector system. Addition of quantization noises exist in the microscopic blood cell images due to the influence of quantization of images. Due to this, nonuniform distribution is shown by the whole image background. Two common noise types present in microscopic images are background and pulse noise. As microscopic images are the fluid images so some other objects like sediments, bubbles etc. also exists [1]. A variety of distortions may degrade the digital images at the different times e.g. on acquisition, enhancement, restoration and transmission. For the analysis of the images it is very important to remove such degradations. For the purpose of analyzing the effects of five filters taken into the consideration forty images were taken. Twenty digital and twenty Leukemia images were taken for analysis. The images were firstly degraded with the four types of noises and then the filters were applied on the taken images for the noise removal. While restoring the images minimum changes are desired and for the purpose of the quantitative analysis the metrics such as CoC, MSE and PSNR etc. are used for the evaluation of the amount of distortion of the resultant image with respect to the original image. The structuring of paper is as follows. Section 2 and 3 discusses the different types of noises and filters respectively. Section 4 describes the evaluation parameters used for results. Section 5 describes the simulation performed. Section 6 includes the discussion on results and finally Section 7 concludes the paper.
-
II. Different Types of Noise
The undesirable effect created in the image is called noise. Several factors are liable for the introduction of noise in the image while image acquisition or transmission. The image can be affected to the different extents depending upon the introduction of the type of disturbance. For the purpose of the removal of the noise from the image it is first necessary to be familiar with the different types of noises. Noise is generally classified as Impulse or Salt and pepper noise, Gaussian noise (Amplifier), Poisson noise, Speckle noise (Multiplicative), Film grain and Periodic noise. Only the types which were actually removed in this paper are discussed.
-
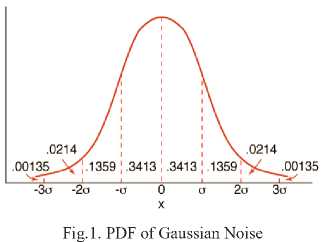
A. Gaussian Noise
This noise is also famous as the Amplifier noise. It follows the Gaussian distribution and is additive in nature [2]. The PDF of this noise is identical to that of normal distribution also called the Gaussian distribution. The PDF of Gaussian Noise is shown in Figure 1. The pixels of the noisy image are obtained by adding the value of the true pixel and the value of the Gaussian distributed noise [3]. The PDF of a Gaussian variable x is given by
Equation (1). [4]
p ( x ) = e "( x - x )2/2 CT 2 (1)
V 2na
2 k e- 2
P ( Z = k ) = — (3)
k !
Where
In the above equation intensity is represented by x, x is mean of x, σ represents the standard deviation. σ2 is the variance of x
-
B. Salt and Pepper Noise
This noise is also known as random, impulse, spike or independent noise. It is characterized by the appearance of black and white dots in the image. This noise is caused by the sudden and sharp changes in the image signal. The main cause of the occurrence of this noise is the appearance of dust particles or the overheating of the image acquisition source [4]. The PDF of Salt and Pepper noise is given by Equation (2).
pa
P ( x ) = 1 P b
for x = a for x = b otherwise
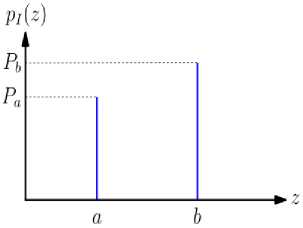
Fig.2. PDF of Salt and Pepper Noise
Intensity b appears as a dot of light shade in an image if b>a. Whereas level a appears like a dark dot. The impulse noise is denoted as unipolar if either of P a or p b is zero. Salt and Pepper noise follows the uniform distribution as denoted in the Figure 2.
-
C. Poisson Noise
Also recognized as Shot Noise and is caused when sufficient statistical information is not provided as the sensor senses less number of photons [2]. For k=0,1,2,…., a random variable Z have a Poisson distribution with λ > 0, the probability mass function of Z is given by Equation (3)
-
• e is Euler's number
-
• k ! is the factorial of k .
The PDF of Poisson Noise is shown in Figure 3.
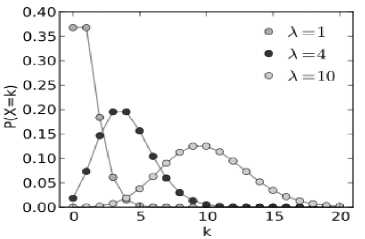
Fig.3. PDF of Poisson Noise
-
D. Speckle Noise
This noise can be grooved by multiplying random values with the pixel values of image [5]. Representation of the speckle is expressed by Equation (4).
g ( m, n ) = f ( m , n )* u ( m , n ) + ^ ( m , n ) (4)
Where, g(m,n) is the experimental image, u(m,n) is the multiplicative component and ^ (m,n) is the additive component of the speckle noise. m and n denotes the axial and agile indices of the image samples.
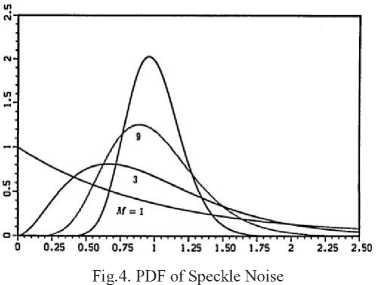
Speckle noise densities for the n ∈ {1, 3, 8} looks cases (solid line, dots, dashes, respectively) is shown in Figure 4.
-
III. Different Types of Filters
During the process of capturing or transmission an image may be degraded due to the different sources of noise. Such image is not suitable for the purpose of analysis as it may lead to the wrong results. There are many filters available for the noise reduction. This work uses five filters for reducing the noise from the taken forty images. These filters are discussed in this section.
-
A. Adaptive Filter
Adaptive filters are superior to other filters as they consider the characteristics of the image before applying the filter [4]. Filter complexity is increased due to this [6]. Filter is represented by Equation (5).
∧ ση 2
f ( x , y ) = g ( x , y ) - η 2 [ g ( x , y ) - mL ]
σ L
Where σ 2 is the difference of noise σ 2 is the local inconsistency of the pixels m is local mean of pixels
-
B. Median Filter
Median filter replaces the pixel’s value by the median of the neighbor pixel’s intensity level. While computing the median the values of the pixel at (x, y) are included [4]. Equation (6) shows the filter function.
∧
f(x, y) =median{g(s,t)} (s,t)∈Sxy
-
C. Contra harmonic Mean Filter
Equation (7) shows the filter function for the Contra harmonic Mean filter.
∧ f (x, y) =
∑ ( s , t ) ∈ S xy g ( s , t ) Q + 1 ∑ ( s , t ) ∈ S xy g ( s , t ) Q
Q referred in the equation is the order of the filter. For unipolar impulse noise the filter works very well. The pepper noise also known as negative impulse noise reduces the positive values for Q and the salt noise is reduced by the negative values of Q. It is also known as the positive impulse noise. If the value of Q is considered to be 0 then the filter is reduced to the arithmetic mean filter and the filter is considered as the Harmonic mean filter for Q=-1.
-
D. Bilateral filter
A bilateral filter is a smoothing filter for noise reduction in the images. It is an edge preserving nonlinear filter. In this filter the nearby pixel's weighted average intensity value replaces the each pixel's intensity value. The bilateral filter is defined by the Equation (8)
Ifiltered ( x ) = 1 ∑ I ( x i ) f r (|| I ( x i ) - I ( x )||) g s (|| x i - x ||) (8)
Wp xi∈Ω where the normalization term defined by the Equation (9) ensures that the image energy
W p = ∑ f r (|| I ( x i ) - I ( x )||) g s (|| x i - x ||) (9)
xi∈Ω is preserved by the filter and
Ifiltered is the filtered image
-
• I is the input image for filtering
-
• Ω is the window centered at X
-
• x are the current pixel's coordinates for filtering
-
• g is used for smoothing differences in coordinates
and is known as the spatial kernel.
-
• f is used for smoothing differences in intensities and is known as the range kernel.
-
E. Alpha Trimmed Mean Filter
The Alpha Trimmed Mean Filter is represented by the Equation (10)
yn ( i ; α ) =
n - 2[ α n ]
n - [ α n ]
∑ x ( j ) ( i )
j = [ α n ] + 1
where y п (i; α) is the output of the filter.
In a window Wi, let {x(i),x(i-1),...,x(i-n+1)} be a set of 'n' sample signal values where n=2N+1. When the value of α approximates to 0.5 then the Alpha Trimmed Mean Filter behaves like a Median Filter and when α approaches 0 then it performs like a moving average filter.
-
IV. Parameters for Evaluation
Visual inspection combined with objective measurements based on pixel-wise differences computed from original and processed images is the commonly used method for the evaluation of the quality of denoised images. Typically MSE or PSNR were used for measuring the noise cancellation. Evaluation of the above mentioned measures is typically done in the RGB coordinate system. Normalized color difference was another metric proposed to deal with the perception of colors as done by humans [7-9]. CIE lab color spaces are used to evaluate the measures for proving the closeness of the uncorrupted original image to the filtered image. Above mentioned measures or their combination is used in the literature to evaluate the results of the most filters [10-23]. Three parameters namely MSE, PSNR and CoC are used for the evaluation of the results in the current study.
-
A. Correlation Coefficient
A statistical measure used to envisage the changes to the value of the one variable when value of another variable is changed is known as correlation coefficient [24]. r is used to measure the direction and strength of a linear relationship involving two variables. r can be calculated using Equation (11).
r = , ^ xy i ____ (11)
xi =Xi – mean (Xi)
y i =Y i – mean (Y i )
Here X and Y are the images under investigation [25]
Value of r ranges from -1<=r<=+1. The + and – sign denotes respectively the positive and negative linear correlation. Both values increases or decreases in the positively correlated variables i.e. the value of a and b both increases. Whereas the value of one variable increases and the other decreases in negatively correlated variables indicating that value of a increases and value of b decreases. Value close to 0 for r means there is a nonlinear relationship involving two variables. Correlation depends on the SNR of the images.
-
B. MSE
Mean squared error measures the average of the squares of the errors indicating the difference between the estimator and actually what is estimated. Randomness is the major cause of the difference. Given a noise free image I ( x x y) and its noisy approximation J, MSE is expressed as in Equation (12).
x - 1 y - 1
MSE = — УУ[ I (a, b) - J (a, b )]2 (12)
ХУ a = 0 b = 0
-
C. PSNR
Peak signal-to-noise ratio is a broad term for the ratio between maximum achievable power of a signal and corrupting noise’s power that affects its representation. Logarithmic decibel scale is used for expressing the PSNR due to the wide dynamic range of the signals. PSNR is usually used to compute the quality of restoration of the corrupted noisy images. Higher value for PSNR indicates the better quality of the reconstituted image in most of the cases. PSNR is defined via MSE (Mean Squared error). PSNR is defined in dB as given by Equation (13).
PSNR = 10log
Max I MSE v
Here MaxI is the maximum value of pixels in the image. Value of MaxI is 255 when 8 bits per sample are used to represent the pixels. Image I and J are identical in the absence of the noise and MSE is zero in this case [26].
-
V. SIMULATION
The work focuses on the noise reduction from the digital images. Forty images were used for evaluating the results. Twenty common digital images and twenty Leukemia images were used for the simulation. Special attention has been given to the Microscopic Leukemia images. The Leukemia images include the four different types of Leukemia i.e. AML, CML, ALL and CLL.
Main objectives of the analysis are:
-
1) To evaluate the performance of various filters on different types of noises and images.
-
2) To identify the filters suitable for reduction of different types of noises from the Leukemia images.
-
3) To identify the suitable metrics for quantifying the noise reduction from the blood cell and general images.
-
4) To understand the role of the statistical parameters of an image for noise reduction.
Four types of noises i.e. Salt and Pepper, Gaussian, Poisson and speckle noise are used for corrupting the images. All these four types of noises are removed by the five types of filters namely Median, Adaptive, Alpha Trimmed Mean Filter, Contra harmonic Mean Filter and the Bilateral filter.
The steps followed in this process are:
Step 1: Read the Leukemia input image.
Step 2: Convert the input image to the gray scale image.
Step 3: Apply one type of noise to the image.
Step 4: Remove the noise from the images using all the filters one by one.
Step 5: Store the results of all the filters applied on the noisy images.
Step 6: If all types of noises have been applied on the image then goto step 7 otherwise goto step3.
Step 7: Evaluate the parameters MSE, PSNR, and CoC.
Step 8: Compare the results quantitatively as well as qualitatively.
-
VI. Results and Discussion
For the comparison purpose the obtained results are compared qualitatively as well as quantitatively. Discussion about the results is discussed in this section category wise. Tabular comparison is shown in this section itself whereas the resultant figures are shown in the Appendix A.
-
A. Qualitative Analysis
Forty images were used for the evaluation purpose but for the qualitative analysis results of only two images are shown Lena image and one CML image. The images used for the simulation are corrupted with the different types of noises taken into consideration. Then five types of filters are applied on the corrupted images. The resultant images are shown in this paper for the comparison purpose. The histograms of the resultant images are also shown.
Upon the analysis of the figures concerning CML it is concluded from Fig. 5 and the histograms of the same images shown in Fig. 6 that Adaptive filter was best for removal of the Salt and Pepper noise. And from the analysis of Fig 7, Fig 9 and Fig 11 and the histograms of these images in Fig 8, Fig 10 and Fig 12 respectively that Median filter was best at removing Gaussian, Poisson and Speckle noise. Median filter produces very good results when applied on Gaussian, Poisson and Speckle noise in case of the Leukemia images as it preserves edges while removing noise. The main reason for this is that it finds the median rather than calculating average of the neighboring pixels which generally blurs the edges. When we analyze the performance of filters on various noises in case of other images we can conclude from Fig 13, Fig 17 and Fig 19 and the histograms of the corresponding filters shown in Fig 14, Fig 18 and Fig 20 respectively that Adaptive filter produced best results when applied on Salt and Pepper, Gaussian and Speckle noise whereas upon the analysis of Fig 15 and its histogram shown in Fig 16 that Median filter produced best results when applied on the Poisson noise corrupted image. In Adaptive filters the transfer function is controlled by the variable parameters and an optimization algorithm is used to adjust those parameters accordingly [27]. For some applications these filters are best because some parameters are not known in advance of the desired processing operation or are changing [28]. That’s why Adaptive filters produced best results corresponding to the various noises in case of the other digital images.
-
B. Quantitative Analysis
Table 1 shows the Mean Square Error corresponding to the noise effected images and the various filters applied on them in case of Leukemia images. Results for MSE in terms of graph are shown in Fig. 21. Table 2 shows the MSE corresponding to noise effected images and various filters applied on the common digital images. Results in graphical form for MSE corresponding to the common digital images is shown in Fig. 22. The high value of PSNR means better reduction in the noise. Performance in terms of PSNR is shown in the Table 3 and Table 4 for the Leukemia and the other digital images respectively. Graphs for PSNR for Leukemia and the other common digital images are shown in Fig. 23 and Fig. 24 respectively. Table 5 and 6 shows the values of CoC for the Leukemia and the other images respectively. Corresponding graphs shown by Fig. 25 and Fig. 26 respectively.
Table 1. MSE in Different Filters Corresponding to the Different Noises in Leukemia Images
|
Noise / Filter |
Median |
Adaptive |
ATMF |
CHMF |
Bilateral |
|
Salt and Pepper |
37.66 |
23.35 |
2.1035 e+004 |
2.0967 e+004 |
2.0976 e+004 |
|
Gaussian |
48.59 |
74.36 |
2.1290 e+004. |
2.1202 e+004 |
2.1226 e+004 |
|
Poisson |
10.92 |
20.35 |
2.1186 e+004 |
2.1120 e+004 |
2.1126 e+004 |
|
Speckle |
31.23 |
46.46 |
2.1235 e+004 |
2.1156 e+004 |
2.1172 e+004 |
Table 2. MSE in Different Filters Corresponding to the Different Noises in the Digital Images
|
Noise / Filter |
Median |
Adaptive |
ATMF |
CHMF |
Bilateral |
|
Salt and |
16 |
5 |
1.7420 |
1.7363 |
1.7372 |
|
Pepper |
e+004 |
e+004 |
e+004 |
||
|
Gaussian |
18 |
13 |
1.7499 |
1.7424 |
1.7447 |
|
e+004 |
e+004 |
e+004 |
|||
|
Poisson |
2 |
4 |
1.7487 |
1.7434 |
1.7439 |
|
e+004 |
e+004 |
e+004 |
|||
|
Speckle |
10 |
8 |
1.7437 |
1.7374 |
1.7387 |
|
e+004 |
e+004 |
e+004 |
Table 3. PSNR in Different Filters Corresponding to the Different Noises in Leukemia Images
|
Noise / Filter |
Median |
Adaptive |
ATMF |
CHMF |
Bilateral |
|
Salt and Pepper |
32.371 |
34.447 |
4.901 |
4.915 |
4.913 |
|
Gaussian |
31.264 |
29.417 |
4.849 |
4.867 |
4.862 |
|
Poisson |
37.747 |
35.044 |
4.870 |
4.883 |
4.882 |
|
Speckle |
33.184 |
31.459 |
4.860 |
4.876 |
4.873 |
Table 4. PSNR in Different Filters Corresponding to the Different Noises in Digital Images
|
Noise / Filter |
Median |
Adaptive |
ATMF |
CHMF |
Bilateral |
|
Salt and Pepper |
36.191 |
41.290 |
5.720 |
5.734 |
5.732 |
|
Gaussian |
35.584 |
36.908 |
5.700 |
5.719 |
5.713 |
|
Poisson |
44.549 |
42.465 |
5.703 |
5.716 |
5.7156 |
|
Speckle |
37.9350 |
39.2400 |
5.7162 |
5.7319 |
5.7287 |
Table 5. COC in Different Filters Corresponding to the Different Noises in Leukemia Images
|
Noise / Filter |
Median |
Adaptive |
ATMF |
CHMF |
Bilateral |
|
Salt and Pepper |
0.987 |
0.992 |
0.928 |
0.932 |
0.994 |
|
Gaussian |
0.984 |
0.976 |
0.924 |
0.923 |
0.996 |
|
Poisson |
0.996 |
0.993 |
0.932 |
0.953 |
0.994 |
|
Speckle |
0.990 |
0.984 |
0.925 |
0.941 |
0.995 |
Table 6. COC in Different Filters Corresponding to the Different Noises in Digital Images
|
Noise / Filter |
Median |
Adaptive |
ATMF |
CHMF |
Bilateral |
|
Salt and Pepper |
0.9966 |
0.9989 |
0.9819 |
0.9246 |
0.9987 |
|
Gaussian |
0.9961 |
0.9970 |
0.9827 |
0.9730 |
0.9989 |
|
Poisson |
0.9995 |
0.9992 |
0.9835 |
0.9797 |
0.9986 |
|
Speckle |
0.9977 |
0.9983 |
0.9827 |
0.9781 |
0.9987 |
-
VII. Conclusion
An attempt was made to perform noise removal using linear and non-linear filtering techniques on microscopic blood cell images as well as the other digital images. Results prove that Adaptive filter produces the best results in most cases in terms of quality based on performance metrics taken for the comparison in case of digital images whereas Median filter gave promising results when applied on Poisson noise corrupted images. The transfer function in Adaptive Filter is controlled by the varying parameters and for the purpose of adjusting those parameters an optimization algorithm is used. In case of Leukemia images Median Filter gave the most promising results for the noises under consideration except for the Salt and Pepper noise in which case Adaptive Filter was most effective. The reason for the better results by the Median filter is that it finds the median instead of calculating the neighboring pixels average. The results are clear from the tables for performance metrics (Table 1 to Table 6) and from the graphs shown in the Figures 21-26 which graphically show the performance of various filters against various noises corresponding to the evaluation metrics MSE, PSNR and CoC, respectively.
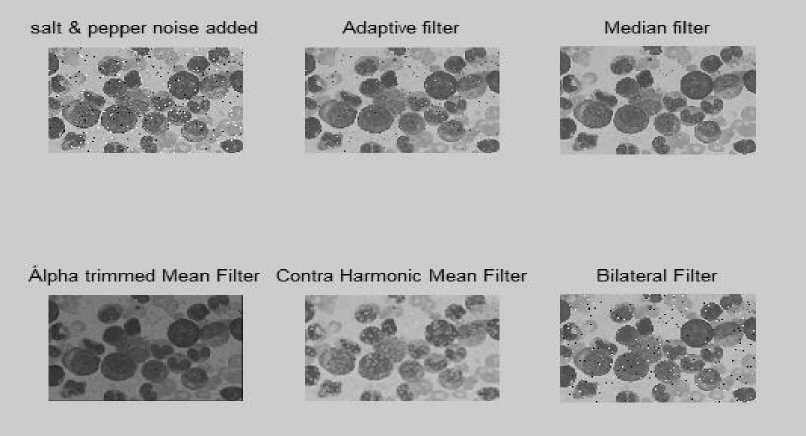
Fig.5. Salt and Pepper Noise Added to the CML Image and the Effect of Different Filters on This Noise Added Image
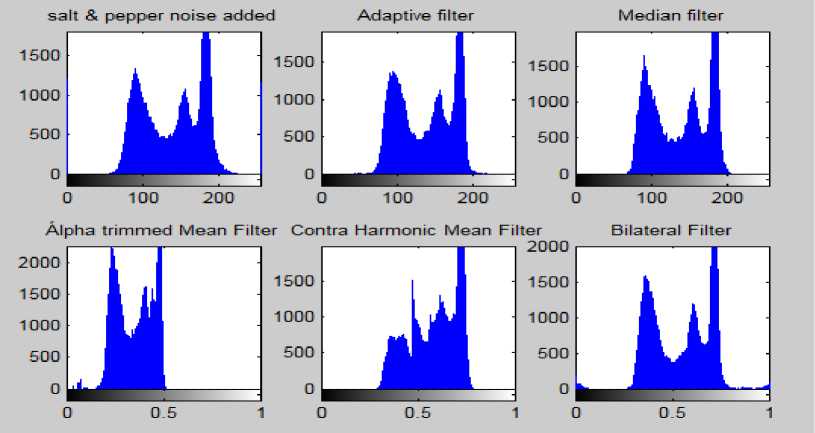
Fig.6. Histogram of Original CML Image, Salt and Pepper Noise Added Image and The Histograms of the Results Produced by the Different Filters
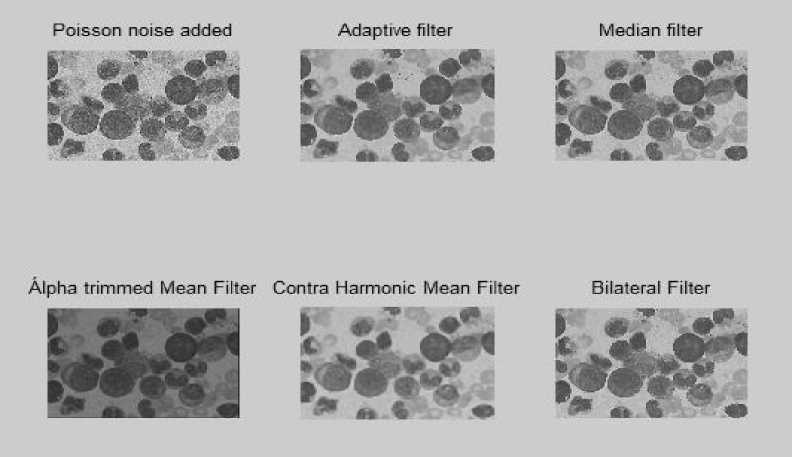
Fig.7. Effects of different filters on the Poisson noise added CML image
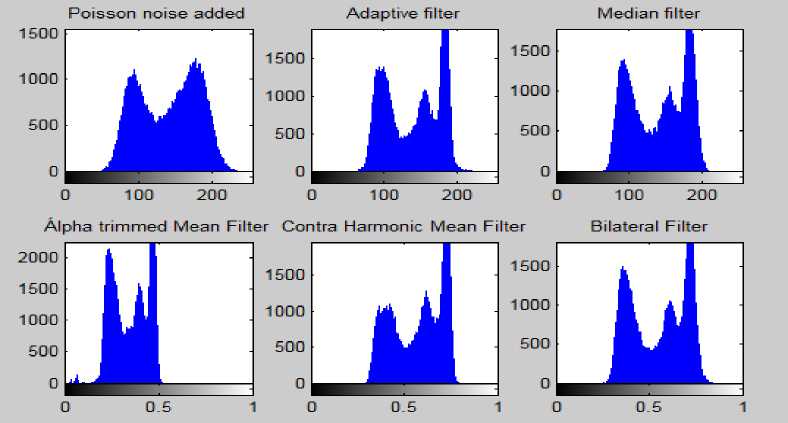
Fig.8. Histogram of original CML Image, Poisson noise added image and the histograms after the application of different filters
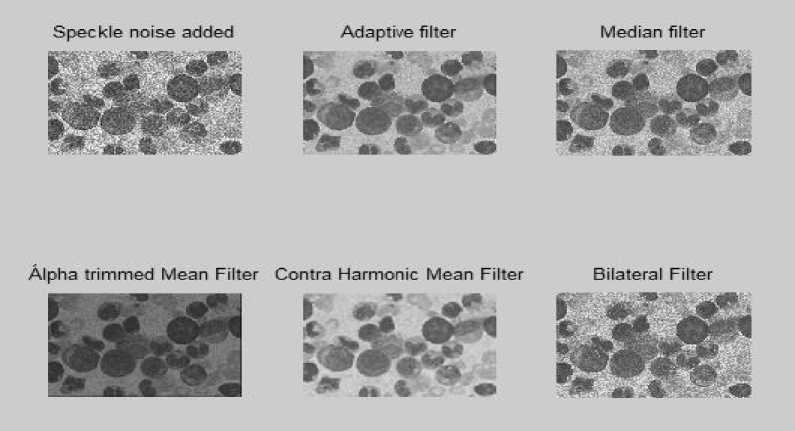
Fig.9. Speckle Noise Added Image and the Effect of Different Filters on This Noise
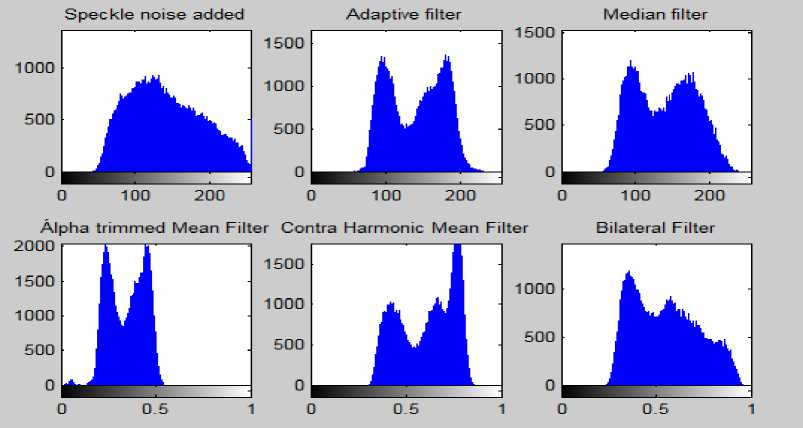
Fig.10. Histogram of Original CML Image, Speckle Noise Added Image and the Histograms Showing the Effects of Different Filters
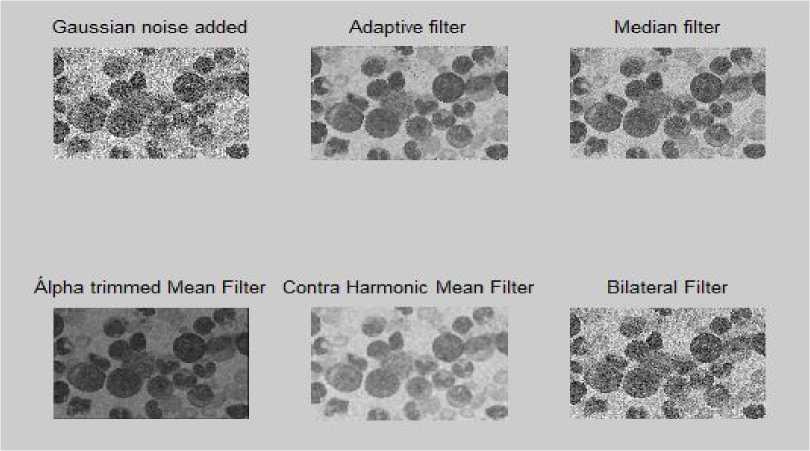
Fig.11. Effects of Different Filters on the Gaussian Noise Added CML Image
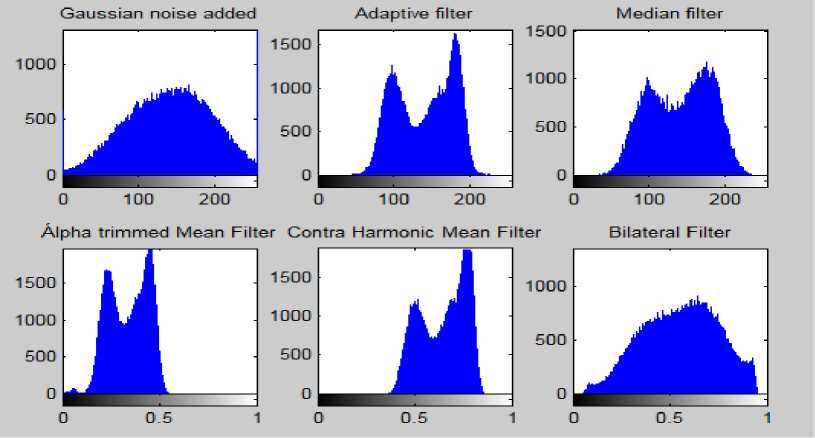
Fig.12. Histogram of Original CML Image, Gaussian Noise Added Image and the Histograms Showing the Effects of Different Filters
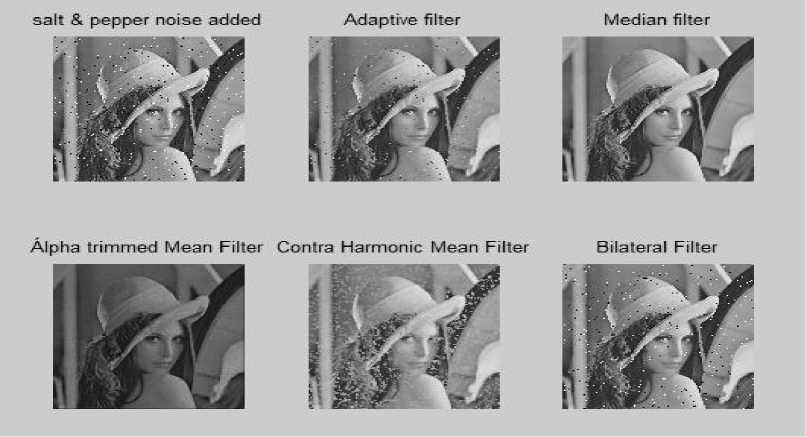
Fig.13. Salt and Pepper Noise Added to the Lenna Image and the Effect of Different Filters on This Noise Added Image
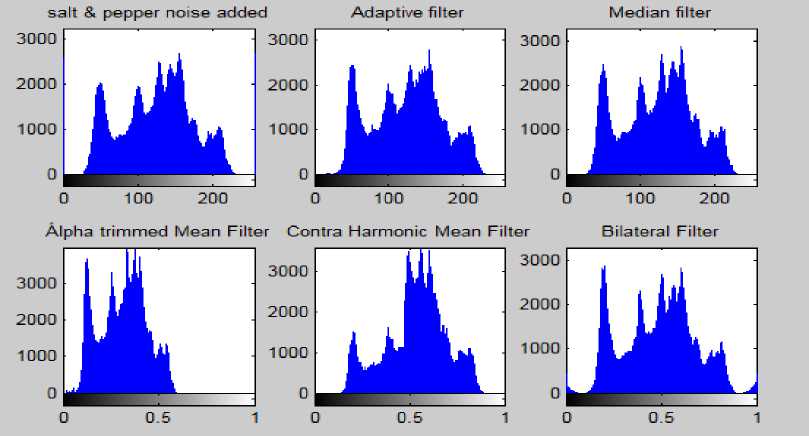
Fig.14. Histogram of Original Lenna Image, Salt and Pepper Noise Added Image and the Histograms of the Effects of Different Filters
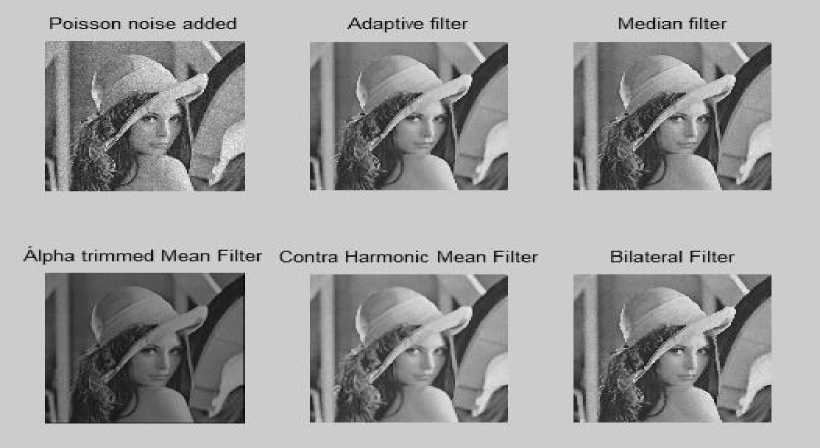
Fig.15. Effects of Different Filters on the Poisson Noise Added Lenna Image
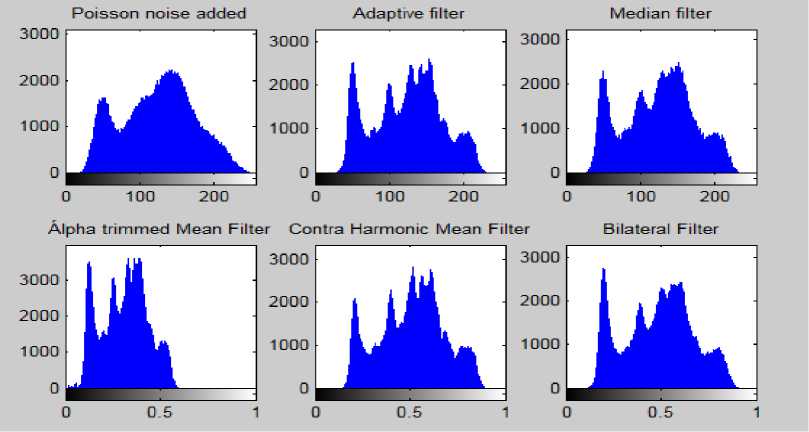
Fig.16. Histogram of Original Lenna Image, Poisson Noise Added Image and the Histograms after the Application of Different Filters
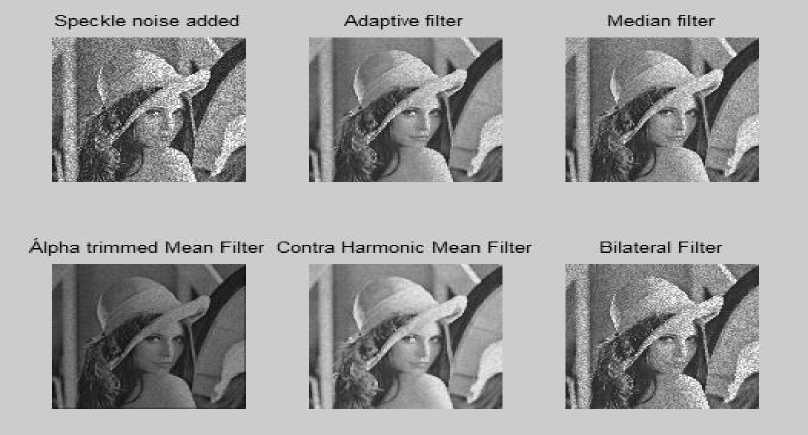
Fig.17. Speckle Noise Added Lenna Image and the Effect of Different Filters on This Noise
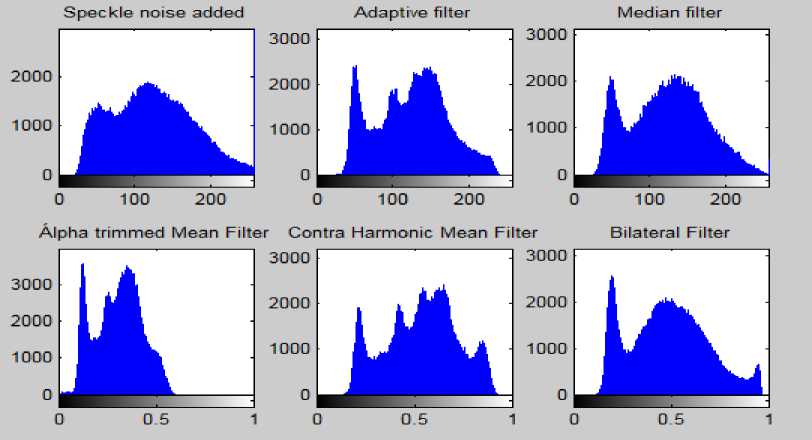
Fig.18. Histogram of original Lenna Image, Speckle noise added image and the histograms showing the effects of different filters
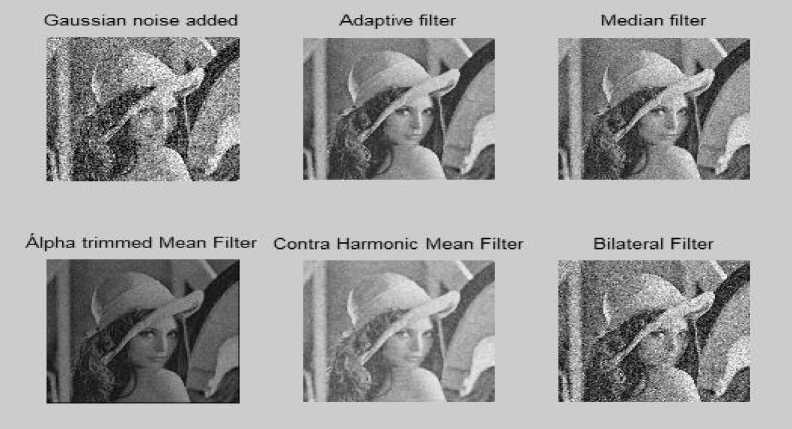
Fig.19. Effects of Different Filters on the Gaussian Noise Added Lenna Image
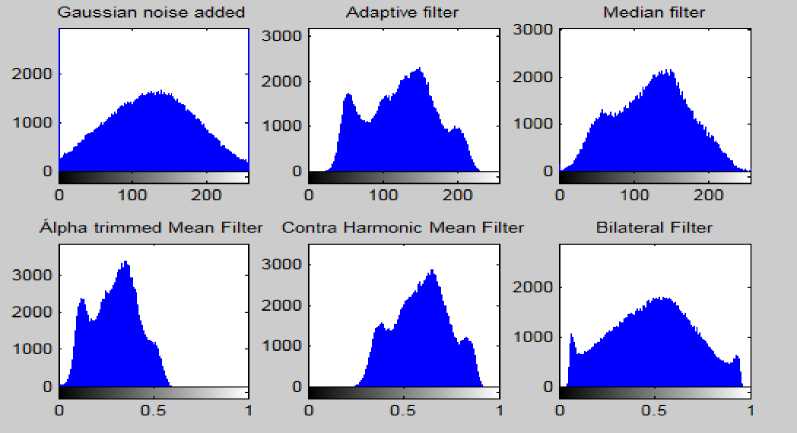
Fig.20. Histogram of Original Lenna Image, Gaussian Noise Added Image and the Histograms Showing the Effects of Different Filters.
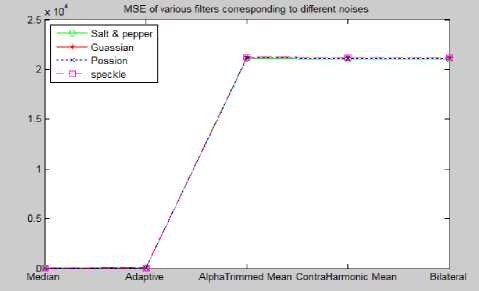
Fig.21. MSE of Different Filters Corresponding to the Different Noises for the Leukemia Images
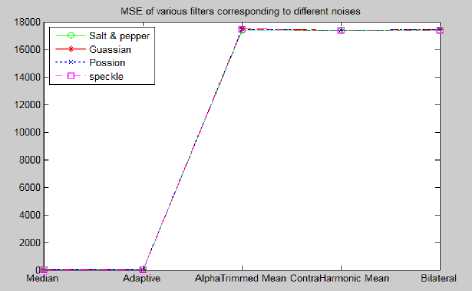
Fig.22. MSE of Different Filters Corresponding to the Different Noises for the Digital Images
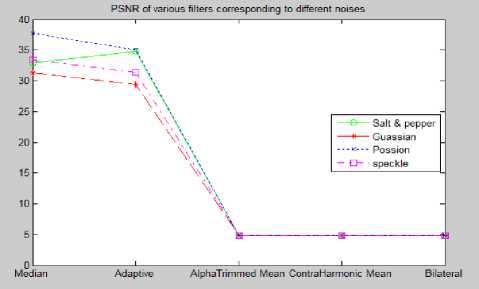
Fig.23. PSNR of Various Filters Corresponding to the Different Noises for the Leukemia Images
-
[1] L, Hailing, “Adaptive Gradient-Based and Anisotropic Diffusion Equation Filtering Algorithm for Microscopic Image Preprocessing”, Journal of Signal and Information Processing, 4, pp. 82-87, 2013.
-
[2] Pawan Patidar et. al., “Image De-noising by various filters for different noise”, International Journal of Computer Applications, vol. 9, Issue 4, November 2010.
-
[3] V. Rohit and A. Jahid, “A Comparative Study of Various Types of Image Noise and Efficient Noise Removal Techniques”, International Journal of Advanced Research in Computer Science and Software Engineering, vol. 3, Issue 10, October 2013.
-
[4] R. C. Gonzalez and R. E. Woods, “Digital Image Processing”, Pearson Publications, 3rd edition, 2009.
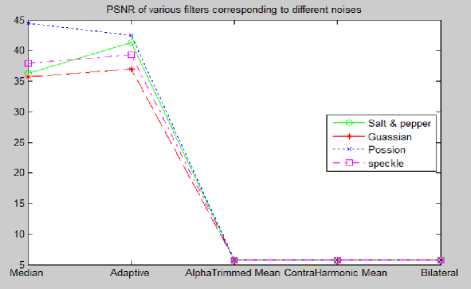
Fig.24. PSNR of Various Filters Corresponding to the Different Noises for the Digital Images
-
[5] M. V. Sarode and P. R. Deshmukh, “Reduction of Speckle Noise and Image Enhancement of Images Using Filtering Technique”, International Journal of Advancements in Technology, vol 2, Issue 1, January 2011.
-
[6] J. Chhikara and J. Singh, “Noise cancellation using adaptive algorithms”, International Journal of Modern Engineering Research, Vol.2, Issue.3, pp-792-795, May-June 2012.
-
[7] R. Lukac, B. Smolka, K. Martin, K. N. Plataniotis, and A. N. Venetsanopoulos, “Vector filtering for color imaging,” IEEE Signal Processing Magazine, vol. 22, no. 1, pp. 74– 86, 2005.
-
[8] K. N. Plataniotis and A. N. Venetsanopoulos, “Color Image Processing and Application", Springer, New York, USA, 2000.
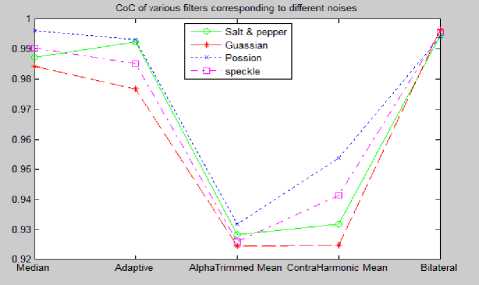
Fig.25. CoC of Various Filters Corresponding to the Different Noises for the Leukemia Images
-
[9] R. Lukac and K. N. Plataniotis, “A taxonomy of color image filtering and enhancement solutions,” Advances in Imaging and Electron Physics, W. Hawkes, Ed., vol. 140, pp. 187–264, Elsevier, New York, USA, 2006.
-
[10] S. Schulte, V. De Witte, and E. E. Kerre, “A fuzzy noise reduction method for color images,” IEEE Transactions on Image Processing, vol. 16, no. 5, pp. 1425–1436, 2007.
-
[11] P.-E. Ng and K.-K. Ma, “A switching median filter with boundary discriminative noise detection for extremely corrupted images,” IEEE Transactions on Image Processing, vol. 15, no. 6, pp. 1506–1516, 2006.
-
[12] Y. Li, F.-L. Chung, and S. Wang, “A robust neuro-fuzzy network approach to impulse noise filtering for color images,” Applied Soft Computing Journal, vol. 8, no. 2, pp. 872–884, 2008.
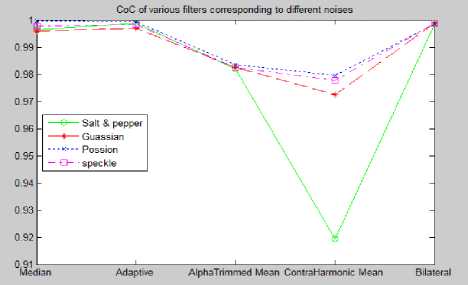
Fig.26. CoC of Various Filters Corresponding to the Different Noises for The Digital Images
-
[13] S. Morillas, V. Gregori, and A. Hervás, “Fuzzy peer groups for reducing mixed Gaussian-impulse noise from color images,” IEEE Transactions on Image Processing, vol. 18, no. 7, pp. 1452–1466, 2009.
-
[14] T. Howlader and Y. P. Chaubey, “Noise reduction of DNA microarray images using complex wavelets,”IEEE Transactions on Image Processing, vol. 19, no. 8, pp. 1953–1967, 2010.
-
[15] D. Zhai, M. Hao, and J. M. Mendel, “A non-singleton interval type-2 fuzzy logic system for universal image noise removal using quantum-behaved particle swarm optimization,” in Proceedings of the IEEE International Conference on Fuzzy Systems (FUZZ '11), pp. 957–964, Taipei, Taiwan, June 2011.
-
[16] T. Mélange, M. Nachtegael, and E. E. Kerre, “Fuzzy random impulse noise removal from color image sequences,” IEEE Transactions on Image Processing, vol. 20, no. 4, pp. 959–970, 2011.
-
[17] C. Brito-Loeza and K. Chen, “On high-order denoising models and fast algorithms for vector-valued images,”
IEEE Transactions on Image Processing, vol. 19, no. 6, pp. 1518–1527, 2010.
-
[18] M. E. Yuksel and A. Basturk, “Application of type-2 fuzzy logic filtering to reduce noise in color images,” IEEE Computational Intelligence MagazIne, vol. 7, no. 3, pp. 25–35, 2012.
-
[19] Z. Xu, H. R. Wu, B. Qiu, and X. Yu, “Geometric features-based filtering for suppression of impulse noise in color images,” IEEE Transactions on Image Processing, vol. 18, no. 8, pp. 1742–1759, 2009.
-
[20] Y. Dong and S. Xu, “A new directional weighted median filter for removal of random-valued impulse noise,” IEEE Signal Processing Letters, vol. 14, no. 3, pp. 193–196, 2007.
-
[21] S. Schulte, S. Morillas, V. Gregori, and E. E. Kerre, “A new fuzzy color correlated impulse noise reduction method,” IEEE Transactions on Image Processing, vol. 16, no. 10, pp. 2565–2575, 2007.
-
[22] S. Schulte, V. De Witte, M. Nachtegael, D. vander Weken, and E. E. Kerre, “Fuzzy two-step filter for impulse noise reduction from color images,” IEEE Transactions on Image Processing, vol. 15, no. 11, pp. 3567–3578, 2006.
-
[23] Y. Li, G. R. Arce, and J. Bacca, “Weighted median filters for multichannel signals,” IEEE Transactions on Signal Processing, vol. 54, no. 11, pp. 4271–4281, 2006.
-
[24] J. Benesty, J. Chen and Y. Huang, “On the Importance of the Pearson Correlation Coefficient in noise reduction”, IEEE Transactions on Audio, Speech and Language Processing, vol. 16, No. 4, May 2008.
-
[25] F. Bergholm, J. Adler and I. Parmryd, “Analysis of Bias in the Apparent Correlation Coefficient Between Image Pairs Corrupted by Severe Noise”, Journal of Mathematics Imaging and Vision, vol. 37, issue 3, pp. 204-219, July 2010.
-
[26] Salomon, David, “Data Compression: The Complete Reference (4 ed.)”, Springer p. 281, ISBN 978
1846286025, 2007.
-
[27] P. Strobach, “Low-Rank Adaptive Filters”, IEEE
Transactions on Signal Processing, vol. 44, no. 22, Dec 1996.
-
[28] J. W. Lee and G.K. Lee, “Design of an Adaptive Filter with a Dynamic Structure for ECG Signal Processing”, International Journal of Control, Automation and Systems,
vol. 3, no. 1, pp. 137-142, March 2005.
References Performance Evaluation and Comparative Analysis of Different Filters for Noise Reduction
- L, Hailing, "Adaptive Gradient-Based and Anisotropic Diffusion Equation Filtering Algorithm for Microscopic Image Preprocessing", Journal of Signal and Information Processing, 4, pp. 82-87, 2013.
- Pawan Patidar et. al., "Image De-noising by various filters for different noise", International Journal of Computer Applications, vol. 9, Issue 4, November 2010.
- V. Rohit and A. Jahid, "A Comparative Study of Various Types of Image Noise and Efficient Noise Removal Techniques", International Journal of Advanced Research in Computer Science and Software Engineering, vol. 3, Issue 10, October 2013.
- R. C. Gonzalez and R. E. Woods, "Digital Image Processing", Pearson Publications, 3rd edition, 2009.
- M. V. Sarode and P. R. Deshmukh, "Reduction of Speckle Noise and Image Enhancement of Images Using Filtering Technique", International Journal of Advancements in Technology, vol 2, Issue 1, January 2011.
- J. Chhikara and J. Singh, "Noise cancellation using adaptive algorithms", International Journal of Modern Engineering Research, Vol.2, Issue.3, pp-792-795, May-June 2012.
- R. Lukac, B. Smolka, K. Martin, K. N. Plataniotis, and A. N. Venetsanopoulos, "Vector filtering for color imaging," IEEE Signal Processing Magazine, vol. 22, no. 1, pp. 74–86, 2005.
- K. N. Plataniotis and A. N. Venetsanopoulos, "Color Image Processing and Application", Springer, New York, USA, 2000.
- R. Lukac and K. N. Plataniotis, "A taxonomy of color image filtering and enhancement solutions," Advances in Imaging and Electron Physics, W. Hawkes, Ed., vol. 140, pp. 187–264, Elsevier, New York, USA, 2006.
- S. Schulte, V. De Witte, and E. E. Kerre, "A fuzzy noise reduction method for color images," IEEE Transactions on Image Processing, vol. 16, no. 5, pp. 1425–1436, 2007.
- P.-E. Ng and K.-K. Ma, "A switching median filter with boundary discriminative noise detection for extremely corrupted images," IEEE Transactions on Image Processing, vol. 15, no. 6, pp. 1506–1516, 2006.
- Y. Li, F.-L. Chung, and S. Wang, "A robust neuro-fuzzy network approach to impulse noise filtering for color images," Applied Soft Computing Journal, vol. 8, no. 2, pp. 872–884, 2008.
- S. Morillas, V. Gregori, and A. Hervás, "Fuzzy peer groups for reducing mixed Gaussian-impulse noise from color images," IEEE Transactions on Image Processing, vol. 18, no. 7, pp. 1452–1466, 2009.
- T. Howlader and Y. P. Chaubey, "Noise reduction of DNA microarray images using complex wavelets,"IEEE Transactions on Image Processing, vol. 19, no. 8, pp. 1953–1967, 2010.
- D. Zhai, M. Hao, and J. M. Mendel, "A non-singleton interval type-2 fuzzy logic system for universal image noise removal using quantum-behaved particle swarm optimization," in Proceedings of the IEEE International Conference on Fuzzy Systems (FUZZ '11), pp. 957–964, Taipei, Taiwan, June 2011.
- T. Mélange, M. Nachtegael, and E. E. Kerre, "Fuzzy random impulse noise removal from color image sequences," IEEE Transactions on Image Processing, vol. 20, no. 4, pp. 959–970, 2011.
- C. Brito-Loeza and K. Chen, "On high-order denoising models and fast algorithms for vector-valued images," IEEE Transactions on Image Processing, vol. 19, no. 6, pp. 1518–1527, 2010.
- M. E. Yuksel and A. Basturk, "Application of type-2 fuzzy logic filtering to reduce noise in color images," IEEE Computational Intelligence MagazIne, vol. 7, no. 3, pp. 25–35, 2012.
- Z. Xu, H. R. Wu, B. Qiu, and X. Yu, "Geometric features-based filtering for suppression of impulse noise in color images," IEEE Transactions on Image Processing, vol. 18, no. 8, pp. 1742–1759, 2009.
- Y. Dong and S. Xu, "A new directional weighted median filter for removal of random-valued impulse noise," IEEE Signal Processing Letters, vol. 14, no. 3, pp. 193–196, 2007.
- S. Schulte, S. Morillas, V. Gregori, and E. E. Kerre, "A new fuzzy color correlated impulse noise reduction method," IEEE Transactions on Image Processing, vol. 16, no. 10, pp. 2565–2575, 2007.
- S. Schulte, V. De Witte, M. Nachtegael, D. vander Weken, and E. E. Kerre, "Fuzzy two-step filter for impulse noise reduction from color images," IEEE Transactions on Image Processing, vol. 15, no. 11, pp. 3567–3578, 2006.
- Y. Li, G. R. Arce, and J. Bacca, "Weighted median filters for multichannel signals," IEEE Transactions on Signal Processing, vol. 54, no. 11, pp. 4271–4281, 2006.
- J. Benesty, J. Chen and Y. Huang, "On the Importance of the Pearson Correlation Coefficient in noise reduction", IEEE Transactions on Audio, Speech and Language Processing, vol. 16, No. 4, May 2008.
- F. Bergholm, J. Adler and I. Parmryd, "Analysis of Bias in the Apparent Correlation Coefficient Between Image Pairs Corrupted by Severe Noise", Journal of Mathematics Imaging and Vision, vol. 37, issue 3, pp. 204-219, July 2010.
- Salomon, David, "Data Compression: The Complete Reference (4 ed.)", Springer p. 281, ISBN 978-1846286025, 2007.
- P. Strobach, "Low-Rank Adaptive Filters", IEEE Transactions on Signal Processing, vol. 44, no. 22, Dec 1996.
- J. W. Lee and G.K. Lee, "Design of an Adaptive Filter with a Dynamic Structure for ECG Signal Processing", International Journal of Control, Automation and Systems, vol. 3, no. 1, pp. 137-142, March 2005.
