Performance Evaluation of DWT Compared to DCT for Compression Biomedical Image

Author: Beladgham Mohammed, Habchi Yassine, Moulay Lakhdar Abdelmouneim, Bassou Abdesselam, Taleb-Ahmed Abdelmalik
Journal: International Journal of Modern Education and Computer Science (IJMECS) @ijmecs
Article in issue: 4 vol.6, 2014.
Free access
The image compression has for objective to reduce the volume of data required by the encoding of image, for applications of transmission or saving. For this we use the redundancies which exists within an image (a pixel has a good chance of having a luminance close to those of its neighbors) or between successive images in a sequence. We limit ourselves to the exploitation of redundancies within an image and we will work on gray level images of size 512x512. For image coding we chose an encoder based on progressive coding of data, coder is EZW (EMBEDDED WAVELET ZeroTree ENCODING, Shapiro 1993), the basis of this encoder a comparison is made between two types of transforms DWT (DISCREET WAVELETS TRANSFORM) and DCT (DISCRETE COSINE TRANSFORM) just to have the type of transformation that allows us to have a better visual quality of the image after decomposition. . Visual quality image is judged by two important devaluation parameters PSNR and MSSIM.
Image compression, DWT, DCT, EZW
Short address: https://sciup.org/15014642
IDR: 15014642
Text of the scientific article Performance Evaluation of DWT Compared to DCT for Compression Biomedical Image
Published Online April 2014 in MECS DOI: 10.5815/ijmecs.2014.04.02
The main objective of compression is minimized length of the sequence of bits required for represented, while maintaining adequate quality information.
The principle is to perform a compression with the help of a decomposition type of efficient processing. The coefficients obtained after applying a transform are encoded and quantified for transmission or storage.
The decompression consists to inserting, to the extent possible, the above operations.
From the decoded and dequantised coefficients, an image is reconstructed by applying the inverse discrete transform of the image, thus obtained image is the compressed image. All of these operations are shown schematically by the following fig.
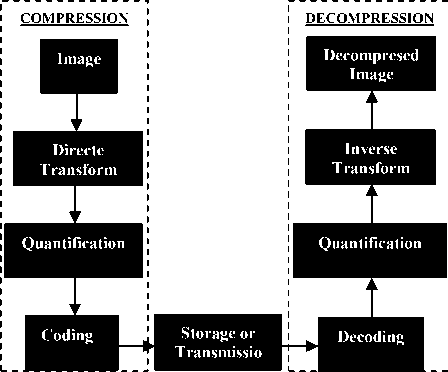
Fig.1 Diagram of the compression / decompression of an image
The type of transformation plays an important role in the domain of compression especially happen to have an identification between the decompressed image and the compressed [1].
In this work, we are interested by the wavelet transformed (first generation wavelet).
-
II. wavelet transform
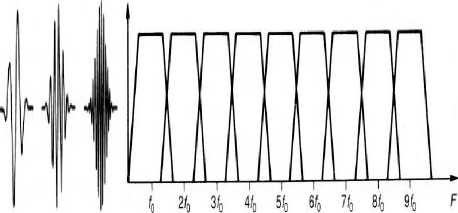
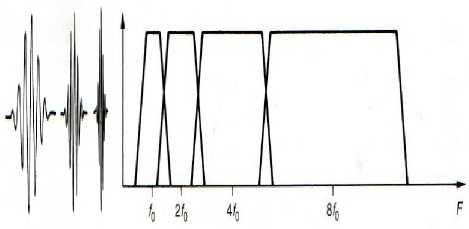
The wavelet transform has not been discovered by a particular person, but evolved from a series of similar ideas and received a complete mathematical development until very recently. The wavelet transform is similar to the Fourier transform because it has the basic functions of various frequencies are multiplied by the input signal to identify the frequencies it contains, but transform Fourie concerns only the infinite periodic signals and requires a fenestrations. The wavelet transform contain a basic functions to which it has recourse are finished sine curves on the time axis, hence its name. Wavelet transforms are not using a fixed window but a window period which is inversely proportional to the frequency being analyzed. A useful combination of time and frequency resolution is obtained. Contrary to the discrete Fourier transform, the wavelet basis functions are calibrated so as to contain the same number of cycles with respect to the frequency. In consequence their ability frequency discriminator is a constant proportion of the central frequency , the wavelet transform in the frequency domain divided octave bands instead of the same width Fourier transform.
(a)
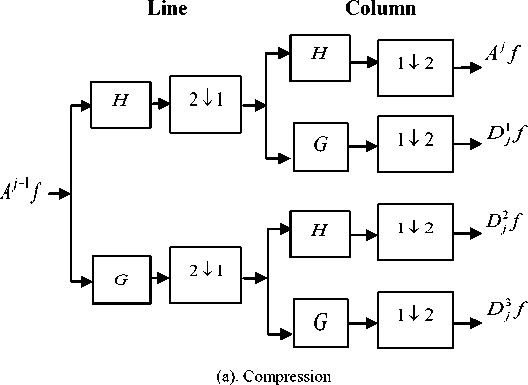
Line
Column
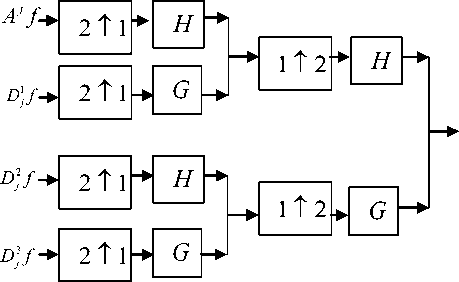
(b). Decompression
Fig.3 Stages of compression(a) / decompression(b) using wavelet transform
(b)
Fig.2 (a).Fourier transform, (b). Wavelet transform
Wavelet transform shows their importance in several application domain such as filtering and compression etc. and this type of transformation has been successfully used in audio and in virtual montage system in video as well as other areas such as radiology and geology. In image, the wavelet transform does not show the apparition blocks found with coding based DCT during heavy debit reductions effect. The wavelet transform is naturally a multiresolution transform that allows a configurable decoding [2][3][4].
The following figure shows the different stages of wavelet compression and decompression.
-
III. Encodeur EZW
When the transformation and quantization performed, there is a finite sequence X ˆ of elements belonging to a finite set of symbols S . The purpose of coding is to represent the best example of a sequence of 0 and 1; it is now code X ˆ as efficiently as possible.
In general this means that the more economically possible is to say, minimizing the quantity of information used to describe this group. This is the main purpose of data compression. This objective is conventional and widely studied in information theory. There are many ways to construct a code.
One idea is to encode each symbol S using binary word of fixed length code (fixed length code). Thus, a sequence of 0 and 1 is obtained of X ˆ encode. From the standpoint of compression, this method hardly provides interest.
A second idea is to exploit that X contains a large quantity of null values. It is then encoded with shorter sequences the most frequent symbol (variable length code). This reduces the quantity of information needed to represent X. This method combined with Huffman coding type.
A third idea, decisive for the use of wavelets in image compression, is to exploit a fundamental way the tree structure of the wavelet decomposition, some encoder developed in the years 1993-2000 using this idea, in particular the EZW coding algorithm due to SHAPIRO, which we will interest.
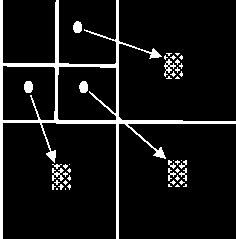
The EZW algorithm (EMBEDDED WAVELET ZeroTree ENCODING) is based on wavelet decomposition, this decomposition transforms into a set of coefficients of large average approximation and detail coefficient, which on average always increase with scale. The multi-resolution and the local aspect of the wavelet decomposition, allow to link, at least locally, the coefficients across scales decomposition. The central idea of the EZW algorithm is to exploit the inter-scale dependence of these coefficients to perform encoding. Specifically, it linked a detail coefficient of the coarsest level J to level four descendants J - 1, and so follows up to level 1. The corresponding tree is shown in the following figure:
A2 H 2
H 1
V 2 D 2
V 1 D 1
-
IV. QUALITYEVALUATION PARAMETER
The Peak Signal to Noise Ratio (PSNR) is the most commonly used as a measure of quality of reconstruction in image compression. The PSNR were identified using the following formulate:
MSE =
1 M - 1 N - 1 Г A
—УУ I(i,j)-1(i,j) m.n £0 j-G L v ’ v '
Mean Square Error (MSE) which requires two MxN gray scale images I and I where one of the images is considered as a compression of the other is defined as:
• The PSNR is defined as:
Fig.4 Trees related coefficients across scales
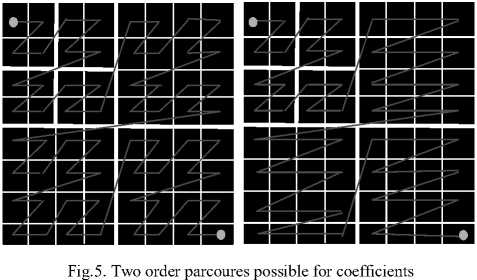
The detail coefficients of wavelet-decomposition are then aggregated across scales by quaternary trees whose roots are located in the higher scale. A zerotree is a quadtree which all the coefficients are, in absolute value, lower than the coefficients of the root. The basic idea of the EZW algorithm is to exploit the decrease of coefficients across scales and the strong probability of having zerotree. When the root of the coefficient is less than a fixed threshold, all other recess are below this threshold and the entire tree can be encoded by one symbol. When the wavelet decomposition generates, the EZW algorithm perform several successive approximations by quantization of coefficients. The idea is to go several times the following coefficients. Each parcour consists of two steps. At first, the main step, they are compared to a threshold to be classified and possibly coded. The second step is a refinement. At each step the threshold decreases, thereby refine approximations. The order of coefficients is important. To take advantage of zero trees, it is necessary to read the coefficients starting with those of the large scales. Each coefficient is analyzed before and his descendants. Several possibilities exist.
PSNR = 1G.log10
[dB]
MSE
Usually an image is encoded on 8 bits. It is represented by 256 gray levels, which vary between 0 and 255, the extent or dynamics of the image is 255.
• The structural similarity index (SSIM):
The PSNR measurement gives a numerical value on the damage, but it does not describe its type. Moreover, as is often noted in [8], [9], [10], it does not quite represent the quality perceived by human observers. For medical imaging applications where images are degraded must eventually be examined by experts, traditional evaluation remains insufficient. For this reason, objective approaches are needed to assess the medical imaging quality. We then evaluate a new paradigm to estimate the quality of medical images, specifically the ones compressed by wavelet transform, based on the assumption that the human visual system (HVS) is highly adapted to extract structural information. The similarity compares the brightness, contrast and structure between each pair of vectors, where the structural similarity index (SSIM) between two signals x and y is given by the following expression:
SSIM ( x.y)- l ( x.y) c ( x.y) s ( x.y) (3)
Finally the quality measurement can provide a spatial map of the local image quality, which provides more information on the image quality degradation, which is useful in medical imaging applications. For application, we require a single overall measurement of the whole image quality that is given by the following formula:
If the following thresholds are not predetermined it must be sent to the decoder. But in general, a thresholding is used: the threshold and each of the following steps are initialized by dividing the two current threshold. This method allows direct work on writing binary coefficients. [5][6][7]
MSSIM
(1.1) =M £SSIM (1.. I,)
Where I and Iˆ are respectively the reference and ˆ degraded images, i and i are the contents of images at the i-th local window.
M : the total number of local windows in image. The MSSIM values exhibit greater consistency with the visual quality.
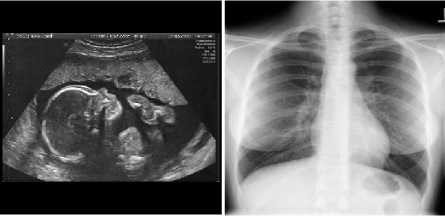
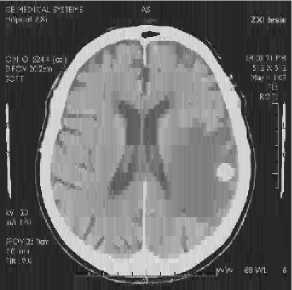
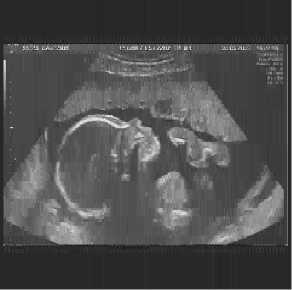
In this article, we give numerical experiments to test our compression method. For this reason we opted for a set of medical images (MRI, CT, ECHO and TOREX) gray scale coded on 8 bits per pixel. The importance of our work lies in the possibility of reducing the bit rate for which the image quality remains acceptable. Estimates and judgments of compressed image quality are given by the PSNR evaluation parameters and the MSSIM similarity Index.
For each application we vary bit rate and calculate the PSNR and MSSIM. The results obtained are given in Table1 and Table2.

(a) (b)
e. Rc= 1 bpp f. Rc= 1.5bpp
j. Rc= 2 bpp
(c) (d)
Fig. 6 Popular test images (a). MRI, (b) CT, (c) ECHO, (d) TOREX
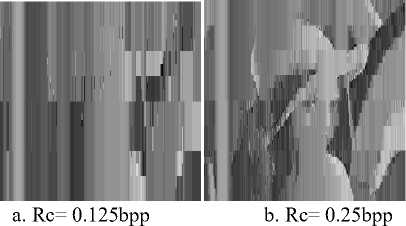
Fig. 7 Image compressed resultants by (DCT+EZW) for different values of bit-rate
In this section, we give numerical experiments to test compressed method using two algorithms DWT and DCT, for this we have try to determine transform type who permits us to have a high value PSNR for compression domain.
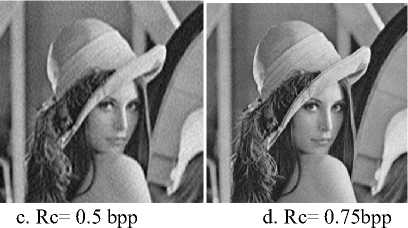
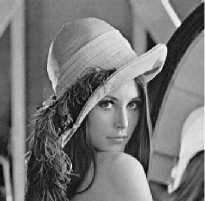
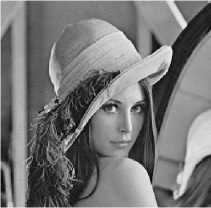
In the following, we present a set of compressed image using two type of transform DWT and DCT for different value of bit-rate (Rc) for LINA image.
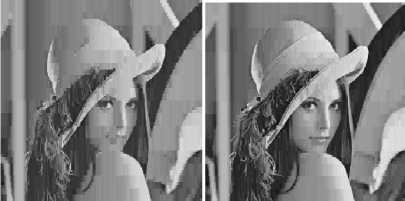
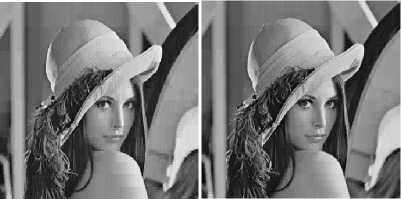
c. Rc= 0.5 bpp d. Rc= 0.75bpp
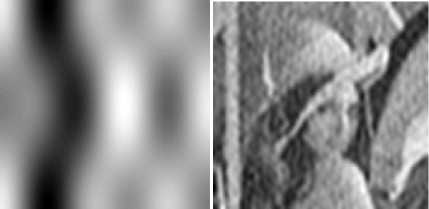
a. Rc= 0.125bpp b. Rc= 0.25bpp
e. Rc= 1 bpp f. Rc= 1.5bpp

j. Rc= 2 bpp
Fig. 8 Image compressed resultants by (DWT+EZW) for different values of bit-rate
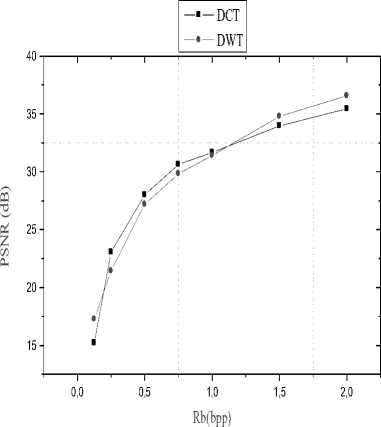
Fig 9. Numerical results PSNR of compression images by DCT and DWT transform coupled with EZW coder
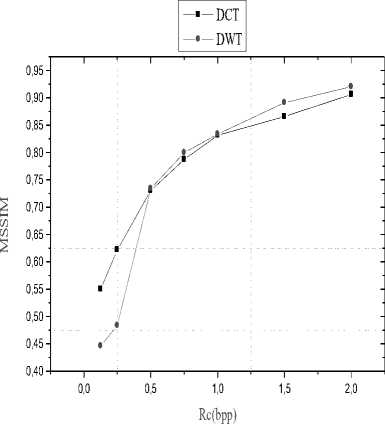
Fig 10. Numerical results MSSIM of compression images by DCT and DWT transform coupled with EZW coder
Visually, from the two curves, it is clearly that the (DWT+EZW) algorithm allows us to have a good image reconstruction so a better image visual quality and this is proved by the large values of the parameters evaluation
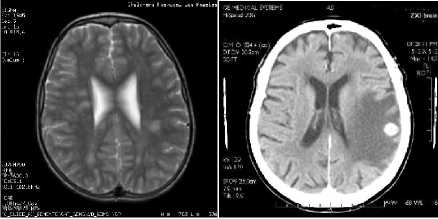
After displaying the performance of the compression wavelet to natural image (LINA), now we apply our compression algorithm (DWT+EZW) to the medical and satellite image. To do so, we opted for a set of images of size 512x512 (grayscale) encoded on 8bpp.
The results are present in the following figure.
PSNR= 26.6373bpp MSSIM= 0.6720
PSNR= 27.3487bpp MSSIM=0.7133
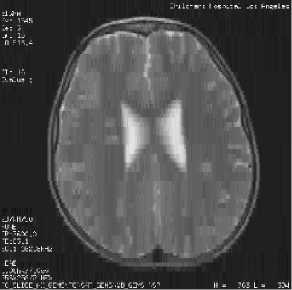
PSNR= 29.0643bpp MSSIM=0.7624
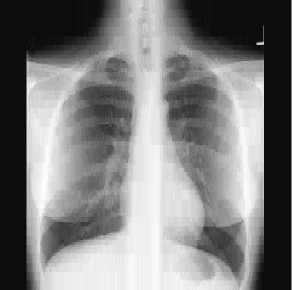
PSNR= 34.0383bpp MSSIM=0.8639
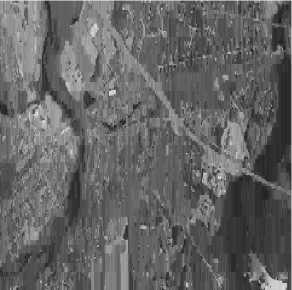
PSNR= 23.5839 bpp MSSIM= 0.5680
Fig. 11 Image compressed resultants by (DWT+EZW) for Rc=1.5bpp
-
[7] HUFFMAN D.A, "A method for the construction of
minimum redundancy codes", Proc. Of IRE, n°40, 1952.
-
[8] W.S. Geisler, M.S. Banks, "Visual Performance,
Handbook of Optics", Vol. 1, McGraw-Hill, NY, USA, 1995.
-
[9] A.B. Watson, L.B. Kreslake, "Measurement of Visual Impairment Scales for Digital Video, Human Vision and Electronic Imaging", Conference, San Jose, CA, USA, SPIE Vol. 4299, Jan. 2001, 2001, pp. 79 – 89.
-
[10] Eugene K. Yen and Roger G. Johnston, "The Ineffectiveness of the Correlation Coefficient for Image Comparisons", Vulnerability Assessment Team, Los Alamos National Laboratory, MS J565, Los Alamos, New Mexico 87545.
Authors’ Profiles
-
VI. Conclusion and future work
In this paper, the compressed algorithm is applied for each image type. To facilitate the obtained of the best visual quality image, an algorithm of compression was coupled by preferment transform based on the decomposition in three directions (H, V and D), this transform is nominated by Discrete wavelet transform (DWT). Due to the structure of this transform, an adaptation of the algorithm (Transform and Coder) was given. The simulation over compressing a set of natural and medical images gray level size 512x 512 encoded on 8 bits per pixel, DWT permits to achieve higher PSNR and MSSIM value compared with DCT transform , and for all considered images type, the proposed algorithm is outperforms for medical image type TOREX.
In the future we are going to work into defining a strategy to exploit the wavelet transform for color image compression.
The authors would like to thank the anonymous reviewers for their careful reading of this article and for their helpful comments.
References Performance Evaluation of DWT Compared to DCT for Compression Biomedical Image
- B.Aoued, "Technique de compression d’images", Office des publications universitaires, Alger, 2004.
- ABRY P, SELLAN F "The wavelet-based synthesis for Fractal Brownian Motion proposed by F.Sellan and Y.Meyer-emarks and fast implementation", Applied and comp. Harmonic An., Vol.3,1996.
- ABRAMOVIC F, BAILEY T, C, SAPATINAS T, "wavelet analysis and its statistical applications", The Statistician, vol.49, 2000.
- John Watkinson, " La réduction de débit en audio et vidéo", éditions eyrolles, ISBN 2-22-09814-6, 1998.
- WITTENS I, NEAL R, CLEARY J, "Arithmitic coding for data compression", comm.of the ACM, vol.30,n°6, 1987.
- HOWARD P.G, WITTER G.S,"Practical Implimentations of arithmetic coding in image and text compression", kluwer academic publisher, 1992.
- HUFFMAN D.A, "A method for the construction of minimum redundancy codes", Proc. Of IRE, n°40, 1952.
- W.S. Geisler, M.S. Banks, "Visual Performance, Handbook of Optics", Vol. 1, McGraw-Hill, NY, USA, 1995.
- A.B. Watson, L.B. Kreslake, "Measurement of Visual Impairment Scales for Digital Video, Human Vision and Electronic Imaging", Conference, San Jose, CA, USA, SPIE Vol. 4299, Jan. 2001, 2001, pp. 79 – 89.
- Eugene K. Yen and Roger G. Johnston, "The Ineffectiveness of the Correlation Coefficient for Image Comparisons", Vulnerability Assessment Team, Los Alamos National Laboratory, MS J565, Los Alamos, New Mexico 87545.
