Performance Evaluation of Industrial and Commercial bank of China based on DuPont Analysis

Author: Qiaopeng Ma, Xi Wang
Journal: International Journal of Mathematical Sciences and Computing @ijmsc
Article in issue: 1 vol.9, 2023.
Free access
With the reform of Chinese economic system, the development of enterprises is facing many risks and challenges. In order to understand the state of operation of enterprises, it is necessary to apply relevant methods to evaluate the enterprise performance. Taking Industrial and Commercial Bank of China as an example, this paper selects its financial data from 2018 to 2021. Firstly, DuPont analysis is applied to decompose the return on equity into the product of profit margin on sales, total assets turnover ratio and equity multiplier. Then analyzes the effect of the changes of these three factors on the return on equity respectively by using the Chain substitution method. The results show that the effect of profit margin on sales on return on equity decreases year by year and tends to be positive from negative. The effect of total assets turnover ratio on return on equity changes from positive to negative and then to positive, while the effect of equity multiplier is opposite. These results provide a direction for the adjustment of the return on equity of Industrial and Commercial Bank of China. Finally, according to the results, some suggestions are put forward for the development of Industrial and Commercial Bank of China.
DuPont analysis, Chain substitution method, Return on equity, Performance evaluation
Short address: https://sciup.org/15019044
IDR: 15019044 | DOI: 10.5815/ijmsc.2023.01.04
Text of the scientific article Performance Evaluation of Industrial and Commercial bank of China based on DuPont Analysis
Enterprise performance evaluation refers to the value judgment of the business process and its results by using specific indicators and standards and scientific methods in order to achieve the strategic goals of the enterprise. Understanding the financial and non-financial factors that affect the enterprise’s performance and then evaluating the enterprise’s performance will help the enterprise to remain invincible in the fierce market environment [1]. By evaluating the production and operation activities, it can help to find the weak links in the management of the enterprise and put forward the improvement measures and targets in order to make the enterprise get a substantial progress [2].
There are many methods for enterprise performance evaluation. Some scholars established multiple linear or nonlinear regression models [3,4] of performance and its influencing factors to evaluate performance. Some scholars combine financial indicators and non-financial indicators for evaluation [5], while others improve and innovate new methods on the basis of existing methods [6]. Therefore, each method has its advantages and disadvantages. In order to comprehensively evaluate the performance of an enterprise, it is necessary to consider the actual situation of the enterprise itself and choose the appropriate method.
Common performance evaluation methods include Wall scoring method, economic value added, etc., but some of these methods can not reflect the relationship between various aspects of the financial situation of the enterprise, and some ignore the effect of non-financial information. DuPont analysis is a typical financial analysis method to evaluate the financial operation situation from the internal relations of enterprises. In the comprehensive analysis of financial situation, it links various financial ratios and comprehensively reveals the overall financial situation of the enterprise. Therefore, this paper takes Industrial and Commercial Bank of China (ICBC) as an example, uses DuPont analysis to decompose the return on equity (ROE) into profit margin on sales, total assets turnover ratio, and equity multiplier, and then uses the Chain substitution method to analyze the effect of changes in these factors on the ROE, analyze the specific factors that affect ICBC’s performance, so as to point out the direction for its future development.
2. Literature Review
DuPont analysis is widely used in enterprise performance evaluation. In [7], Zhao applied DuPont analysis to analyze the source factors affecting the profitability of environmental sanitation enterprises. In [8], Liu and Wang analyzed the profitability, operation and solvency abilities of Anhui Huamao Group Company Limited from 2017 to 2019 using the DuPont analysis. In [9], taking Yuantong Express as an example, Ren et al. analyzed the debt paying ability, operation ability, development ability and profitability of the enterprise based on the semi-annual financial statement data disclosed by the company by using DuPont analysis system. In [10], using the example of China Evergrand Group, Liu analyzed its four main financial abilities (profitability, solvency, operation ability and development ability), and used Dupont analysis to conduct financial analysis.
3. Brief Introduction of Performance Evaluation Methods
At present, there are many methods for performance evaluation. Here we choose the following three common performance evaluation methods. Wall scoring method is based on financial indicators for analysis. Economic value added (EVA) focuses on shareholders’ equity. Balanced score card (BSC) measures enterprise performance from four dimensions. These are similar to the idea that DuPont analysis takes ROE as the core and proceeds from the interrelationship of all aspects. Here is a brief introduction to them.
3.1. Wall Scoring Method
3.2. Economic Value Added
3.3. Balanced Score Card
4. DuPont Analysis
Wall scoring method refers to the method of scoring selected financial ratios, calculating comprehensive scores, and evaluating the comprehensive financial status of enterprises. The earliest adopter of this method is Alexander Wall, who proposed the concept of credit ability index in his book “Credit Barometer Research” and “Financial Statement Ratio Analysis” [11]. He mainly selected seven financial indicators and assigned different weights to them. Then he took the industry average as a reference to get the standard ratio, and then compared the actual ratio with the standard ratio, that is, the relative ratio. Finally, he multiplied the relative ratio and the weight of each indicator to get the total score, so as to comprehensively evaluate the credit level and financial condition. Compared with other comprehensive evaluation methods, Wall scoring method can not only understand the financial situation of enterprises, but also evaluate the position of enterprises in the market competition. However, this method can’t reflect the relationship between various aspects of the financial situation of the enterprise, in the selection of seven indicators is obviously not enough, has certain defects.
EVA refers to the residual income after deducting the cost of all invested capital from the net operating profit after tax. It is a performance evaluation method developed based on the thought of residual income. It adjusts the existing indexes on the basis of the traditional financial indexes. It argues that both equity and debt capital have costs, and only when the management’s operating performance is greater than the full cost of capital can it bring real wealth to shareholders [12]. EVA is a method that attaches importance to the interests of shareholders. The core of EVA is the wealth of shareholders, which reflects the wealth created by the management for shareholders after deducting all the capital cost. It calculated the economic profits, can relatively truly present the enterprise performance, but it focuses on the enterprise’s financial performance, and ignore the impact of the financial information, and managers will pay more attention to low-risk short-term investments that can rapidly improve EVA because of this evaluation method, this is its biggest weaknesses.
BSC was proposed by Professor Robert and Professor Norton. The original management intention was to integrate enterprise strategy and performance. In the process of application and development, the enterprise operation and the learning and growth of employees were introduced, and finally the operability of the strategic objectives was achieved, giving more consideration to the compatibility of part and whole, financial and non-financial [13], process and result, advanced and excessive. It is a new performance management system that implements the organization’s strategy into operational indicators and target values from the four dimensions of finance, customer, internal operation, learning and growth [14]. In the financial dimension, financial indicators are used to analyze the operating state and performance of the enterprise. The customer dimension reflects the ability of the enterprise to obtain and retain customers, the internal operation dimension reflects the level of the enterprise’ s use of internal resources, and the learning and growth dimension reflects the ability of development and growth of the enterprise. However, this method also has some defects. For some enterprises, it is difficult to quantify the non-financial indicators and the tedious operation will hinder the enterprises to make timely and rapid adjustment to the performance.
The financial situation of an enterprise is a complete system, and various internal factors are interdependent and interact with each other. The change of any factor will cause the change of the overall financial situation of an enterprise. DuPont analysis is a typical financial analysis method to evaluate the financial operation situation from the internal relations of enterprises. It was first created by DuPont Company in the United States. Its basic idea is to decompose the ROE of the enterprise step by step, and finally convert it into the product of multiple financial ratios, so as to analyze and compare the enterprise’s performance more deeply and comprehensively. In the comprehensive analysis of financial situation, it links various financial ratios and comprehensively reveals the overall financial situation of the enterprise, providing a framework for forecasting future profitability [15].
ROE is a highly comprehensive and most representative financial ratio. The goal of enterprise management is to realize the maximization of shareholders’ equity. The ROE just reflects the profitability of the capital invested by shareholders, and can best represent the operation status of the enterprise in all aspects. DuPont analysis system diagram (Fig.1) decomposed ROE from various aspects to reflect the interrelationship between internal factors. Specific calculation is as follows:
ROE = Net profit/shareholders’ equity
= (Net profit/sales revenue) X (sales revenue/total assets) X (total assets/shareholders’ equity)
= Profit margin on sales X total assets turnover ratio X equity multiplier (1)
DuPont analysis is the basic analysis model of the financial situation of enterprises. It comprehensively evaluates the financial situation of enterprises from four aspects: profitability, solvency, operating ability and development ability. DuPont analysis decomposes ROE into the product of profit margin on sales, total assets turnover ratio and equity multiplier, so as to evaluate the profitability of the enterprise and the level of ROE of shareholders and make a deeper and more comprehensive analysis and comparison of the enterprise’s operating performance. Profit margin on sales is an indicator of corporate profitability. Total assets turnover ratio is an indicator to evaluate the operating ability of an enterprise, which can be used to analyze the efficiency of using all assets of an enterprise. The size of this ratio reflects the efficiency of using assets for operation. Equity multiplier is an indicator to evaluate the solvency of an enterprise. It is reciprocal to equity ratio, and the sum of equity ratio and total debt ratio is equal to 1. Therefore, the equity multiplier reflects the size of the financial leverage of an enterprise. Profitability, operating ability and solvency are the three main indicators in the analysis of financial ability. It is of great significance to evaluate the business performance of enterprises based on DuPont analysis.
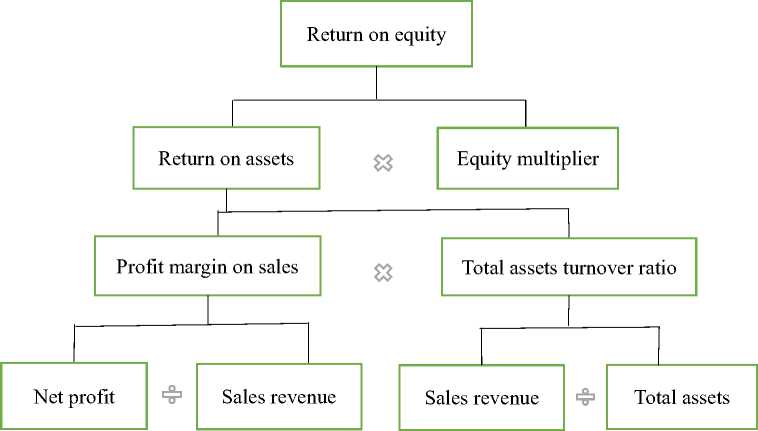
Fig. 1. DuPont Analysis System Diagram.
5. Application of DuPont Analysis in Financial Analysis of ICBC 5.1. Overview of ICBC
ICBC is one of China’s big four banks and a leading enterprise in the banking industry. Through continuous efforts and steady development, it has become one of the world’s leading banks. Relying on high-quality customer base, diversified business structure, strong innovation ability and market competitiveness, and consciously integrating social responsibility into development strategies and business management activities, it has been widely praised in supporting epidemic prevention and fighting, developing inclusive finance, supporting rural revitalization, developing green finance, supporting public welfare undertakings. In 2021, Forbes magazine released the “Forbes Global 2000 List”, China’s big four banks all ranked in the top 15, among which ICBC topped the list for nine consecutive years. In addition, ICBC has been ranked at the top of the top 500 Brand Finance Global Banks in the UK for six consecutive years, with great potential to become a world-class modern financial enterprise.
In order to better understand the current situation of ICBC in the industry, compare the ROE of ICBC with that of Agricultural Bank of China (ABC), Bank of China (BOC) and China Construction Bank (CCB) from 2018 to 2021, and the results are shown in Table 1 and Fig.2.
Table 1. Comparison of ROE of China’s Big Four Banks from 2018 to 2021
|
Year |
2018 |
2019 |
2020 |
2021 |
|
ICBC |
12.74% |
11.64% |
10.92% |
10.69% |
|
ABC |
12.10% |
10.86% |
9.79% |
9.99% |
|
BOC |
11.15% |
10.21% |
9.48% |
9.67% |
|
CCB |
12.84% |
12.05% |
11.45% |
11.63% |
Note. ROE is Calculated According to Net Profit/Shareholders’ Equity.
From Table 1 and Fig.2, it can be clearly seen that the ROE of ICBC from 2018 to 2021 showed a continuous downward trend, while the ROE of Agricultural Bank of China, Bank of China and China Construction Bank showed a downward trend from 2018 to 2020, and the ROE of 2021 was higher than that of last year. However, ICBC did not show a recovery trend. In the past four years, the ROE of China Construction Bank has been higher than that of the other three banks, and there is a trend of recovery, which shows that it has potential for development. The ROE of ICBC is second only to that of China Construction Bank, and both of them remain above 10%. Although the ROE of Agricultural Bank of China and Bank of China are lower than 10% in 2020 and 2021, there is a rising trend. In general, under the impact of the COVID-19, the business performance of China’s big four banks has been affected to a certain extent, but on the whole, it has been stable and has the ability to cope with certain risks.
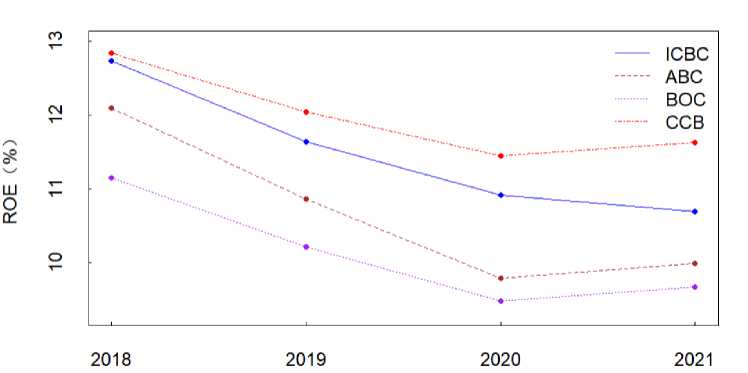
Fig. 2. Comparison of ROE of China’s Big Four Banks from 2018 to 2021.
-
5.2. Application of DuPont Analysis
In this paper, the ICBC as an example, using DuPont analysis to analyze its business conditions. According to Fig.1 and (1), data of total assets, shareholders’ equity, sales revenue and net profit of ICBC from 2018 to 2021 are collected, as shown in Table 2. It can be seen from Table 2 that by the end of 2021, ICBC’s total assets had reached 35 trillion yuan, and its total assets, shareholders’ equity, sales revenue and net profit had all increased year by year, indicating sound business development.
Table 2. Main Financial Data of ICBC from 2018 to 2021
|
Year |
2018 |
2019 |
2020 |
2021 |
|
Total Assets |
27699540 |
30109436 |
33345058 |
35171383 |
|
Shareholders’ Equity |
2344883 |
2692003 |
2909515 |
3275258 |
|
Sales Revenue |
773789 |
855164 |
882665 |
942762 |
|
Net Profit |
298723 |
313361 |
317685 |
350216 |
Note. Data from Shanghai Stock Exchange and in Millions.
Main financial indicators data are calculated according to (1), as shown in Table 3. In general, all indicators of ICBC showed a downward trend from 2018 to 2021, which may be due to the impact of the COVID-19, but on the whole, there was little fluctuation, showing stable anti-risk ability. The ROE declined year by year, but generally tended to be stable, showing stable profitability. The profit margin on sales showed a trend of first declining and then rising, which decreased by nearly 2 percentage points in 2019, indicating that it was greatly affected by the epidemic, and the profit margin on sales increased significantly in 2021. This may be because ICBC has developed business strategies to cope with the epidemic, and the sales situation has improved. The total assets turnover ratio is relatively stable and above 2%. This is because for the banking industry, there may be a lot of long-term loans and non-performing assets, resulting in slow capital turnover. Therefore, the total assets turnover ratio of the banking industry is generally low. The equity multiplier reflects the size of corporate financial leverage and has a positive correlation with total debt ratio. The banking industry mainly operates by absorbing deposits and providing loans and has a relatively high total debt ratio, so the equity multiplier is relatively high.
Table 3. Main Financial Indicators Data of ICBC from 2018 to 2021
|
Year |
2018 |
2019 |
2020 |
2021 |
|
ROE |
12.74% |
11.64% |
10.92% |
10.69% |
|
Profit Margin on Sales |
38.61% |
36.64% |
35.99% |
37.15% |
|
Total Assets Turnover Ratio |
2.79% |
2.84% |
2.65% |
2.68% |
|
Equity Multiplier |
11.81 |
11.18 |
11.46 |
10.74 |
|
Total Debt Ratio |
91.53% |
91.06% |
91.27% |
90.69% |
Note. The Data is Calculated from Table 2.
From Table 3, we can only see the overall change range of ROE, but we can’t see the effect of changes in various factors on the change of ROE. Next, we will use the Chain substitution method to analyze the driving factors of the ROE, so that we can more clearly find the reasons for the fluctuation of the ROE and measure the correlation of each factor, so as to clarify the direction of subsequent analysis.
The Chain substitution method is used to analyze the effect of various factors on an indicator when multiple factors jointly affect the indicator [16]. The application principle is to assume that the relationship model between this indicator and its influencing factors is
P = A x B x C ,
then the base period indicator p , the current period indicator p , and the difference between them A P are respectively as follows:
P o = A x B o x C o ,
P = A x Bx x C ,
A P = P - P o .
Chain substitution analysis: The indicator P is affected byA ,B andC at the same time, and their respective effect on P are successively replaced from left to right, to replace A :
Pa = A x B0 x C 0 ,
to replace B :
P b = A x B 1 x C 0 ,
to replace C :
P c = A 1 x B1 x C1 = P .
Effect of changes in factor A :
A A = P a - P 0 ,
effect of changes in factor B :
A B = P - P a ,
effect of changes in factor C :
A C = P c - P b ,
Here
A P = AA + AB + A C .
Equations (3) to (12) are used to calculate the effect of changes in profit margin on sales, total assets turnover ratio and equity multiplier on ROE in 2019 compared with 2018, 2020 compared with 2019, and 2021 compared with 2020, respectively. The results are shown in Table 4.
In terms of years, the ROE decreased by 1.1 percentage points in 2019, in which the change of profit margin on sales and equity multiplier reduced the ROE by 0.67 and 0.66 percentage points respectively, which determined the ROE to the maximum extent. The change of total assets turnover ratio increased the ROE by 0.22 percentage points, which had little impact on the ROE. The profitability and solvency were not as good as last year. Operation ability has been improved. The ROE decreased by 0.72 percentage points in 2020. The decline in profit margin on sales and total assets turnover ratio was the main reason for the decline in ROE compared with 2019. The profitability and operation ability decreased, while the solvency improved. The ROE decreased by 0.23 percentage points in 2021, and the decline of the equity multiplier was the main reason for the decline of the ROE compared with 2020. Although the profit margin on sales and the total assets turnover ratio both improved, the sharp decline of the equity multiplier still led to the decline of the ROE. The decline in the financial leverage ratio reflects the decline in the ability to use deposits to conduct business activities.
From the perspective of the effect of changes in single factors, the effect of changes in profit margin on sales is decreasing year by year, turning from negative to positive, indicating that the sales ability of banks is steadily improving. The effect of changes in total assets turnover ratio showed a positive promoting effect except 2020. The sharp decline in the equity multiplier in 2019 and 2021 was the main reason for the decline in ROE, which as a whole dampened ROE growth.
Table 4. Changes in Influencing Factors of ROE of ICBC
|
Changes in Various Influencing Factors |
2019 Compared with 2018 |
2020 Compared with 2019 |
2021 Compared with 2020 |
|
Profit Margin on Sales |
-0.67% |
-0.21% |
0.36% |
|
Total Assets Turnover Ratio |
0.22% |
-0.77% |
0.13% |
|
Equity Multiplier |
-0.66% |
0.26% |
-0.72% |
|
Total Change |
-1.10% |
-0.72% |
-0.23% |
Note. The Data is Calculated from Table 3.
6. Conclusion
This paper first introduces DuPont analysis, and applies DuPont analysis to decompose the ROE of ICBC into profit margin on sales, total assets turnover ratio, equity multiplier. Then analyzes the effect of the changes of these three factors on the ROE respectively by using the Chain substitution method. According to the results obtained, the following suggestions are put forward for the development of ICBC.
Profit margin on sales reflects the relationship between net profit and sales revenue. Generally speaking, when sales revenue increases, net profit will also increase. However, in order to improve the profit margin on sales, it is necessary to increase sales revenue and reduce costs, so that the growth of net profit is higher than that of sales revenue. On the one hand, it is necessary to develop new products in the fierce competition environment to improve the market share. On the other hand, it is necessary to control the cost, ensure the quality and reduce the cost, such as administrative expenses, selling expenses and other period expenses.
Total assets turnover ratio reflects the ability to operate with assets. If the turnover of assets is slow, it will occupy a large amount of capital and increase the cost of capital. In order to improve the total assets turnover ratio, it is necessary to increase sales revenue or dispose assets. For the banking industry, there may be many long-term loans and non-performing assets, resulting in slow capital turnover. Therefore, banks should deal with lending business prudently, understand the economic strength of customers, and reduce the risk of assets turning into bad debts.
Equity multiplier reflects the size of financial leverage. Given the particularity of the banking industry, it is more necessary to make rational use of financial leverage. ICBC’s equity multiplier and total debt ratio show a downward trend on the whole, and its ability to operate with creditor capital is weakened. In fact, within the limits, the larger the equity multiplier of the bank, the better, which also shows the bank’s confidence in development.
At present, there are various methods of bank performance evaluation, and different methods have different emphasis on evaluating enterprise performance, so it is necessary to choose appropriate methods according to the characteristics of the enterprise. The DuPont analysis adopted in this paper takes the ROE as the core, which reflects the profitability, solvency, operating ability and development ability of the enterprise, and can comprehensively evaluate the internal relationship of the enterprise. In the future research, we can also try to use other methods to evaluate the performance of ICBC, and then compare the evaluation results, so as to explore the most suitable performance evaluation mode for ICBC.
References Performance Evaluation of Industrial and Commercial bank of China based on DuPont Analysis
- L. Li, “Analysis of Influencing Factors about Enterprise Financial Performance”, Journal of Hubei Industrial Polytechnic. (2014), 27(6), 60-62.
- Y. Shu and G. Xu, “Multi-level Dynamic Fuzzy Evaluation and BP Neural Network Method for Performance Evaluation of Chinese Private Enterprises”, Wireless Personal Communications. (2018), 102, 2715-2726.
- A. Trujillo-Ponce, “What Determines the Profitability of Banks? Evidence from Spain”, Accounting and Finance. (2013), 53, 561-586.
- X. Liu, J. Sun, F. Yang and J. Wu, “How Ownership Structure Affects Bank Deposits and Loan Efficiencies: An Empirical Analysis of Chinese Commercial Banks”, Annals of Operations Research. (2020), 290, 983-1008.
- E. Amir, B. Lev, “Value-relevance of Non-financial Information: The Wireless Communications Industry”, Journal of Accounting and Economics. (1996), 22, 3-30.
- A. N. Berger and E. B. D. Patti, “Capital Structure and Firm Performance: A New Approach to Testing Agency Theory and an Application to the Banking Industry”, Journal of Banking & Finance. (2006), 30(4), 1065-1102.
- G. Zhao, “Research on the Profitability of Sanitation Enterprises in China: Based on DuPont Analysis”, Environmental Sanitation Engineering. (2022), 30(4), 96-100.
- J. Liu and J. Wang, “Analysis of the Application of DuPont Analysis Method in the Performance Management of Huamao Company”, Management & Technology of SME. (2021), (3), 10-11.
- Z. Ren, Z. Zhou and C. Chun, “Analysis of Financial Situation of Logistics Enterprises Based on DuPont Analysis —Taking Yuantong Express as an Example”, Logistics Engineering and Management. (2021), 43(10), 130-132.
- C. Liu, “Comprehensive Financial Analysis Based on Four Competences and DuPont Analysis: Take Evergrande Group as an Example”, Value Engineering. (2022), 41(5), 16-18.
- K. Wang, J. Qu and H. Guo, “Study on Public Hospital Warning Model of Financial Risk Based on Wall Scoring”, Chinese Hospital Management. (2014), 34(12), 46-47.
- X. Song, W. Yin, R. Zhang and G. Xiang, “Application of EVA in Netease Company Performance Evaluation”, Value Engineering. (2021), 40(24), 166-168.
- J. Zhou, “The Application of Balanced Scorecards in Libraries”, Library and Information Service. (2004), 48(6), 98-101.
- S.A. Darestani and N.H. Shamami, “Performance Evaluation of Lean Production Based on Balanced Score Card Method Using ANP and SIR: A Case from Iranian Home Appliance Industry”, Opsearch. (2019), 56, 717-738.
- A. Curtis, Lewis-Western, F. M and S. Toynbee, “Historical Cost Measurement and the Use of DuPont Analysis by Market Participants”, Rev Account Stud. (2015), 20, 1210-1245.
- X. Yang, Q. He and E. Liu, “Evaluation of Soil Erosion and Its Influencing Factors in the Source of the Three Rivers Region Based on Continuous Replacement Method”, Hubei Agricultural Sciences. (2019), 58(12), 69-73.
