Performance Evaluation of MANET in Realistic Environment

Author: Shailender Gupta, Chirag Kumar, C. K. Nagpal, Bharat Bhushan
Journal: International Journal of Modern Education and Computer Science (IJMECS) @ijmecs
Article in issue: 7 vol.4, 2012.
Free access
In order to facilitate communication in Mobile Ad hoc Network (MANET), routing protocols are developed. The performance of these protocols depends upon various factors such as: transmission range, number of nodes deployed and mobility of the nodes. Another factor which affects the performance of MANET routing protocols is the environment in which ad hoc network is deployed. The MANET environment may contain obstacles such as mountains lakes, buildings and river. These obstacles restrict nodes movement but may or may not obstruct the effective transmission range of nodes deployed. This paper is an effort to evaluate the performance of MANET routing protocols in presence of obstacles by designing a simulator in MATLAB-10. To make the situation more realistic obstacle of different shapes, size, number and type were introduced in the simulation region. We found significant impact of the same on the performance of routing protocols.
Adhoc, Routing Protocols, Obstacles
Short address: https://sciup.org/15014470
IDR: 15014470
Text of the scientific article Performance Evaluation of MANET in Realistic Environment
Published Online July 2012 in MECS DOI: 10.5815/ijmecs.2012.07.08
Mobile Ad-hoc Network [1-4] is generally established in areas where infrastructural facilities such as base station, routers etc. do not exist or have been destroyed due to natural calamity. Each node in MANET [5-6] has limited battery power, bandwidth and transmission range for performing network operations. Being a decentralized network and due to low transmission range of nodes, the routing burden has to be shared by all the participating nodes of the network. Keeping this aspect in view various routing protocols have been developed. The main aim of these routing protocols [7-8] is to provide a reliable and efficient path from source to destination node. The performance of these protocols depends upon various factors as follows:
Transmission Range: The transmission range when too high helps in having high reachabilty value but at the same time results in over consumption of battery power, as depletion of battery power is directly proportional to transmission range [9-14]. On the other hand when transmission range is low, it results in lower value of reachable paths, which is not a desirable feature in MANET.
Number of nodes: The number of nodes when too low results in lower reachability value. On the other hand when the number of nodes deployed is too results in unnecessary wastage of resources [9].
Mobility: The performance [15-18, 22] of routing protocols of MANET is significantly reduced when the nodes speed is too high i.e. as the nodes speed increases the number of link failures increase resulting in lower values of packet delivery ratio.
Another factor which affects the MANET performance is the environment in which the nodes are deployed. The environment [19-25] in which MANET may contain unpredictable obstacles, such as mountains, lakes, buildings, or regions without any hosts, impeding or blocking message relay. The obstacle restricts not only the nodes movement but may obstruct the effective transmission paths between nodes.
In this paper, we wish to create more realistic environment by incorporating obstacles in between the simulation region. The purpose of our research is to find and analyze the impact of obstacles on routing protocol performance. To find the same obstacle of different shapes such as circular, elliptical and rectangular shapes were introduced in the simulation region. In addition to it we also varied the size and number of obstacles. To achieve the goals mentioned above, a simulator was designed in MATLAB. The simulator distributes nodes randomly in the simulation region. After it the simulator chooses every pair of source and destinations and uses shortest path route from source to destination in presence of obstacle.
The remainder of the paper is organized as follows. Section 2 gives details of problem definition and related research in the area of obstacles. Section 3 gives detail algorithm of simulation process. Section 4 provides the impact and analysis of impact of shape, size, type and number of obstacles on routing protocol performance. Section 5 presents the conclusion followed by references.
-
II. Literature Survey and problem defination
The literature contains few papers that discuss the impact of obstacles as follows:
They further extended their work on signal attenuation due to obstacles and found that the signal quality deteriorates after the signal passes through an obstacle [23].
Another research on realistic simulation region was performed by Chih Yung Chang et al [24]. Due to the presence of obstacles, such as mountains, lakes, buildings, or regions without any hosts in the region where MANET is deployed, will result in impeding or blocking of message relay. The problem was removed by the use of obstacle free single destination geocasting protocol.
Recent research by Chirag Kumar et al [25] in which they calculated the affect in the value of the Probability of Reachability (POR) as the simulation region is changed from obstacle free region to the region having obstacles. There was significant decrease in the value of POR which approximately 50 percent to the value of POR for obstacle free region.
The work done in this field as stated by above researches is carried out for fixed rectangular shaped region of obstacles. More over the above research consider that obstacle always restrict transmission path between nodes which may not be true always. As an example consider the case of mountain and lake the mountain will certainly obstruct transmission path between nodes but the same is not true for obstacle like lake. This work is an effort to analyze the impact of number, shape, size and type of obstacles on routing protocols performance.
-
III. Simulation Process
This section provides the detailed description about the performance metric used, algorithm for the calculation of the same and over all simulation parameters.
-
A. Performance Metric Used
The performance evaluation of the routing protocol is achieved by calculating the value of Rechability. It is defined as the fraction of reachable routes to the total number of routes from each source to destination.
Mathematically,
R eachab le Rou tes Reachability = —------------—----Total 'number of Routes for N number of nodes the total number of routes can be calculated as
(NX
Total number of Routes = \
-
B. Algorithm for the calculation of Performance Metric
To calculate the value of rechability, path is searched by taking each node as source and rest as destination. For each source destination pair the process is repeated for given number of iterations. Each time when a path is formed between a source and destination, the value of reachability is incremented as shown in figure 1. For the average value, the value of rechability is divided by the total number of path that can exist for given number of nodes and iterations.
Reachability (M, N, TR, I)
Reach = 0
for S = (1: N-l)
{ for(D = S+l:N)
^Тй1е(К<1)
If (Path = 7?ме)
Reach =Reach *1;
}
}
Avg_Reach =2*Reach f(N)(N-l)*I}
Figure 1. Algorithm for calculation of performance metric
Where N is the number of nodes, TR is the transmission range, M is the mobility model used and I is the number of iteration. It was set to 25 in our experiment.
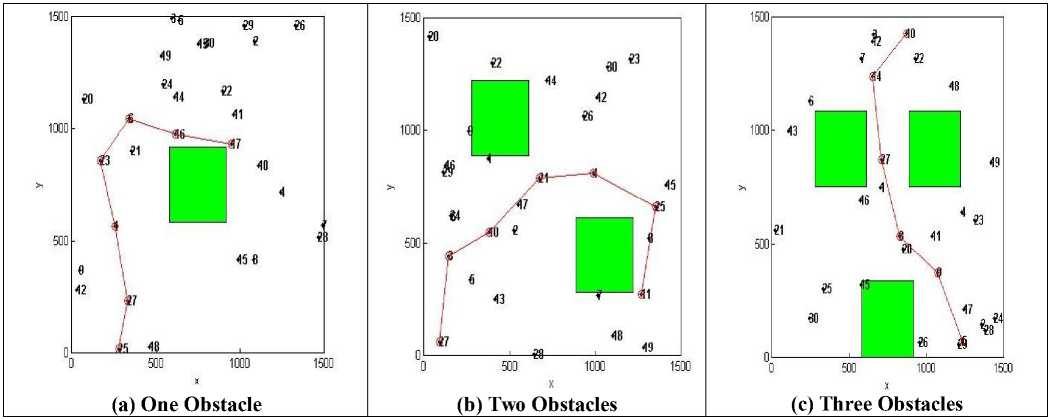
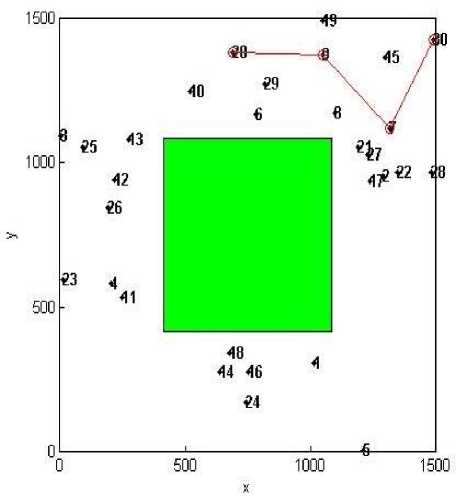
Figure 2. Snapshot of Simulator for Number of Obstacles.
-
C. Overall Simulation Parameters
Table I show the various parameters used in simulation process.
TABLE I. O verall S imulation S etup P arameters
|
Parameter |
Value |
|
Number of Nodes |
30 |
|
Transmission Range |
300-450 |
|
Mobility Model Used |
Random Way Point (RWP) |
|
Routing Algorithm Used |
Dijkstra’s Shortest Path Algorithm |
|
Routing Strategy Used |
Minimum Hop Routing |
|
Size of Simulation Region |
2250000 Sq. Units |
|
Shape of Simulation Region |
Square |
|
Placement of Nodes |
Random |
-
IV. Results and Analysis
-
A. Impact and analysis of number of Obstacles on the Reachability
To find the impact of obstacles, the number of obstacles were varied. Table II shows additional parameters required to achieve the same.
Figure 2 shows the snapshot of the simulation process. The path shown by red color is the path formed by minimum hop routing. The green colored squared shape boxes represent the obstacles in the simulation area.
Inference: Figure shows the impact of the number of obstacles on the rechability. Following inference can be made:
-
• As the transmission range increases from 300 to 450 the value of rechability increases as the higher transmission range will result in higher connectivity.
-
• There is significant impact of obstacles on the connectivity between the communicating nodes there by affecting the rechability.
-
• As the number of obstacles increases the value of rechability goes on decreasing.
TABLE II. A dditional P arameters
|
Parameter |
Value |
|
Size of Obstacle |
112500 Sq. Units |
|
Shape of Obstacle |
Square (l= 474.342) |
|
Number of Obstacles |
1-3 |
Impact of Number of Obstacles
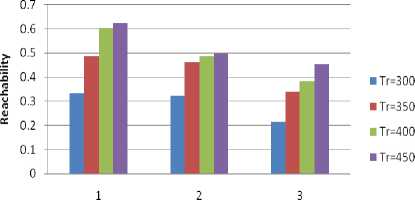
Number of Obstacles
Figure 3. Impact of Number of Obstacles.
Analysis: The number of obstacles has significant impact on the rechability. As the number of obstacles increases the value of rechability goes on decreasing. This is due to the fact with every increase in the number of obstacle the effective transmission range of node reduces hence the node has to longer paths to reach to the destination that may not be reliable in comparison to path having smaller hop count value.
-
B. Impact and Analysis of Shape of Obstacle
In the real world the shape of obstacle can be can be of any type. It may be square, circle, rectangle, elliptical or any irregular shape. To find the impact of the same, various shapes taken in to consideration are circular, elliptical, square and rectangular.
Figure 4 shows the snapshot of the simulation process. The additional details regarding the shape of obstacle are provided in Table III. Minimum Hop Routing strategy is used to find the path between the source and destination. The path formed is displayed by red color.
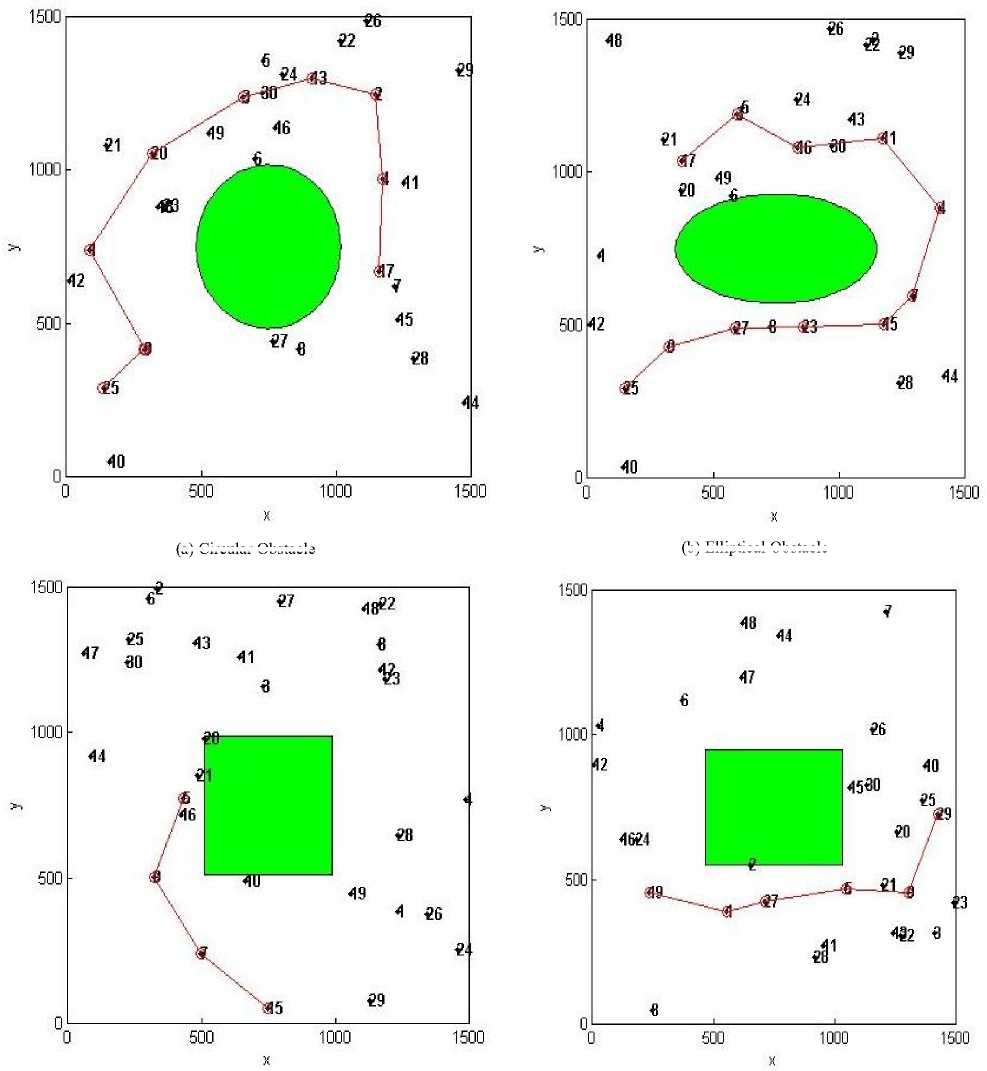
(b) Elliptical Obstacle
Circular Obstacle
(c) Square Obstacle
(d) Rectangular Obstacle
f igure 4. s napshot of s imulator for s hape of o bstacles .
Inference: Figure 5 shows the impact of the shape of obstacle on the rechability. Following inference can be made:
-
• With increase in the transmission range the value of reachability increases significantly.
-
• The shape of the obstacle also has significant effect on the reachability.
-
• For the circular obstacle the reachability has highest value followed by the square, ellipse and rectangular.
TABLE III. A dditional P arameters
|
Paramter |
Value |
|
Size of Obstacle |
225000 Sq. Units |
|
Shape of Obstacle |
|
Analysis: The shape of obstacle has significant impact on reachability. The impact is due to the perimeter effect. For the shapes (circle, ellipse, square and rectangle) the circular shape has least perimeter followed by square, ellipse and rectangle.
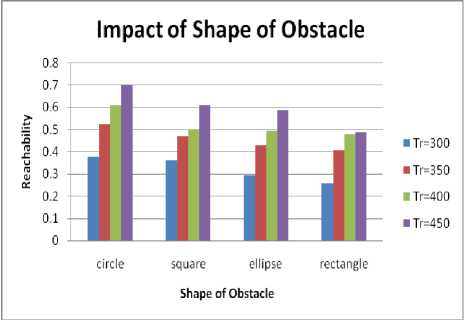
Figure 5. Impact of Shape of Obstacle.
-
C. Impact and analysis of the Size of Obstacle
To find the impact of the size of obstacle the size is varied as per Table IV. The shape of the obstacle is taken to be square. Figure 6 shows the snapshot of the simulation process. Minimum Hop Routing strategy is used to find the path between the source and destination. The path formed is displayed by red color.
Inference: The impact of the size of obstacle is shown by figure 7. Following inference can be made:
-
• With increase in the transmission range the value of reachability increases significantly.
-
• The size of the obstacle also has significant effect on the reachability.
-
• For the obstacle having size 5 percent of the total simulation area have highest value of rechability followed by 10, 15 and 20 percent.
TABLE IV.
A dditional P arameters
|
Paramter |
Value |
|
Type of Obstacle |
Mountain Type |
|
Shape of Obstacle |
Square |
|
Size of Obstacle |
• L1=335.41 • L2=474.342 • L3=580.948 • L4=670.82 |
Analysis: The Size of obstacles shows the inverse relationship with the reachability. As the size of the obstacle increases the value of rechability goes on decreasing. This is due to the decrease in the effective transmission range of nodes.
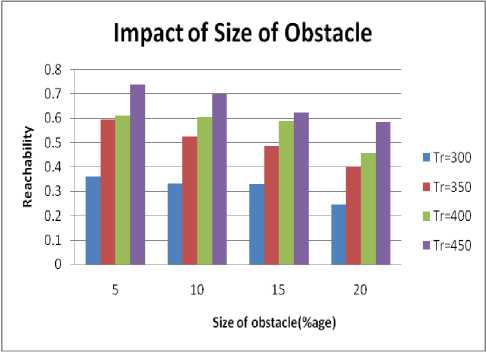
Figure 7. Impact of Size of Obstacle.
-
D. Impact and Analysis of Type of Obstacle
As in real world the obstacles can be of many types like mountain, river or lake. These obstacles affect the performance of routing protocol in different ways. In case of mountain the obstacle not only affects the node movement but also the effective transmission between the nodes. The river or lakes affect the node movement not the transmission between the nodes. Figure 8 shows the snapshots for such obstacles. The size of obstacle is taken 22500 sq. units. In case of mountains there will be no communication between the nodes on either side of mountain but in case of river or lake there will be path or communication is possible between the nodes.
Inference: Figure 9 shows the impact of type of obstacle on the performance of MANET routing protocol. Following inference can be made:
-
• With increase in value of transmission range the value of reachability also increases.
-
• In case of river or lake there is very less influence on the value of reachability. With increase in the value of transmission range the reachability approximates to almost 100 percent.
-
• The mountain affects the value of reachability to a great extent as it affects the communication also.
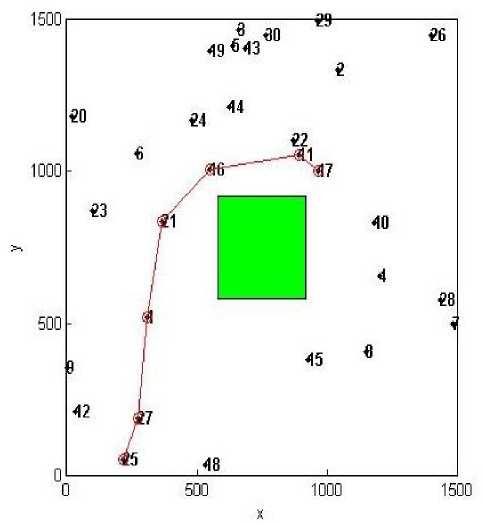
(a) 5 Percent
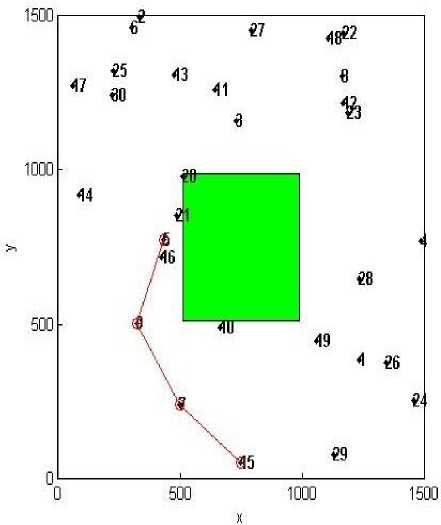
(b) 10 Percent
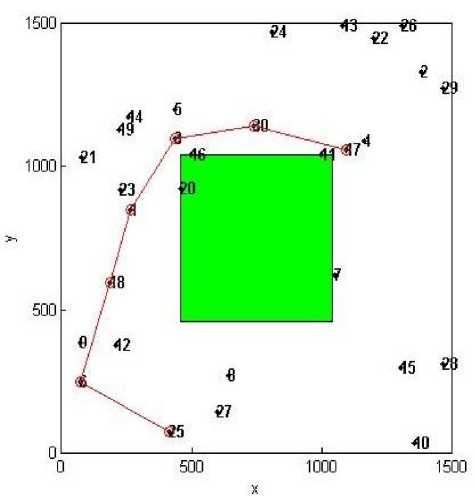
(c) 15 Percent
Figure 6. Snapshot of Simulator for Size of Obstacles
(d) 20 Percent
Analysis: The obstacles like river or lake affects the node movement only but does not reduce the effective transmission range of nodes hence rechability is not affected much. On the other hand the obstacle such as mountains restricts both node movement and effective transmission paths between nodes that’s why its reachability value is quite low in comparison to obstacles like lake and river.
-
V. Conclusion
Following conclusion can be made illustrating the number, shape, size and type of obstacle:
-
• The value of reachability increases with increase in value of transmission range.
-
• With increase in number of obstacles the value of reachability decreases.
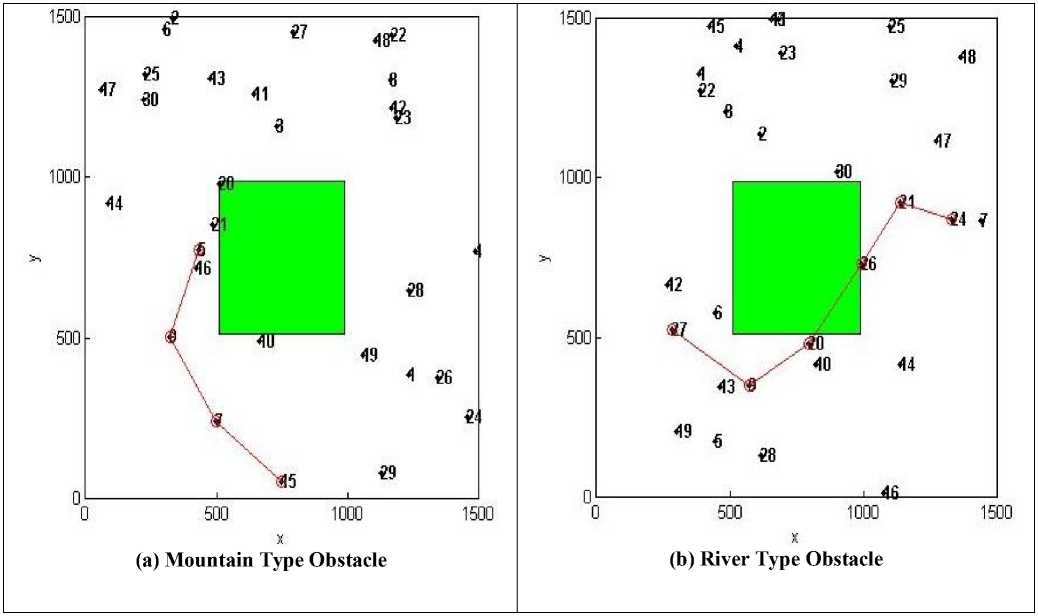
Figure 8. Snapshot of Simulator for Type of Obstacles.
-
• The circular shape of obstacle has the least affect on the rechability followed by square, ellipse and rectangle.
-
• With increase in size of obstacle there is
decrease in value of reachability.
-
• The obstacles like mountain affect the
reachability to quite a great extent in comparison to the obstacles like river or lake.
Impact of Type of Obstacle
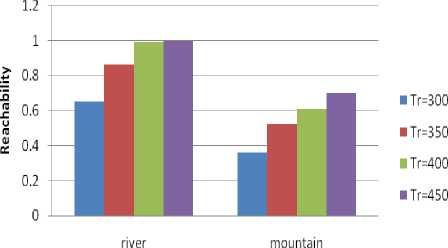
Type of Obstacle
Figure 9. Impact of Type of obstacles.
References Performance Evaluation of MANET in Realistic Environment
- J. E. Wieselthier, E. Altman, A. Ephremides, J. P. Macker, H. B. Russell, M. Steenstrup, and S. B. Wicker," Wireless ad hoc networks – part II", IEEE Journal on SAC , Volume 23, Number 3, March 2005.
- Hany Samuel,Weihua Zhuang,Bruno Preiss,"DTN Based Dominating Set Routing for MANET in Heterogeneous Wireless Networking", Journal Mobile Networks and Applications Volume 14 Issue 2, April 2009 Pages 154 - 164.
- Charles E. Perkins, “Mobile Ad-Hoc Networks,” Addison-Wesley(2000).
- Giorgos Papastergiou, Ioannis Psaras , Vassilis Tsaoussidis," Deep-Space Transport Protocol: A Novel Transport Scheme for Space DTNs", Computer Communications Volume 32, Issue 16, 15 October 2009, Pages 1757–1767 , Elsevier.
- J. Mackar and S. Corson, RFC 2501, “Mobile Ad hoc Networking (MANET): Routing Protocol Performance Issues and Evaluation Considerations”, IETF 1999.
- Chim Yuen Chong, Raymond Seah Kwang Wee, Sim Soon Lian, Tan Jia Hui,“Moblie Ad hoc Networking”,http://www.dsta.gov.sg/DSTA_horizons/2006/Chapter_7. Htm.
- Laura Marie Feeney. A taxonomy for routing protocols in mobile ad hoc networks. Technical report, Swedish Institute of Computer Science, Sweden, 1999.
- http://www.telenor.com/rd/pub/rep03/R_41_2003.pdf
- Francois Ingelrest, David Simpol- Ryl, and Ivan Stojjmenovic, “ Optimal Transmission Radius for Energy Effiecinet Broadingcasting Protocol in Ad-hoc and Sensor Networks” IEEE Transactions on parallel and distributed systems, Vol. 17, No. 6, June 2006.
- F.J. Ovalle-Martinez, I.Stojmenovic, F. Gracia-Nocetti and J. Solano-Gonzalez (2005) “ Finding minimum transmission radii for preserving connectivity and constructing spanning trees in ad-hoc sensor networks”, Journal of Parallel and Disributed Computing, pp. 132-141.
- C.K Nagpal, Maninder Kaur ,Shailender Gupta and Bharat Bhushan,"IMPACT OF VARIABLE TRANSMISSION RANGE ON MANET PERFORMANCE",International Journal of Ad hoc, Sensor & Ubiquitous Computing (IJASUC) Vol.2, No.4, December 2011.
- Chander Kumar, Shailender Gupta and Bharat Bhushan,"IMPACT OF VARIOUS FACTORS ON PROBABILITY OF REACHABILITY IN MANET: A SURVEY",International journal on applications of graph theory in wireless ad hoc networks and sensor networks (GRAPH-HOC) Vol.3, No.3, September 2011.
- Doina Bein , Ajoy K. Datta, Prathima Sajja, and S.Q. Zheng, (2009) “Impact of Variable Transmission Range in All-Wireless Networks” Proceedings of the 42nd Hawaii International Conference on System Sciences.
- Jang-Ping Shew, Kun-Ying Hsieh and Yao-Kun Cheng, (2009) “Distributed transmission power control algorithm for wireless sensor networks” journal of Information Science and Engineering25,1447-1463.
- Tracy Camp, Jeff Boleng, Vanessa Davies,” A Survey of Mobility Models for Ad Hoc Network Research” , Wireless Communication & Mobile Computing (WCMC): Special issue on Mobile Ad Hoc Networking:Research, Trends and Applications, vol. 2, no. 5, pp. 483-502, 2002.
- Bhavyesh Divecha, Ajith Abraham, Crina Grosan and Sugata Sanyal,"Impact of node mobility on MANET routing protocols models" ,Journal of Digital Information Management, Feb 1 2007.
- Nicholas Cooper and Natarajan Meghanathan,"Impact of Mobility Models in Multi-Path Routing in Mobile Ad Hoc Networks",International Journal Of Computer Networks & Communications (IJCNC), Vol. 2, No.1, January 2010.
- Santosh Kumar, S C Sharma Bhupendra Suman,"Classification and Evaluation of Mobility Metrics for Mobility Model Movement Patterns in Mobile Ad-Hoc Networks",International journal on applications of graph theory in wireless ad hoc and sensor networks (GRAPH-HOC) Vol.3, No.3, September 2011.
- Michael Feeley, Norman Hutchinson, and Suprio Ray,"Realistic Mobility for Mobile Ad Hoc Network Simulation",I. Nikolaidis et al. (Eds.): ADHOC-NOW 2004, LNCS 3158, pp. 324–329, 2004.
- P. Venkateswaran, Rahul Ghosh, Aritra Das, S.K. Sanyal, R. Nandi,"An Obstacle Based Realistic Ad-Hoc Mobility Model for Social Networks",JOURNAL OF NETWORKS, VOL. 1, NO. 2, JUNE 2006.
- Cedric Gael AboueNze, Frederic Guinand and Yoann Pign,"Impact of Obstacles on the Degree of Mobile Ad Hoc Connection Graphs",arXiv:0911.0141v1 [cs.NI] 1 Nov 2009.
- Amit Jardosh, Elizabeth M. BeldingRoyer, Kevin C. Almeroth, Subhash Suri,"Towards Realistic Mobility Models For Mobile Ad hoc Networks",MobiCom’03, September 14–19, 2003, San Diego, California, USA.
- Amit Jardosh, E. M. Belding-Royer, K. C. Almeroth, and S. Suri, "Real world Environment Models for Mobile Ad hoc Networks," IEEE Journal on Special Areas in Communications - Special Issue on Wireless Ad hoc Networks, vol. 23, pp. 622-632, 2005.
- Chih-Yung Chang, Chao-Tsun Chang, Shin-Chih Tu,"Obstacle-Free Geocasting Protocols for Single/Multi-Destination Short Message Services in Ad Hoc Networks",Wireless Networks 9, 143–155, 2003.
- Chirag Kumar, C.K. Nagpal, Bharat Bhushan, Shailender Gupta,"Reachability Analysis of Mobility Models under Idealistic and Realistic Environments", published in prceedings by springer,wimoa-2012,page no. 519.
