Performance Improvement by Pre-Amplifying with Erbium, Ytterbium Doped Devices Link Extenders of Fiber to the Home

Author: Bentahar Attaouia, Kandouci Malika
Journal: International Journal of Information Engineering and Electronic Business(IJIEEB) @ijieeb
Article in issue: 4 vol.8, 2016.
Free access
This paper analyzes the performance of hybrid gigabit passive optical network (GPON) and wireless communication (FSO) system using EDFA and EYDWA as pre-amplification configuration to compensate the losses due to the fiber cable and the free space channel for 2.5 Gb/s of data. The performance for both amplifiers has been compared on the basis of distance, FSO range and number of users, however the results of simulation show enhancement offered by EYDWA as compared as EDFA amplifier. This amplifier was able to reach transmission distance over 245 Km optical fiber and 1Km range FSO with best BER value around 10-9 and good eye diagram. Whereas, the fiber distance has been limited to 64 Km by using EDFA amplifier.
EDFA amplifier, EYDWA pre-amplifier, GPON, wireless communication, gain, noise figure, quality factor
Short address: https://sciup.org/15013429
IDR: 15013429
Text of the scientific article Performance Improvement by Pre-Amplifying with Erbium, Ytterbium Doped Devices Link Extenders of Fiber to the Home
Published Online July 2016 in MECS
Fiber-to-the-Home “FTTH” is defined as a communications architecture in which the final connection to the subscriber’s premises is optical fiber. FTTH deploiements are mostly based on Passive Optical Network (PON) technology. This architecture for FTTH deployments are characterized by passive optical splitters to distribute the fiber to each customer using splitting ratios ranging up to 1:64 or even 1:128 .
Recently standardization bodies (IEEE, FSAN) have specified normalization for PONs for FTTH that permits a splitting ratio up to 32 in the case of EPON and up to 64 users for Gigabit Passive Optical Network (GPON). This is mainly limited: on the one hand, by the bandwidth sharing level, on the other hand, by the splitter loss [1].
A gigabit optical network (GPON) is a promising solution to the increasing needs of higher bandwidth requirement for FTTH technology deployment in various parts of the world [2]. Furthermore, GPON/FTTH course will provide in-depth knowledge of the principles and applications of gigabit passive optical networking as well as fiber to the home application. The principal of GPON is to connect a single optical fiber from an optical line terminal (OLT) to multiple optical network units (ONUs) using time division multiple access (TDMA), this later allows users to share bandwidth according to the time slots allotted to them [3].
While installation of fiber optic cable might be suitable for some area, there are parts of the city and suburban that requires wireless connectivity due to network mobility need and different geographical area. Transmitting optical signal wirelessly, can further reduce substantial amount of fiber installation cost has been accomplished through the transmission of information which is loaded with optical radiation from a transmitter to a receiver, separated by the atmosphere [4].
Advances in fiber optic and free space links have shown promise for optical links to provide data rates in excess of a gigabit per second [5], however free Space Optical communication has the potential to provide high rate and has been successfully applied for short-distance links in difficult locations. The basic architecture of FSO consists of two transceivers and a transmission medium, which is air itself. Lasers and photo detectors are used as the transmitter and receiver, respectively.
The splitting ratio of GPON has been recently intensified beyond 128 and the physical reach has been increased significantly to longer than 60 km [6]. The requirement needs large link power budget and gives rise to the use of optical line amplifiers in conventional PON systems. Several methods that use optical amplifiers in these PON systems have been suggested by using erbium-doped fiber amplifiers (EDFA), erbium doped waveguide amplifier (EDWA) and erbium ytterbium doped waveguide amplifier (EYDWA) [7]. These later which have received great attention during the last few years in optical telecommunications, present an attractive solution for the compensation of the loss introduced by passive components. [8, 9]
-
II. Optical Amplifier
In the 1990's, optical amplifiers, which directly amplified the transmission signal, became widespread minimizing system intricacies and cost [10]. Today, great effort is devoted to the study of erbium-doped waveguide amplifier (EDWA). The main purpose of these devices is to retain as much as possible the advantages of the EDFA while reducing its dimensions in order to obtain an integratable amplifier. Its principle of operation is similar to that of EDFA, but the fiber is replaced with an optical rectangular waveguide [11].
The main disadvantage with respect to EDFA is that up-conversion clue to a significantly higher erbium concentration degrades the performance of the amplifier. Since the strength of the ion-ion interactions increases when the ions are closer, an increase in the erbium ion concentration causes an increase in up-conversion which significantly reduces the efficiency of the amplifier.
When the concentration levels are such that the separation between two erbium ions is greater than the diameter of an individual erbium ion then the up conversion process is called “homogeneous up conversion (HUC)”. But with the increase in the concentration the inter-ionic distance between two erbium ions becomes less and they come much closer to each other so as to form “clusters” and most commonly form “pairs” [12-14]. This issue has been addressed by co-doping the erbium by ytterbium (Yb). The presence of this later reduces the formation of erbium clusters and reduces the up-conversion rate from the upper level of erbium (4I13/2 level) significantly.
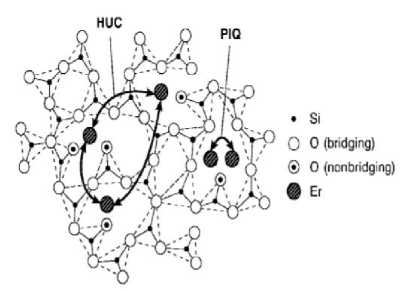
Fig.1. Two dimensional schematic representations of HUC and PIQ.
1.55 pm
Stimulated Emission
Pumping 0.8-1.1 мт
4liM
Yb3*
Er3*
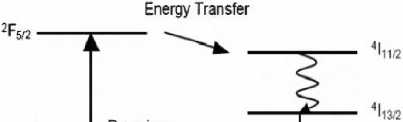
Fig.2. Energy level diagram of Er and Yb system.
-
III. Simulation Setup
The principle objective of this paper is to designs a wireless hybrid GPON system based on pre-amplification which can be implemented with a splitting ratio of 64 and 20 dB of loss at a signal input of 10 dBm. Figure 3 depicts the configuration of the downstream system performance, the optical line terminal (OLT) consists of DFB laser which transmits 2.5 Gb/s of bit rates at 1550 nm wavelength and over 250 Km fiber length. Then the signal was split before transmitted through 1 Km FSO range receiver which was individually equipped with an optical network unit (ONU). On the receivers side, the avalanche photodiode (APD) is used followed by a low pass filter and a 3R regenerator, a quality factor and eye patterns are used as evaluation criteria.
To compensate for losses due to the optical fiber, a preamplifier placed prior to the receiver in order to increase the sensitivity and the signal level. In this work we used two types of amplifiers (EDFA and EYDWA). The EYDWA utilized has an erbium and ytterbium ions concentrations of 1 x 10 +27 / m-3 and 5.14 x 10 +26 / m-3, respectively and a 30 cm of long, whereas an erbium concentration of 1x10+25 /m-3 and a 10 m of fiber length for EDFA amplifier. For both amplifiers pump power is 200 mW with 980 nm of wavelength.
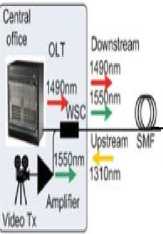
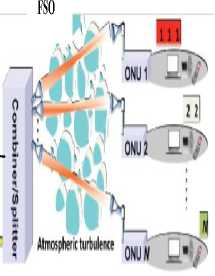
Fig e of
GPON-FSO
-
IV. Resluts and Discussion
-
A. EDFA and EYDWA Characteristics:
In this section, we first present the simulation results demonstrating different properties of EYDWA and EDFA amplifiers. The signal is transmitted at fixed pump power of 200 mW and a counter propagating pump type with 980 nm is used. The input power dependence of the gain and noise figure has been compared at two signal input wavelengths (1530-1550 nm).
It can be seen from figure 4 and 5, that the good performance for the downstream amplifiers are achieved at 1550 nm, for small input power (-5dBm) and with the EYDWA amplifier (better gain of 45 dB and high NF of 11 dB) as compared as EDFA amplifier (Gain of 29 dB and better NF of 5 dB). Also the curves show that all two amplifiers are suitable for amplification from 1530-1550
nm where Coarse Wavelength Division Multiplexing (CWDM) can be applied for downstream transmission.
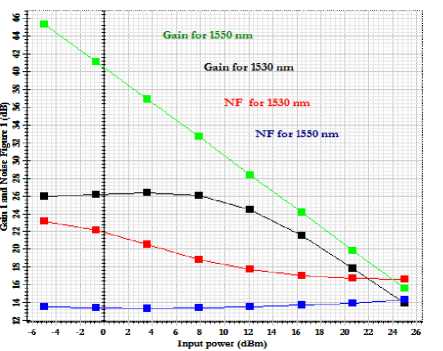
Fig.4. Gains, noise figures for different wavelengths of input of EYDWA amplifier.
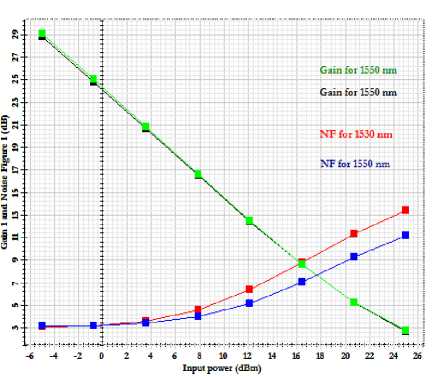
Fig.5. Gains, noise figures for different wavelengths of input of EDFA amplifier.
-
B. Variation of the Coefficient of Homogeneous up Conversion HUC:
Erbium-ytterbium co-doped waveguide amplifier (EYDWA) provides an excellent solution in increasing the dopant limit imposed by concentration quenching [15]. The homogeneous up conversion tends to cause more impairment in the EDFA amplifier performance than in the EYDWA amplifier. Figure 6 and 7 shows variation of gain and noise figure as a function of the HUC coefficient (0 to 1.10-21 m+3/s).
It is observed that as this later increased; the gain spectrum decreased and showed larger variation especially for EDFA as compared as EYDWA amplifier. Furthermore for UHC coefficient higher of 2.10-22 m+3/s we can notice lowest results in term of gain and noise figure ( low gain , high noise figure ) for EDFA, however EYDWA amplifier provides the best results (high and flat gain, lower noise figure). Also the maximum Q factor values occur for EYDWA amplifier and at lower HUC coefficient as compared as EDFA amplifier (figure 8).
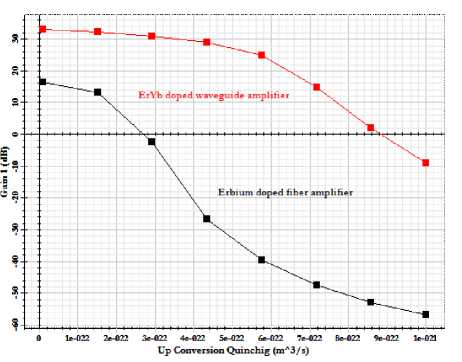
Fig.6. Gain as a function of up-conversion coefficient for the EYDWA and EDFA amplifiers.
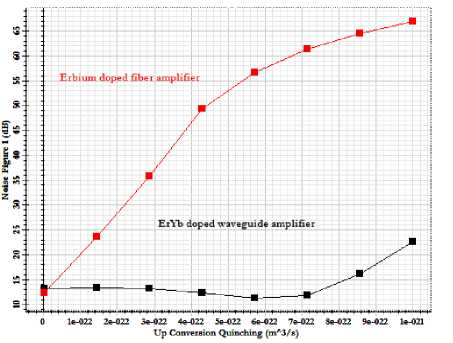
Fig.7. Noise figure as a function of up-conversion coefficient for the EYDWA and EDFA amplifiers.
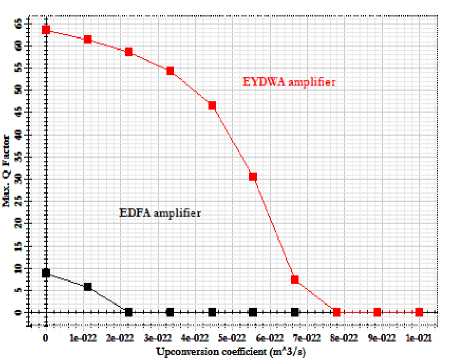
Fig.8. Q factor as a function of up-conversion coefficient for the EYDWA and EDFA amplifiers.
-
C. Variation of the Relative Number of Ion Per Clusters PIQ:
The existence of erbium clusters has a negative impact on amplifiers performance when the upper state of an amplifying transition is being depleted by energy transfer. To assess the system performance, the relative number of ion per clusters is varied (K= 0 to 0.5) for EDFA and EYDWA amplifiers. The effect of increasing the fraction of ion erbium in the clusters (k) on the performance (gain and noise figure) of both amplifiers is shown in figure 9 and 10. It is clear from curves that the presence of the erbium clusters reduces the efficiency of the system, more so in the EDFA than in the EYDWA.
On the other hand, the EYDWA amplifier shows a significant noise figure improvement of 26 dB at a 0.4 of fraction of ion erbium as compared to the EYDWA with 14 dB. Also for EDFA amplifier the Q factor significantly decreased when the k value increased as compared as EYDWA amplifier (figure 11).
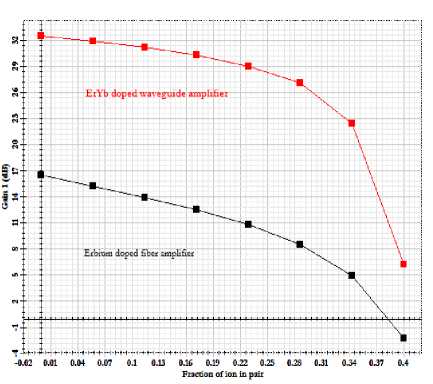
Fig.9. Gain as a function of fraction of ion erbium for the EYDWA and EDFA amplifiers.
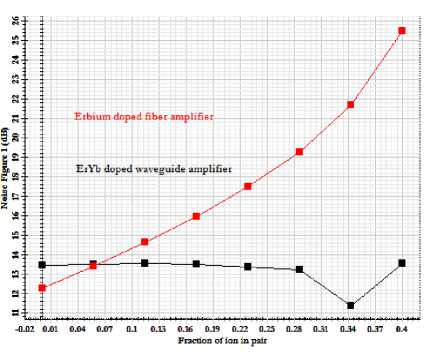
Fig.10. Noise figure as a function of fraction of ion erbium for the EYDWA and EDFA amplifiers.
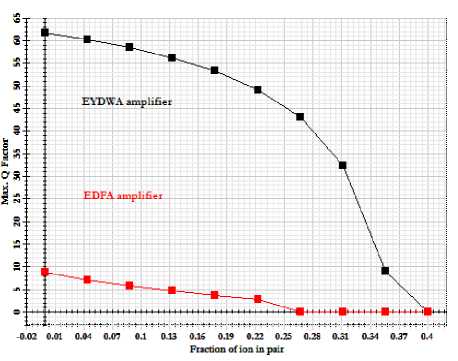
Fig.11. Q factor as a function of fraction of ion erbium for the EYDWA and EDFA amplifiers.
-
V. Performance of the GPON-FSO System
-
A. Performances as a function of fiber length
The performance of simulated hybrid system using EDFA and EYDWA as well as the pre-amplifier in the downstream configuration have been compared in the term of received power, maximum Q-factor and eye diagram. It is observed from figure 12, which as the fiber length increases (from 0 to 250 Km), the Q factor is a decrease simultaneously due to total loss (fiber, splitter and FSO).
Furthermore , at range of 1 Km the maximum reach of this network can be increased to 245 Km using EYDWA amplifier with best performance ( Q of 6.21), however EDFA amplifier is predominantly noise dominated, providing a limited reach at 64 Km with Q factor of 6.23 and after this distance the performance is degraded.
Also, by comparing figure 13 and 14 for three values of FSO range (1, 1.2 and 1.5 Km), it is predicted that, the performance increases with increase in received power. In case of EYDWA amplifier, received optical power get better when fiber length is decreased for than EDFA result. In addition, from figure 15 the measured eye diagram also showed a best performance (good eye opening) over a long transmission distance for the EYDWA especially. The means that BER is increases with increase in distance, however for both EDFA and EYDWA amplifiers, the measured BER performance confirmed low error rates of 2.10-10 and 5.10-9, respectively.
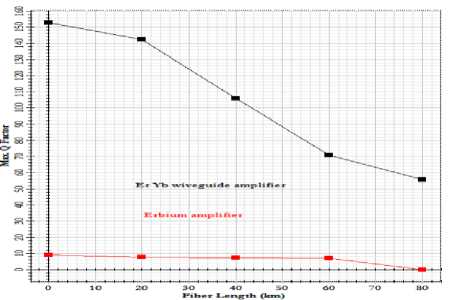
Fig.12. Performance of fiber length Vs Q-factor for EYDWA and EDFA amplifiers.
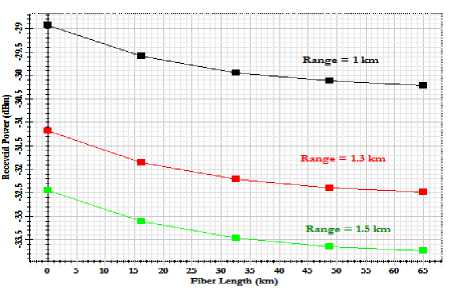
Fig.13. Received power with EDFA in GPON-FSO configuration and after 64 Km of fiber.
-
B. Performances as a function of FSO range
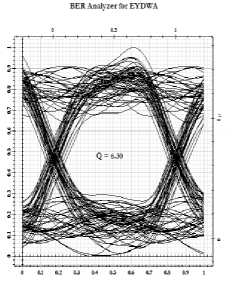
The hybrid system with both amplifiers configuration was also tested at fixed fiber transmission at 64 Km and by sweeping FSO range. Figure 16 and 17 represents the performance of FSO - GPON in term of Q factor and received power. It is observed from the curves that EYDWA always performs better than EDFA and prolongs the range to 5.5 Km within good result ( Q = 6.30 ), however EDFA amplifier limits this distance of FSO range to 1Km with acceptable quality- factor value (Q= 6.23 ). So the small range is also beneficial for cost factor.
Whereas, it can be seen that with EYDWA, the system still achieve acceptable BER of 10-9 and eye opening until 5.5 Km of FSO range. However for EDFA the same performances are achieved but only at 1 Km of FSO. The results are considered good enough as the proposed GPON-FSO is capable of transmitting 2.5 Gb/s data over FSO link through 64 Km fiber length (figure 18).
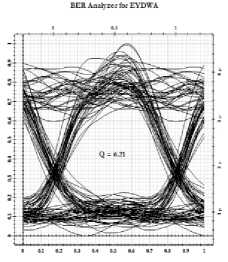
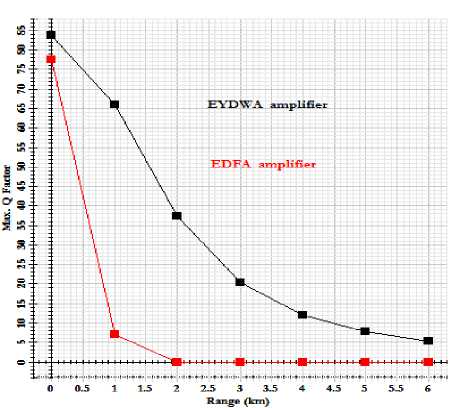
Fig.16. Performance of FSO range Vs Q-factor for EYDWA and EDFA amplifiers
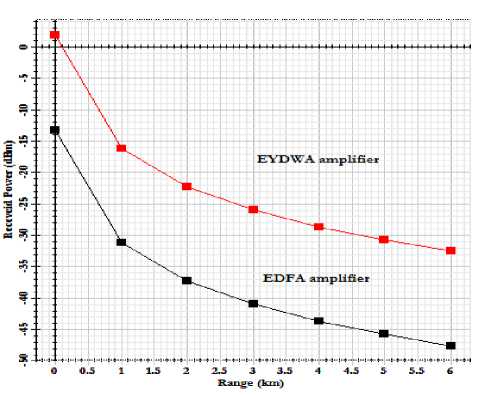
Fig.17. Performance of FSO range Vs Received power for EYDWA and EDFA amplifiers.
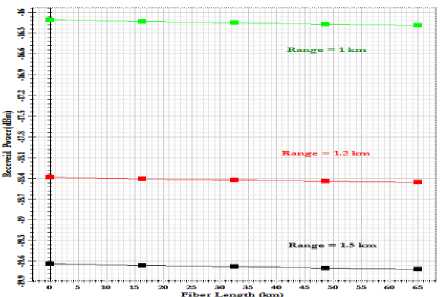
Fig.14. Received power with EYDWA in GPON-FSO configuration and after 64 Km of fiber length.
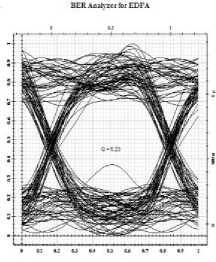
Fig.15. Measured the eye diagrams for signal propagation through constant FSO range (1 K m) and SMF length of 64 and 245 Km via (a) EDFA and (b) EYDWA respectively.
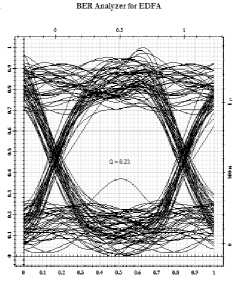
Fig.18. Measured the eye diagrams for signal propagation through constant SMF length (64 K m) and FSO range of 1 Km and 5.5 Km via (a) EDFA and (b) EYDWA amplifiers, respectively.
-
C. Performances as a function of number of users
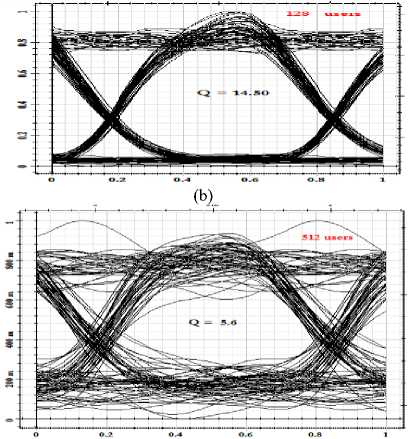
The performance of simulated system is measured for both amplifiers at FSO range of 1 Km. From figure19 and 20, we can see that Q factor decreases and degrade rapidly as the number of user increases in case of EDFA amplifier, while in case of EYDWA amlifier the decrease happens gradually and in small amount.
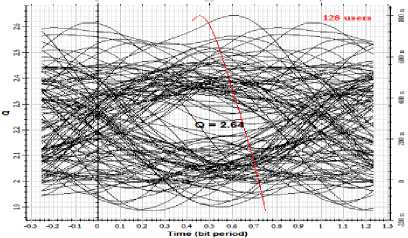
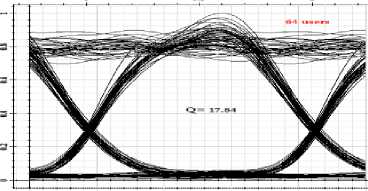
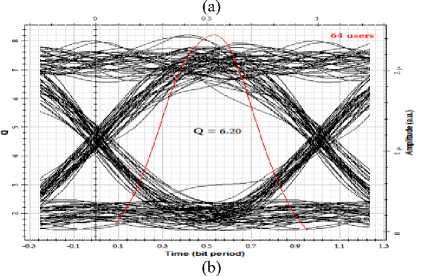
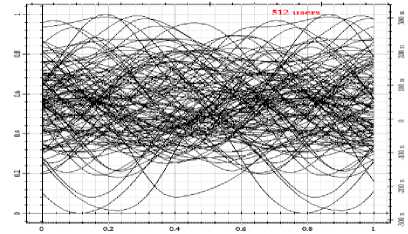
Also, we can notice that EYDWA amplifier can serve over 512 users with accepted performance (Q factor around 6.5 and moderate eye closure) after 170 Km of fiber transmission , however the highest Q factor of 17.48 is achieved by using 1:64 splitter with good eye opening diagram at same distance (figure 20). While the number of users has limited for 64 users after 64 Km distance when using EDFA amplifier acceptable performance in terms of Q factors and eye diagrams (figure 21 and 22).
(c)
Fig.20. Measured the eye diagrams for signal propagation through constant SMF length (170 K m) , FSO range for three number of users via EYDWA amplifier.
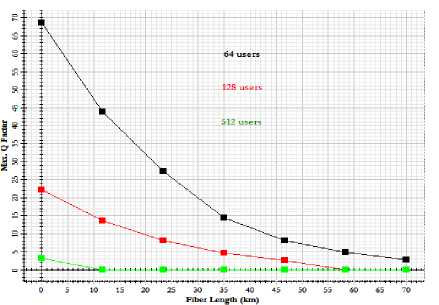
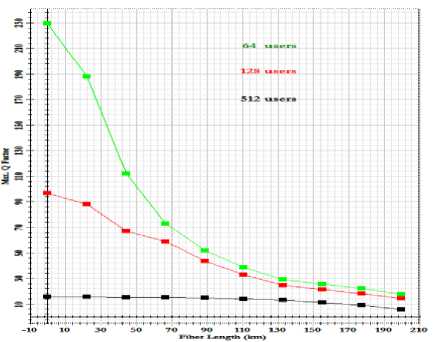
Fig.19. Performance of number of users Vs Q factor for EYDWA amplifier.
Fig.21. Performance of number of users Vs Q factor for EDFA amplifier.
(a)
(c)
Fig.22. Measured the eye diagrams for signal propagation through constant SMF length (64 K m), FSO range of 1 Km for three number of users via EDFA amplifier.
-
VI. Comparison of the Performances as a Function of Placemment of EYDWA Amplifier
In this section we investigated post-, pre- and in-line amplification methods for different positions of the EYDWA in fiber link. The effect of increase in signal input power for the three power compensation configurations is compared in terms of eye diagram, bit error rate. Further, the effect of variation in range of the FSO has also been observed.
-
A. Comparison as fonction of FSO range
To evaluate the performance of the hybrid GPON – FSO amplified in different configurations ( Booster, pre-and inline amplification) for various FSO range, the results of the first ONT have been taken, whereas EYDWA as booster is placed right after the transmitter to boost the launched signal into 64 Km fiber ,however to compensates signal losses the amplifier as function as inline amplifier is fixed at the distance L 1 =40 Km from OLT and at the distance L 2 =24 Km from to ONUs .
Figure.23 shows comparison of the Max Q factor in the downstream as a function of FSO range with the three amplification configurations previously exposed. This figure is obtained by sweeping the FSO range from 0 to 7 Km. It is seen that the quality factor is best in case of EYDWA using pre- as compared to post- and inlineamplifier and since the range increases, the Q factor decreases. Also at 64 Km fiber length of GPON, it is observed from the curves that EYDWA as function as pre- and inline- amplifier performs better than EYDWA booster and prolongs the range to 5.5 Km with in good result (Q = 6.23.and 5.96, respectively), however EYDWA booster limits this distance of FSO range to 2 Km with acceptable quality- factor value (Q = 6.09). So the small range is also beneficial for cost factor.
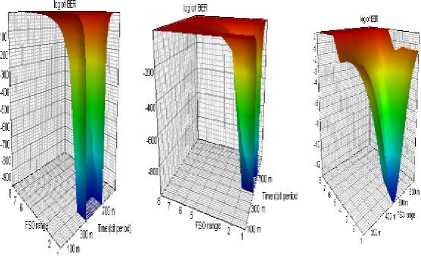
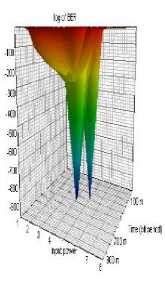
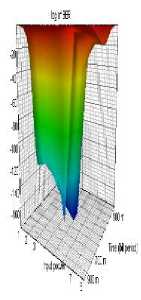
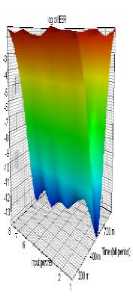
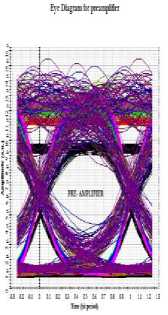
In addition, we can notice an optimum eye opening of the signal and the best position of amplifiers in the FSO-GPON system for pre-amplifier with lowest value of BER followed by inline-amplifier. However worst result (high BER and closure eye diagram) it’s found when using booster methods especially up 2 Km FSO range (figure.24 and figure.25).
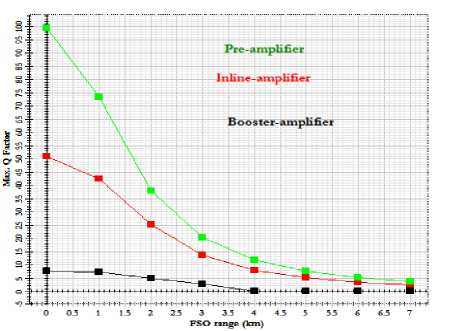
Fig.23. Performance of FSO ranges Vs Q-factor for EYDWA amplifier in different positions at 64 Km fiber length and signal input power of 10 dBm.
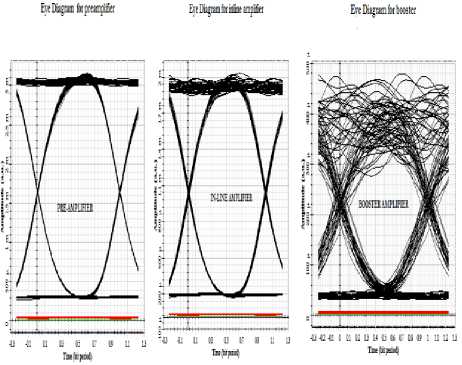
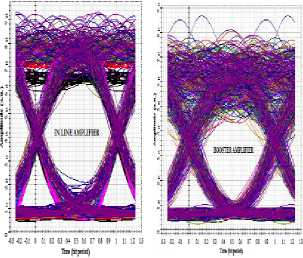
Fig.24. Measured the eye diagrams by sweeping the range of FSO through constant SMF length (64 K m) and at signal input power of 10 dBm for (a) pre-amplifier, (b) inline- amplifier ,(c) booster.
(a)
(b)
(c)
Fig.25. 3D BER graph as a function of FSO range and at fiber length of 64 Km for (a) pre-amplifier, (b) inline- amplifier, (c) booster.
-
B. Comparison as fonction of signal input power
Figure 26 shows variation of Q factor as a function of the signal input power (0 to 35 dBm). Again EYDWA used as a booster provides a fixed Q factor of 7.2, while for EYDWA inline and pre-amplifier, the Q-factor increase with the signal input power lower of 20 dBm and decreases up this value, however the optimum Q factor can reaches to 40 at 15 dBm and 29 at 20 dBm for pre-and inline-amplifier, respectively .
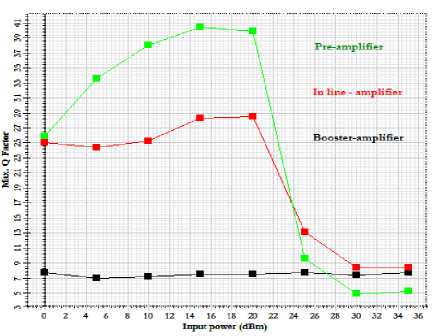
Fig.26. Max Q factor as a function of signal input power for the EYDWA amplifiers in position pre-, inline and booster amplifier.
The 3D graphical representation of BER as a function of signal input power for threes amplification configurations is showed in figure 27. The optimum result with Min of BER (over 10-40) is achieved with preamplifier up of 15 dBm (figure 27.a), however the in-line amplifier provided the best performance at 20 dBm with bit error ratio around to 10- 20 (figure 27.b) and constant bit error ratio (equal to 10-9 ) was obtained with applied EYDWA booster amplifier (figure 27.c).
Furthermore, the signal quality is proven by looking at the eye diagrams in figure.28 where the eye diagrams are captured at the highest received power for all configurations. It’s found that EYDWA pre-amplifier provides a clearer and wider eye opening for different signal input power as compared to inline amplification as the signal is less distorted by the generated noise (figure 28.a) and (figure 28.b). Since, thickest eye diagram is obtained when post-amplifier (booster) configuration is applied due to high noise generated that finally distorts the signal quality especially for logger fiber length (up 64 Km) (figure 28.c).
(a)
Fig.27. 3D BER graph as a function of signal input power and at fiber length of 64 Km for (a) pre-amplifier (b) inline- amplifier and (c) booster.
(b)
(c)
(a)
Fig.28. Measured the eye diagrams by sweeping signal input power through constant SMF length (64 K m) and at FSO range of 2Km for (a) pre-amplifier, (b) inline- amplifier, (c) booster.
EyeD^tuniMinliiie
Eye Dairen mlixtei
(b) (c)
The table.1 compares the values of the previously defined amplification configuration using simulation in the context of the GPON-FSO. It shown, that preamplification has better min BER and Q factor when compared with in-line and post-amplifier (booster).
Table 1. Comparison of pre-, post- and in-line EYDWA amplifier.
|
Analysis for 64 Km fiber length |
EYDWA Booster |
EYDWA inline -amplifier |
EYDWA preamplifier |
|
Max Q factor |
6.09 |
5.96 |
6.23 |
|
Min BER |
1,12.10-12 |
7,01.10-15 |
6,74.10-16 |
|
Gain (dB) |
31.01 |
40.88 |
42.98 |
|
Noise figure (dB) |
13.77 |
13.80 |
13.88 |
|
Max FSO range |
2 Km |
5.5 Km |
5.5 Km |
-
VII. Conclusion
The proposed hybrid of GPON-FSO network presents an appealing performance and can provide a feasible solution for last mile access problem. In other side and with a view to upgrade the GPON by budget increase several solutions for the amplifier have been compared namely EDFA and EYDWA; we have firstly characterized the amplifiers with respect to the gain and noise figure. However a high concentration of erbium degrades the performance of the amplifier in silica fiber because of detrimental clustering effects.
Also, the results reveal that the proposed hybrid system and for 64 Km fiber length could support the maximum FSO range of 5.5 and 1Km for EYDWA and EDFA, respectively with acceptable value of BER around 10-9. So, the free space optical transmission can further reduce substantial amount of fiber installation cost. Moreover at FSO range of 1Km, EYDWA was able to reach transmission optical distance of 245 Km for GPON whereas this distance has been reduced to 64 Km fiber length with EDFA amplifier.
Also, the results for comparison reveal that the proposed hybrid system at 2.5 Gbits/s and for 64 Km fiber length of GPON could support the maximum FSO range of 5.5 for EYDWA pre- and inline amplifier whereas only 2Km range for booster with acceptable value of BER around 10-9.
So, the free space optical transmission can further reduce substantial amount of fiber installation cost, furthermore from this work it is concluded that the EYDWA pre-amplifier provide better results as compared to other configurations .
