Performance of automatic frequency planning and optimization algorithm for cellular networks

Author: Mohanad Abdulhamid, Kisenya Sayianka
Journal: Журнал Сибирского федерального университета. Серия: Техника и технологии @technologies-sfu
Section: Информационно-коммуникационные технологии
Article in issue: 4 т.16, 2023.
Free access
Frequency planning is one of the most expensive aspects of deploying a cellular network. If a set of base stations can be deployed with minimal service and planning, the cost of both deploying and maintaining the network will decrease. To ensure that the scarce frequency is utilized to its maximum, planning and optimization are done. This is also carried out to ensure that there is high efficiency in cellular radio systems and little or minimum interference due to co-channeling. This paper focuses on coming up with an automatic way of planning and optimizing the frequency in the cellular network. The approach replaces the inefficient, inaccurate and tedious manual approach. The automatic approach simplifies work for the radio frequency (RF) engineers and also reduces the cost of operation. The automatic approach ensures that the cellular network is extensively deployed in a way that criteria of maximum quality, quantity and good coverage are met. The paper focuses on coming up with an automatic planning and optimization algorithm that minimizes the intra-system interference levels to reasonable ranges within the key performance indicators (KPIs) defined for any acceptable cellular network.
Аutomatic frequency planning, optimization algorithm, cellular networks
Short address: https://sciup.org/146282622
IDR: 146282622 | UDC: 621.396.49:535-12
Производительность алгоритма автоматического частотного планирования и оптимизации для сотовых сетей
Частотное планирование является одним из самых дорогостоящих аспектов развертывания сотовой сети. Если набор базовых станций можно развернуть с минимальным обслуживанием и планированием, стоимость как развертывания, так и обслуживания сети снизится. Чтобы обеспечить максимальное использование ограниченной частоты, выполняются планирование и оптимизация. Это также делается для обеспечения высокой эффективности сотовых радиосистем и небольших или минимальных помех из-за совместного распределения каналов. В этой статье основное внимание уделяется разработке автоматического способа планирования и оптимизации частоты в сотовой сети. Этот подход заменяет неэффективный, неточный и утомительный ручной подход. Автоматический подход упрощает работу инженеров по радиочастотам (РЧ), а также снижает эксплуатационные расходы. Автоматический подход гарантирует широкое развертывание сети сотовой связи с соблюдением критериев максимального качества, количества и хорошего покрытия. В документе основное внимание уделяется разработке алгоритма автоматического планирования и оптимизации, который минимизирует уровни внутрисистемных помех до разумных диапазонов в рамках ключевых показателей эффективности (KPI), определенных для любой приемлемой сотовой сети.
Text of the scientific article Performance of automatic frequency planning and optimization algorithm for cellular networks
Цитирование: Моханад Абдулхамид. Производительность алгоритма автоматического частотного планирования и оптимизации для сотовых сетей / Моханад Абдулхамид, Кисеня Саянка // Журн. Сиб. федер. ун-та. Техника и технологии, 2023, 16(4). С. 509–517. EDN: GCEHVD demand. This introduces the concept of frequency re-use and with it the possibility of interference between cells using the same carrier frequencies [3, 4].
Frequency planning in cellular network is the last step in the layout of a global systems for mobile communication(GSM) network. Prior to tackling this problem, the network designer has to address other issues like: where to install the BTSs or how to set configuration parameters of the antennas (tilt, azimuth, etc.). Once the sites for the BTSs are per sector has to be fixed. This number depends on the traffic demand which the corresponding sector has to support. The result of this process is a quantity of TRXs per cell. A channel has to be allocated to every TRX and this is the main goal of the algorithm [5].
2. Design procedure 2.1. Frequency planning and optimization GSM 900 2.1.1. Frequency re- use pattern
A 3/9 frequency re-use pattern is used. Three sites each serving three cells are used to form a cluster of nine cells. Frequency re-use rate is the measure for effectiveness of frequency plan. Multiple re-use rates increase effectiveness of frequency plan.
-
2.1.2. Carrier to channel interference ratio(C/I) in 3/9 cell repeat pattern
-
2.1.3. Capacity per area(C/A) in 3/9 repeat pattern
In theory, the pattern leads to a C/I of > 9dB. Extra measures are needed in order to reduce the impact of interference. The appropriate measures are frequency hopping and dynamic power control.
Geographical adjacent cells A1 and C 3 use adjacent ratio carriers. This implies that a C/A of 0 dB for Mobile Stations(MSs) operating on the boundary of adjacent cells A1 and C 3. This configuration which is shown in Fig. 1 is much better than the one quoted for GSM.
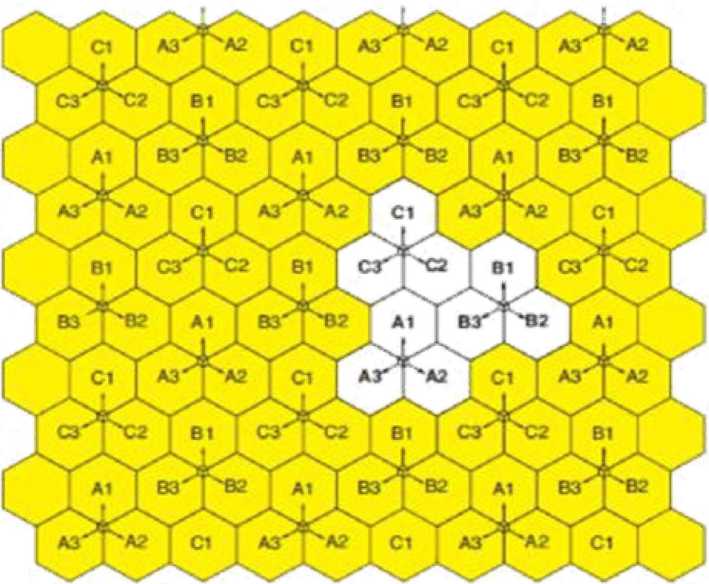
Fig. 1. Geographical adjacent cells
The design aims to expand its coverage to a new area using 5MHz of bandwidth in GSM 900 (Nominal Channel Band Spacing). With the available bandwidth, the Traffic Channel (TCH) frequency plan is made according to specifications (Signal to Noise Ratio(SINR) > 9dB) with an additional 6dB marginal for Broadcast Control Channel(BCCH) SINR. With a propagation exponent equals to 4, the system is interference limited.
Cluster sizes up to K = 12 or even more are used in some extreme cases. Due to increasing traffic, cluster sizes tend to decrease hence re-planning and optimization of the network has to be an ongoing activity. BCCH and TCH may have different cluster sizes. BCCH is crucial for connection hence it has larger cluster sizes.
The location of each cell site is given as a (x, y) coordinate in Table 1. For frequency planning purposes, a 3/9 frequency re-use pattern is required to minimize interference. A 3/9 re-use pattern means that there are three three-sector sites supporting nine cells i.e. each cell sites has 3 cells. Frequencies in the 3/9 cell plan are given in Table 2.
Traditionally, the needed coverage area is divided into many smaller areas (cells) which form clusters. A cluster is a group of cells in which all available carriers have been used only one time. Using carriers in cells in neighboring clusters leads to interference. To minimize interference, the frequency re-use distance (distance between two sites using the same carrier) must be as large as possible.
-
2.2. Proposed frequency reuse pattern
Each cell of the 3 cells uses a different subset of the allocated channels. Cells using the same frequency are placed as far away from each other as possible to ensure that co-channel interference is weaker than the signal originating from the cell.
Table 1. Cell site geographical location
|
Cell Site # |
X coordinate value (in kin) |
Y coordinate value (in km) |
|
1 |
1 |
1 |
|
2 |
3 |
1 |
|
3 |
5 |
1 |
|
4 |
1 |
3 |
|
5 |
3 |
3 |
|
6 |
5 |
3 |
|
7 |
1 |
5 |
|
8 |
3 |
5 |
|
9 |
5 |
5 |
Table 2. 3/9 reuse pattern
|
Channel Groups |
A1 |
B 1 |
Cl |
A2 |
B 2 |
C 2 |
A3 |
B 3 |
C 3 |
|
RF |
1 |
2 |
3 |
4 |
5 |
6 |
7 |
8 |
9 |
|
Channels |
10 |
11 |
12 |
13 |
14 |
15 |
16 |
17 |
18 |
|
19 |
20 |
21 |
22 |
23 |
24 |
25 |
For K-cell frequency reuse, the distance between the cells is given as;
D= (^3K). R(1)
Where R= Cell radius
The most significant interference comes from the 6 closest co-channel cells considering that the cell is considered hexagonal in this case.
C/I=(1/6)(D/R) y(2)
For free space, path loss (γ) = 2 but in most cases it ranges from 3–4
For K = 3 and γ = 3.7, we have
C/I=(1/6)(3R/R)37= 9.0955= 9.872dB(3)
The C/I value calculated above is the quoted GSM value of 9 dB. By the central limit theorem, as the number of interferers gets large, the total interference tends towards a Gaussian distribution and will hence resemble Additive White Gaussian Noise(AWGN). Using this, capacity is then approximated as;
C= BTlog2[1+SINR](4)
Where SINR ≈ C/I
The capacity per area for a single frequency band used throughout a given area(A) is given as;
C/A = C/KnR 2(5)
The minimum K that provides acceptable SINR is used to achieve satisfactory performance and maximize capacity. Decreasing the value of R, increases the capacity per unit area of the system. This is a good approach but very uneconomical because it means installation of more base stations which is very expensive.
Systems with fewer cells also experience higher interference levels because the path loss exponent, γ tends to be distance dependent. Decreasing the cell radius, R, makes γ to approach 2. This is because the unobstructed line of sight propagation is very likely in fewer or smaller cells. It can be seen that γ decreases, C/I and SINR decrease if the reuse factor, K is fixed. To have good interference levels, when cell radius is decreased, K must be increased to maintain the acceptable SINR.
-
2.3. System Model
Consider the geographical area as shown in Fig. 2 below, each cell having a radius of R. The distribution of channels among the cells, based on the resource planning model with cluster of size 3 is assumed. Minimum reuse distance, Dmin, is 3R. Meaning that the neighboring cells in interference is 6. For example, our reference cell is center cell B 3 for which interference will be considered from the following 6 neighbors; A3, C 3, A5, C 4, A2 and C 1.
If a channel is used in a cell, then none of the other 6 interference neighboring cells uses it. When an MS sets up a call, a request message is sent to the immediate BTS and if there is a free primary channel, the BTS selects one and ensures that there isn’t any co-channel interference hence maximizing channel utilization. Some of the channel selection schemes use resource planning model to get better channel reuse. Static resource planning is done in a way where a fixed set of – 513 –
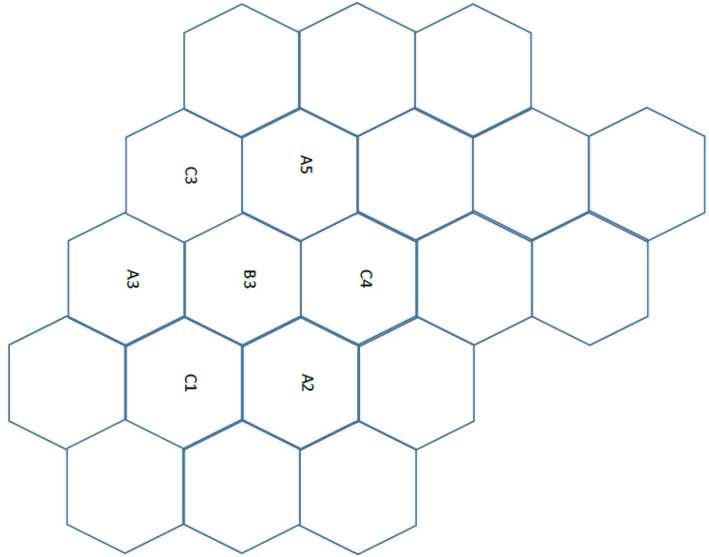
Fig. 2. System model resources is allocated to cells. However with the increase in variation of traffic, few cells starve for spectrum while others remain completely unused. When cells starve, there are very high chances of calls getting blocked due to insufficient resources. In a variable traffic scenario, static resource planning becomes inefficient. To deal with the unbalanced resource distribution, a more flexible planning is required which dynamically varies the resources according to the traffic. Resources allocation in orthogonal frequency division multiple access (OFDMA) ensures that two users are not assigned a common resource in a cell at any given time. This eliminates intra-cell interference (due to transmission within the cell).
The rules for using resource planning models are as follows:
-
• When all the primary channels are completely exhausted, then a cell requests the secondary channels.
-
• The set of cells is divided into a number of disjoint subsets such that any two cells in the same subset are physically separated with at least a minimum reuse distance. The set of channels are also divided into equivalent disjoint subsets.
-
• The channels in the disjoint subsets are primary channels of cells in the subset and secondary channels to another subset.
-
2.4. Proposed algorithm
Cells are divided into 3 linear disjoint subsets.i.e. A, B and C. These subsets are disjointed to avoid adjacent channel interference. Each of the 3 cells uses a different subset of the available channel. Each cell has 6 neighbors. Consider a total of 21 channels each with 7 primary channels;
Subset A: 1, 4, 7, 10, 13, 16, 19
Subset B: 2, 5, 8, 11, 14, 17, 20
Subset C: 3, 6, 9, 12, 15, 18, 21
The following assumptions are made:
• The neighbors of each cell are well defined. With the center cell as B 3, its neighbors are A3, C 3, A5, C 4, A2 and C 1.
• The terrain of the considered geographical area is flat hence channel fading is not accounted for in the system.
• All BTSs transmit at the same power and are centrally located in the cell.
• Directional antennas are used in the sectorised cells where each cell has 3 sectors, where each sector is assigned two channels hence two TRXs installed.
3. Results
When cell B 3 receives a call request, it checks the availability of primary channels and if there are vacant primary channels, it connects the call. If there aren’t any available primary channels, it initiate a search for free primary cells in the neighboring cells (A3, C 3, A5, C 4, A2 and C 1). When it receives a confirmation message from the neighboring cells, it selects a channel randomly from the first one to arrive. The call is connected ensuring that the quality of the call is maintained.
B 3 takes confirmation of the selected channel and marks it as interference channel. The channel is not used again until it is returned back by the borrower. The scheme focuses on the assignment of channels in such a way that channel utilization is maximized at the same time maintaining the voice quality. The algorithm ensures maximum reuse of channels.
In channel acquisition, information on free channels is collected ensuring that two cells within minimum reuse distance do not share the same channels. Acquisition phase of the distributed Dynamic Channel Allocation(DCA) algorithm consist of the search and update phases.
In channel selection, when cell B 3 requires a free channel, the channel selection scheme is used to pick one available channel and confirms with its interfering neighboring cells whether it can use the selected channel or not. After that, when a cell acquires or releases a channel at any time, it informs its interference neighbors so that every cell in the system model always knows the available channels of its interference neighboring cells.
The cells are located geographically in a way that ensures there exist very minimum interference. Cells using the same frequency are located far from each other to ensure that co-channel interference is weaker than the signal originating from the cells.
With the cells mapped as shown in the Fig. 3, deviation (upper and lower deviation) is minimized and the distance between every cell site is determined to be 48km using A Mathematical Programming Language(AMPL), as shown in Table 3.
Table 4 shows the sum of calls arriving in cell B 3, the sum of borrowed channels, sum of calls blocked in DCA scheme, the sum of calls blocked in the Fixed Channel Allocation(FCA) scheme, the probability and percentage of calls blocked.
DCA channels are not allocated permanently to different cells but BS allocates channels dynamically to coming calls. Call blocking is low in DCA scheme as compared to the FCA scheme. The DCA algorithm significantly reduces the call blocking rate. This is due to channel borrowing and reduction of the cluster size in the resource planning model. Radio resource reuse changes dynamically hence higher trucking efficiency.
FCA is a conventional approach where each cell is allocated to predetermined set of channels. The channels are allocated according to the frequency plan. Channels cannot be transferred between cells.
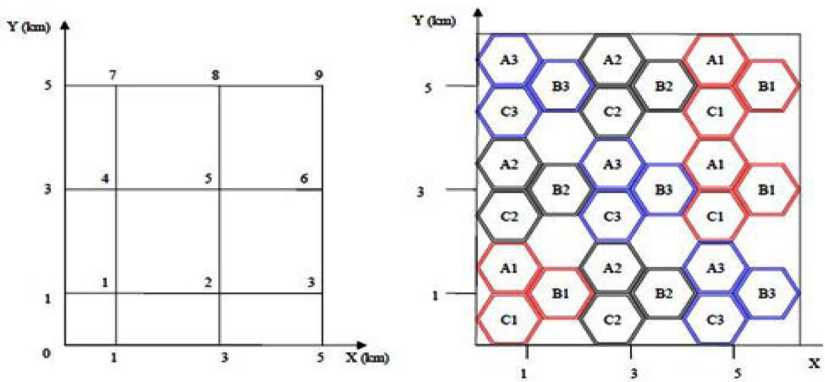
Fig. 3. Cells geographical mapping
Table 3. AMPL Results
|
Deviations |
|||||||||
|
Cell Sites |
1 |
2 |
3 |
4 |
5 |
6 |
7 |
8 |
9 |
|
1 |
0 |
1 |
0.5 |
0 |
0.25 |
0 |
0 |
1 |
0.25 |
|
2 |
0.25 |
0 |
0 |
1 |
0.75 |
1 |
0 |
0 |
0 |
|
3 |
0.75 |
0 |
0.5 |
0 |
0 |
0 |
1 |
-1.074 |
0.75 |
Table 4. Matlab simulation results
|
Calls Arriving in B 3 (SumnB 3) |
Sum of borrowed Channels (n) |
Sum of blocked calls in DCA (Sumnb) |
Sum of blocked in FCA (Sumnbl) |
Probability of call block in DCA |
Probability of call block in FCA |
% Blocked calls in DCA |
% Blocked calls in FCA |
|
812 |
6 |
16 |
302 |
0.0197 |
0.372 |
1.97 |
37.2 |
|
753 |
6 |
12 |
260 |
0.0159 |
0.345 |
1.59 |
34.5 |
|
764 |
1 |
22 |
285 |
00289 |
0.373 |
2.89 |
37.3 |
|
734 |
5 |
34 |
272 |
0.0463 |
0.371 |
4.63 |
37.1 |
|
784 |
3 |
13 |
274 |
0.0166 |
0.349 |
1.66 |
34.9 |
|
739 |
5 |
18 |
246 |
0.0244 |
0.333 |
2.44 |
33.3 |
|
704 |
5 |
19 |
250 |
0.0270 |
0.355 |
2.70 |
35.5 |
|
721 |
5 |
14 |
226 |
0.0194 |
0.313 |
1.94 |
31.3 |
|
817 |
5 |
22 |
312 |
0.0269 |
0.382 |
2.69 |
38.2 |
|
697 |
4 |
22 |
229 |
0.0316 |
0.329 |
3.16 |
32.9 |
|
777 |
5 |
0 |
289 |
0 |
0.372 |
0 |
37.2 |
|
826 |
2 |
8 |
302 |
0.097 |
0.366 |
0.97 |
36.6 |
|
785 |
5 |
12 |
289 |
0.0153 |
0.368 |
1.53 |
36.8 |
|
823 |
3 |
13 |
306 |
0.0158 |
0.372 |
1.58 |
37.2 |
|
682 |
2 |
16 |
223 |
0.0235 |
0.327 |
2.35 |
32.7 |
|
791 |
9 |
44 |
282 |
0.056 |
0.357 |
5.56 |
35.7 |
|
713 |
5 |
10 |
263 |
0.0140 |
0.369 |
1.40 |
36.9 |
Probability of calls being blocked is given by:
Pbl = (calls blocked)/(calls arriving in cell B 3)(6)
Pbl(DCA) = (calls blocked in DCA)/(calls arriving in cell B 3)(7)
Pbl(FCA) = (calls blocked in FCA)/(calls arriving in cell B 3)(8)
Percentage call block is given by:
%Cb=(calls blocked)/(calls arriving in cell B 3)(100 %)(9)
4. Conclusion
The sources of RF interference, the types of RF interference, factors affecting RF interference and the acceptable level of RF interference were discussed. When RF engineers are designing the cellular system, the most important task is assignment of radio frequencies to all the BTSs in the network. With the scarcity and price of frequency bands, frequency reuse must be employed. The paper discussed the frequency reuse patterns and went further to show the effectiveness of the reuse pattern when implemented in the network. The proposed channel allocation algorithm makes efficient reuse of channels using the resource planning model with the reduction of cluster size. The simulation results show that the blocking probability of the proposed DCA algorithm is significantly less than that of FCA algorithm.
References Performance of automatic frequency planning and optimization algorithm for cellular networks
- Venkateswarlu T. and Naresh K. An automatic frequency planning of GSM networks using evolutionary algorithms.International Journal of Engineering Research and Applications. 1(3). 626-632. 2011.
- Umair M., Shahid W. and Abbasi M. Automatic frequency planning and optimization algorithm for cellular networks. Proceedings of the World Congress on Engineering. 2(4-6). UK, 2012.
- Haider M., Yousaf J., Qureshi N. Performance evaluation of automatic frequency planning using automatic frequency optimization system tool. 12th International Conference on Frontiers of Information Technology. Pakistan, 2014.
- Sankar S. Optimum frequency planning for efficient channel utilization.International Journal of Innovative Research in Computer and Communication Engineering. 4(1). 989-994. 2016.
- Chopra R., Ahuja K. Advanced approach to improve GSM network QoS with automatic frequency planning. CiiT International Journal of Wireless Communication. 8(8). 304-308. 2016.
