Phenological characterization of forest vegetation in Russia (the Krasnoyarskii krai) based on satellite data
 based on satellite data")
Author: Botvich Irina Yu., Pisman Tamara I., Shevyrnogov Anatoly P.
Journal: Журнал Сибирского федерального университета. Серия: Техника и технологии @technologies-sfu
Article in issue: 8 т.11, 2018.
Free access
He present study addresses phenology of forest vegetation based on satellite data, by analyzing the relationship between the long-term (2003-2016) series of NDVI of coniferous and deciduous tree stands and climate in the Krasnoyarskii Krai (Russia). The source data were the 8-day satellite data from MODIS (the MOD09Q1 product) and weather data from land-based weather stations. Positive trends were revealed for the average NDVI values of deciduous trees between May 1 and 16. This correlated with the trend of the accumulated air temperature (above + 5 °С) from January through May. The long-term variations in the dates of the onset of conifer seasonal growth were estimated using average NDVI values of the new shoots between May 17 and June 1: the difference between the average NDVI values of coniferous trees after the onset of the seasonal growth (June 1) and the NDVI values before the onset of the seasonal growth (May 17). Positive trends were obtained for the average NDVI values of the new shoots on coniferous trees. A tendency towards an earlier onset of the seasonal growth was obtained for a 14-year period of time.
Phenology, climate, forest, satellite remote sensing, ndvi trends, тренды ndvi
Short address: https://sciup.org/146279564
IDR: 146279564 | UDC: 528.88 | DOI: 10.17516/1999-494X0119
Фенологические характеристики лесной растительности на территории России (Красноярский край) по спутниковым данным
Проведено изучение фенологии лесной растительности по спутниковым данным на основе анализа связи многолетних рядов NDVI (2003-2016 гг.) хвойных и лиственных древостоев и климата в Красноярском крае (Россия). Исходными данными являлись 8-дневная спутниковая информация Modis (продукт MOD09Q1) и метеорологическая информация с наземных метеостанций. Обнаружены положительные тренды усредненной NDVI лиственной растительности с 1 по 16 мая. Это коррелирует с трендом накопленной температуры воздуха (выше 5 °С) с января до мая включительно. Для оценки многолетней динамики начала вегетации хвойной растительности использованы усредненные NDVI молодых приросших побегов с 17 мая по 1 июня, равные разнице усредненных NDVI хвойных деревьев после начала вегетации (1 июня) и NDVI до начала вегетации (17 мая). Получены положительные тренды усредненных NDVI молодых приросших побегов хвойной растительности. Установлена тенденция к более раннему началу вегетации лесной растительности за 14-летний период.
Text of the scientific article Phenological characterization of forest vegetation in Russia (the Krasnoyarskii krai) based on satellite data
It is well-known that forests consisting of different tree species may show different dynamics of phenological development [7]. Classification of forests consisting of several tree species, which differ in their phenological dynamics, can be done by using satellite images taken in different periods of the yearly plant life cycle.
Satellite images taken both at different years and at different phenological stages have greater informational value [8]. These data are indispensable for monitoring the functions of forest ecosystems and revealing their critical states. This approach is effective when series of images of the study area are taken during the whole plant growing period and during certain phenological stages. A surge of interest in plant phenology of the last decade was triggered by research on global warming [9]. Analysis of long-term trends in periodic events in the plant and animal kingdoms can serve as both a good bioindicator of climate change and as a quantitative parameter of the effect of warming on Biosystems. Due to warming and rising spring temperatures, critical temperatures or total accumulated temperatures necessary for plants to start to grow are reached at earlier dates. In recent years, these assumptions have been verified in various geographical zones and for different plants [10].
The displacement of the dates of phenological stages is primarily associated with the temperature of the previous months. Analysis of observational series of 542 plant species in 21 European countries (1971–2000) showed that the dates of phenological stages were significantly determined by the temperature of the preceding months [11].
Recent years have seen considerable interest in long-term observational series of phenological data as a source of information on the interannual variations in the state of populations and a basis for establishing a relationship between phenological properties and climate factors [12]. The availability of the time series of continuous satellite observational data with sufficiently high temporal resolution is a necessary condition for determining phenological properties of the plant canopy (dates of the onset of various phenological stages, length of the growing period, etc.) [13].
The most widely used index is NDVI (Normalized Difference Vegetation Index) – a simple indicator of the quantity of photosynthetically active biomass [14]. Indices of this group quantify the total vegetation, and they are used to estimate its state for solving a wide range of issues. They summarize and demonstrate the effects of such factors as chlorophyll content, leaf surface area, and density and structure of plant canopy. For vegetation, NDVI will tend to positive values, which grow with the increase in the green phytomass.
Systematic meteorological observations at the Stolby Nature Reserve (the Krasnoyarskii Krai, Russia) have been conducted since 1927. In the last few decades (before 2003), average yearly and longterm average annual air temperatures clearly tended to rise while annual precipitation did not show any distinct trend of change.
The purpose of this study was to estimate phenological properties of forest vegetation by analyzing the relationship between the long-term NDVI series (2003–2016) and climate in Russia (the Stolby Nature Reserve, the Krasnoyarskii Krai). We constructed long-term series of 1) average NDVI of coniferous and deciduous tree stands for the spring season (May) and 2) average NDVI values of the new shoots on conifers for a period of between May 17 and June 1, which were equal to the difference between average NDVI values after the onset of growth (June 1) and the NDVI values before the onset of growth (May 17), and 3) a series of interannual accumulated air temperature (above + 5 °С) from January through May.
Materials and Methods
Study Area
The study sites were forested areas in Russia (the Stolby Nature Reserve, the Krasnoyarskii Krai). The Stolby Nature Reserve is situated on the north-west slopes of the Eastern Sayan Mountains.
The forest sites investigated in this study comprised the following major tree species: deciduous trees – silver birch (Betula pendula) , aspen (Populus tremula) , and conifers – Scots pine ( Pinus silvestris ), Siberian fir (Abies sibirica) and Siberian pine (Pinus sibirica ).
Based on observations performed for a period of between 2003 and 2011, the time period of between May 1 and 16 was chosen as the time suitable for monitoring the onset of growth of deciduous vegetation. For conifers, we chose the time period of between May 17 and June 1 [10].
Satellite methods
Dynamics of reflectance from forest vegetation was studied by using MODIS/Terra satellite data (MOD09Q1 and MOD09A1 data products) for the plant growing periods during 2003-2016. The study was based on 8-day data of the red (620–670 nm) and near infrared (841–876 nm) channels with spatial resolution of 250 m ( http://modis.gsfc.nasa.gov/ ). Preliminary and thematic processing of satellite data was conducted using the ENVI, IDL (the Interactive Data Language) software. Preliminary processing of satellite images involved:
– converting image projection from Sinusoidal projection into Universal Transverse Mercator (UTM) using the MODIS Reprojection Tool program and
– constructing a mask of missing data: satellite data obtained at a zenith angle of over 40° were left out and pixels with cloud cover and cloud shadows were excluded using the algorithm proposed by Neishtadt [15].
The study sites were localized based on the data found in the Ecological Atlas of the Stolby Nature Reserve ( http://stolby.torins.ru/main.php ) and spatial data of Spot-4 images (spatial resolution of 20 m).
To analyze phenological events, we constructed a long-term (2003–2016) series of the average daily accumulated air temperature (above + 5 °С) from January through May, based on the database of the “Opytnoye Polye” weather station at Krasnoyarsk.
Results and Discussion
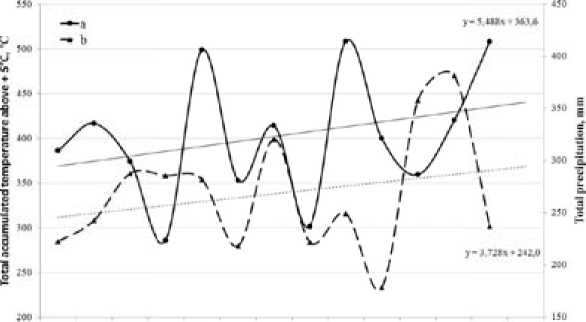
Analysis of the long-term spring series of the average NDVI values of deciduous and coniferous vegetation was performed for periods of between May 1 and 16 and between May 17 and June 1, respectively. These time periods were selected on the basis of ground-based studies. Different trends were revealed for deciduous and coniferous plants (Fig. 1). For deciduous trees, the trend was positive, while for conifers, it was negative. The positive trend for the spring average NDVI values for deciduous stands correlates with the positive trend in the interannual variation in the accumulated air temperature (above + 5 °С) from January through May (Fig. 2). The growing period for deciduous trees begins when they leaf out, and emergence of the new leaves on the winter leafless trees can be effectively estimated using NDVI. Thus, this index can be used to estimate when the growing season begins for deciduous trees. Therefore, for deciduous trees (Silver birch, aspen), analysis showed a tendency of an earlier onset of seasonal growth.
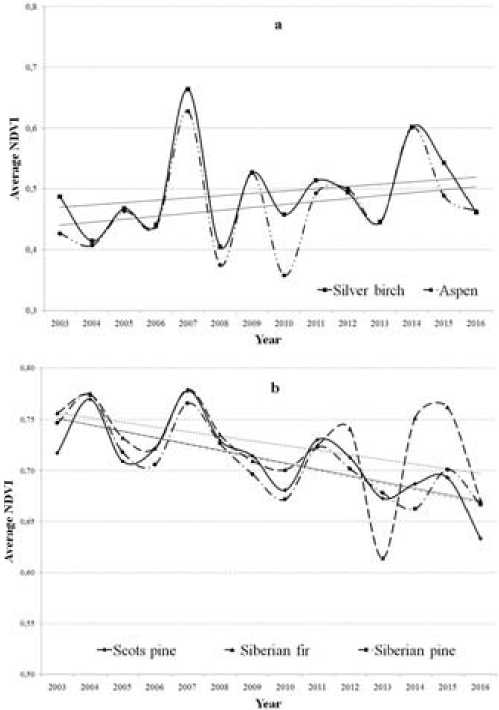
Fig 1. Long-term series of average NDVI values for forest stands dominated by a) Silver birch and aspen for a period of between May 1 and 16 and b) Scots pine, Siberian fir, and Siberian pine for a period of between May 17 and June 1
2001 2004 2005 2000 200’ 2000 2000 2010 2011 2012 201.1 2014 2015 201»
Vr>r
Fig. 2. Interannual variations in the accumulated air temperature (above + 5 °С) from January through May (a). Total precipitation from May through August, mm (b). The data of the “Opytnoye Polye” weather station, Krasnoyarsk
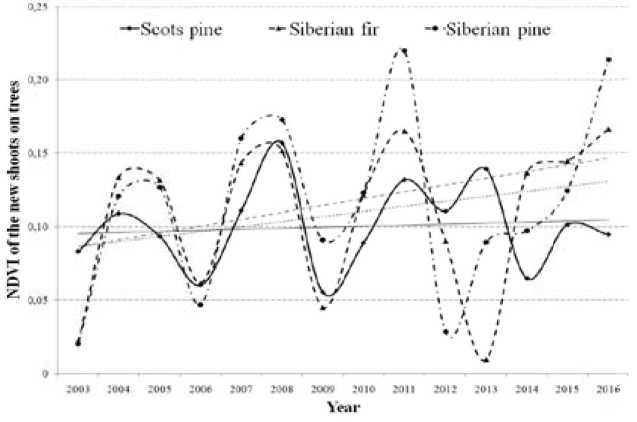
Fig. 3. Long-term series of the average NDVI for the young shoots on conifers
For coniferous trees we revealed a negative spring trend of the average NDVI (Fig. 1b). Coniferous trees do not shed their foliage in the fall. It was impossible to estimate when the growing season began for coniferous trees based on the analysis of the long-term spring series of the average NDVI, as the percentage of the spring new shoots were too low compared to the total biomass of winter foliage. Therefore, the onset of spring growth of conifers was estimated by analyzing longterm series of the average NDVI values for the new tree shoots for a period of between May 17 and June 1. They were defined as the difference between the average NDVI values of the spring crowns of trees with the young shoots after the onset of the growing season (June 1) and the average NDVI values for the trees before the onset of the growing season (May 17). We obtained a positive trend of the average NDVI for the new shoots on coniferous trees (Fig. 3). Thus, for coniferous trees (Scots pine, Siberian pine, fir), analysis showed a general tendency of an earlier beginning of the growing season, too.
Conclusions
Recently, remote sensing of the Earth has been increasingly used to study response of vegetation to large-scale climate change. In such studies, satellite images are used to analyze changes in different vegetation indices [16].
Plant phenology influences various processes such as carbon cycling and nutrient cycles. Phenological development of plants is based on the periodicity of physiological processes, the so-called biological clock. However, the dates of the beginning and end of the plant growing period and its length are considerably influenced by seasonal weather variations.
Analysis of the relationship between the long-term (2003–2016) spring series of the average NDVI values for coniferous and deciduous trees in Russia (the Stolby Nature Reserve, the Krasnoyarskii Krai) and the long-term accumulated air temperature (above + 5 °С) from January through May produced the following results:
-
– a positive trend in the average NDVI of deciduous tree stands between May 1 and 16, which correlated with the positive trend in the interannual variations in the accumulated air temperature (above + 5 °С) from January through May;
-
– a negative trend in the average NDVI of coniferous tree stands between May 17 and June 1;
-
– a positive trend in the average NDVI of the young shoots on coniferous trees between May 17 and June 1.
Thus, the study of phenology of forest vegetation in the Stolby Nature Reserve (Russia) for a period of between 2003 and 2016 based on satellite data revealed a tendency towards an earlier onset of seasonal growth of plants.
Acknowledgments
The reported study was funded by RFBR and Russian Geographical Society according to the research project № 17-05-41012; Russian Foundation for Basic Research, Government of Krasnoyarsk Territory, Krasnoyarsk Regional Fund of Science to the research project №. 18-45-243007; the State budget allocated to the fundamental research at the Russian Academy of Sciences (project No AAAA-A17-117013050027-1).
References Phenological characterization of forest vegetation in Russia (the Krasnoyarskii krai) based on satellite data
- Bartalev S.A., Belward A.S., Erchov D.V., Isaev A.S. A new SPOT 4-VEGETATION derived land cover map of Northern Eurasia. Int. J. Remote Sensing, 2003, 24, 1977-1982
- Walther G.R., Post E., Convey P., Menzel A., Parmesan C., Beebee T.J., Fromentin J.M., Hoegh-Guldberg O., Bairlein F. Ecological responses to recent climate change. Nature, 2002, 416, 389-395
- Kowabata A., Ichi K., Yamaguchi Y. Global Monitoring of Interannual Changes in Vegetation Activities Using NDVI and its Relationship to Temperature and Precipitation. Int. J. Remote Sensing, 2001, 22, 1377-1382
- Xiao J., Moody A. Trends in vegetation activity and their climatic correlates: China 1982 to 1998. Int. J. Remote Sensing, 2004, 25, 5669-5689
- Nightingale J.M., Phinn S.R. Assessment of relationships between precipitation and satellite derived vegetation condition within South Australia. Aust. Geogr. Stud., 2003, 41, 180-195
- Kou W., Liang C., Wei L., Hernandez A.J., Yang X. Phenology-Based Method for Mapping Tropical Evergreen Forests by Integrating of MODIS and Landsat Imagery. Forests, 2017, 8, 34
- Sakai S. Phenological diversity in tropical forests. Popul. Ecol., 2001, 43, 77-86
- Sakamoto T., Yokozawa M., Toritani H., Shibayama M., Ishitsuka N., Ohno H. A crop phenology detection method using time-series MODIS data. Rem. Sens. Environ., 2005, 96 (3-4) 366-374
- Cleland E.E., Chuine I., Menzel A., Schwartz M. Shifting plant phenology in response to global change. Trends Ecol. Evol., 2007, 22 (7), 357-365
- Овчинникова Т.М., Фомина В.А., Андреева Е.Б., Должковая Н.П., Суховольский В.Г. Анализ изменений сроков сезонных явлений у древесных растений заповедника Столбы в связи с климатическими факторами, Хвойные бореальной зоны, 2011, XXVIII (1-2), 54-59
- Menzel A. et al. European phenological response to climate change matches the warming pattern. Global Change Biology, 2006, 12, 1969-1976
- Nystrom M., Holmgren J., Olsson H. Prediction of tree biomass in the forest-tundra ecotone using airborne laser scanning. Remote Sens. Environ., 2012, 123, 271-279
- Heiskanen J. Estimating aboveground tree biomass and leaf area index in a mountain birch forest using ASTER satellite data. Int. J. Remote Sens., 2006, 27, 1135-1158
- Azzali S., Menenti M. Mapping vegetation-soil-climate complexes in southern Africa using temporal Fourier analysis of NOAA-AVHRR NDVI data. Int. J. Remote Sens., 2000, 21, 973-996
- Нейштадт И.А. Построение безоблачных композитных спутниковых изображений MODIS для мониторинга растительности, Современные проблемы дистанционного зондирования Земли из космоса, 2006, 2, 359-365
- Botvich I.Yu., Shevyrnogov A.P. A Study of the Phenological Variability of Terrestrial Ecosystems in the South of the Krasnoyarsk Territory and Khakassia Based on Satellite Data. Biophysics, 2017, 62(4), 667-670
