Phylogenetic Method for High-Throughput Ortholog Detection

Author: Shaifu Gupta, Manpreet Singh
Journal: International Journal of Information Engineering and Electronic Business(IJIEEB) @ijieeb
Article in issue: 2 vol.7, 2015.
Free access
Accurate detection of orthologous proteins is a key aspect of comparative genomics. Orthologs in different species can be used to predict the function of uncontrived genes from model organisms as they retain the same biological function through the path of evolution. Orthologs can be inferred using phylogenetic, pair-wise similarity or synteny based methods. The study here describes a computational method for detecting orthologs of a protein. A phylogenetic tree based approach is used for identification of orthologous proteins. A Combination of species overlap algorithm and patristic distances is used for detecting orthologs of a protein from a set of FASTA sequences. Patristic distances have been used to drill the orthology predictions of any protein down to its closest orthologs. The approach gives a considerably good accuracy and has high specificity and precision. The use of Distance threshold allows controlling the stringency level of predictions so that the closeness and proximity between the protein of interest and its orthologs can be adjusted.
Orthologs, comparative genomics, Phylogenetics, Species-overlap, Patristic distance
Short address: https://sciup.org/15013339
IDR: 15013339
Text of the scientific article Phylogenetic Method for High-Throughput Ortholog Detection
Published Online March 2015 in MECS
Comparative genomics is a bioinformatics field that guides the researchers to infer the function of biologically important genes, by identifying orthologs between the well studied and unstudied species [1].
Genes that have a common ancestor are said to be homologs of each other [2]. These genes do evolve from a common ancestor but may not necessarily share the same function. Homology can be expressed as either true or false but it cannot be expressed as a percentage. Homologs are generally of two types: orthologs and paralogs and these homologs differ by the way they arise from the ancestral gene.
Genes in different species that evolve from a common ancestor as a result of a speciation event are called orthologs. When a species departs in two species then the copy of the same ancestral gene in resulting species are said to be orthologs of each other, thus orthologs form evolutionary and functional twins in different species [3].
The genes that are related to each other by gene duplication event are called paralogs [2]. When the duplication of a gene occurs in a genome; then the duplicated genes are said to be paralogs of each other. Paralog genes evolve new functions with time, which may or may not be threaded from the original one [4]. Paralogs can be classified based on the relative timing of gene duplication i.e. whether gene duplication occurs before or after speciation. Duplications that occur before speciation are called out-paralogs and those that occur after speciation are called in-paralogs [5], [6].
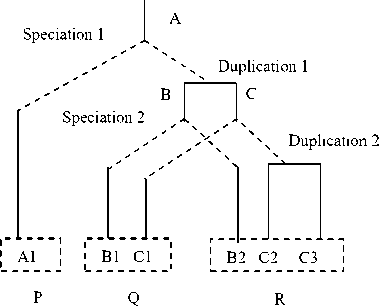
Fig. 1. Orthologs and Paralogs
As in fig. 1, two speciation and two duplication events give rise to three genomes P, Q and R. Genes of genomes Q and R are orthologs of gene A1 in genome P. Only B2 is orthologous to B1. C1 has two orthologs that is C2 and C3. B2 and C1 are paralogs [3], [7].
Identification of orthologs is very important for utilizing the rapidly available sequence data, for phylogenetics and comparative genomics study [8].
The paper is organized as follows. Section II presents an overview of existing ortholog detection methods. Section III describes the present approach followed for ortholog detection. Section IV then presents the results of the followed approach. Finally, Section V presents the conclusions and future scope.
-
II. Ortholog Detection Methods
Two main classes of ortholog detection methods are: phylogenetic methods and pair-wise blast based methods In addition to these two classes, some other methods based on synteny and protein interaction networks exist.
-
A. Phylogenetic tree based methods
Tree based methods predict orthologs by creating a gene tree of different genes of organisms and reconciling the gene tree with the species tree. A reconciled tree is created by comparing the gene tree and species tree. Its internal nodes are labeled with speciation or duplication events. A node is labeled as speciation if it has the same structure in both species tree and gene tree and if a node shows discrepancy in its structure, it is considered to be a duplication event and hence paralogs. By reading the labeled tree of speciations and duplications, orthologs can be obtained. Some methods that use tree reconciliation are RAP [9], RIO [4] and TreeFam [10]. Tree reconciliation is a very computation intensive task and therefore is not very suitable for large datasets. Tree reconciliation can be replaced by species overlap algorithms, which are based on calculating a species overlap score. Score is calculated between the tree divisions and a node is considered as a speciation node if the score at the node is less than a threshold value and as duplication node if the score calculated at the node is greater than a threshold. Species overlap score approach eliminates the need to construct a reconciled tree for inferring duplication and speciation events. It is comparatively less intensive than reconciliation approach and more suitable for large datasets. Ortholog detection methods based on species overlap are LOFT (Levels of Orthology From Trees) [11], The Human Phylome by Huerta-Cepas (2007) [12] and MetaPhOrs [13]. Tree based methods suffer less by gene losses and changing rates of evolution compared to pair-wise methods and provide high resolution of orthology. Some other tree based methods are [14-17].
-
B. Pair-wise Comparison Approaches
These are also called graph based methods. Graph based methods rely on graphs with genes (or proteins) as nodes and evolutionary relationships between them represented as edges. They infer whether these edges represent orthology or paralogy, and build clusters of genes on the basis of the graph [18]. Unlike tree based methods, they do not involve creation of phylogenetic trees, but use pair-wise sequence similarities between the sequences, as a measure of orthology. For measuring pair-wise similarities, algorithms like BLAST (Basic Local Alignment Search Tool) [19] and Smith-Waterman are used. All-against-all comparisons are performed to find pair-wise similarity between genes of different genomes. Reciprocal Best BLAST Hit (RBBH) performs BLAST queries in both the directions and if the top hits in both the directions are same, then the sequences are judged to be orthologs of each other. Its advantage over simple BLAST is that it filters out poor BLAST matches
-
[20] . But it requires a complete set of genomes to work accurately whereas; we have cases where complete genomes are not available. Some methods use evolutionary distances to identify the closest genes instead of similarities scores. The idea behind is that between any given two genomes, orthologs are the homologs that diverge least. Reciprocal Smallest Distance (RSD) method considers orthologs as genes with the smallest evolutionary distance between them. RSD method can detect those pairs that are detected by RBBH and also those that are excluded by RBBH. But, this method is more complex and time consuming than RBBH method [21]. Round up [22], is also based on RSD method.
Inparanoid (2001) improves upon the RBBH method. It uses out-group species in its ortholog detection process. Inparanoid is better than simple BLAST as BLAST reports local similarity but Inparanoid avoids it through its overlap cutoff. It is faster than conventional phylogenetic methods of reconciliation but has a disadvantage that it works for two species only [23].
Multiparanoid (2006) provides an extension to Inparanoid and extends its functionality to cluster the orthologs from multiple species. Its drawback is that it can only handle the species that have the last ancestor in common [5], [24].
OrthoMCL is a method of ortholog detection that uses Markov clustering (MCL). It uses an inflation parameter to set the cluster tightness. It shows very similar performance to Inparanoid. It is better than Inparanoid as Inparanoid is for two species only but OrthoMCL can be used for more species. OrthoMCL can be used when incomplete genome sets are available as it minimizes errors attributable to missing genes [25]. Difference between Multiparanoid and OrthoMCL is the tendency of OrthoMCL to include out-paralogs. Another drawback is that the inflation parameter needs to be set in an adhoc way [24].
ReMark combines recursive as well as Markov clustering approach to cluster orthologs [5], [26].
Ortholuge [27] improves the specificity of ortholog detection by including an out-group species in ortholog detection. It adds phylogenetics to eliminate wrong results from RBBH method. All orthologs may not be identified using Ortholuge. For example, when that outgroup species is used in the analysis that is not having an ortholog corresponding to the sequence pair of two ingroups [27], [28]. Another major drawback of out-group based methods is that, it is not always clear that which out-group should be chosen for ortholog detection. [29].
OMA (Orthologous MAtrix) needs no out-group species for ortholog detection. It uses Smith- Waterman algorithm for alignments rather than BLAST scores as they have lower sensitivity. OMA method infers orthology by using evolutionary distance criteria instead of scores of alignment [2].
Different methods discussed here are fast but are not as reliable as the phylogenetic methods.
-
C. Other methods
Synteny based methods are also available for ortholog detection. These methods use conservation of neighboring genes of the genes of interest for ortholog detection [1], [30].
Protein network comparison is also used for ortholog predictions. In these methods, fraction of interactions preserved across two species is computed. False positives could be largely eliminated by focusing on interactions which are conserved in two species [31].
DODO (Domain based Detection of Orthologs) uses domain information for ortholog identification. This method can accurately detect orthologs in distantly related genomes, where the sequences have low sequence similarity. DODO has limitation that it cannot detect orthologs between sequences whose domain architecture is not evident. The accuracy of domain identification directly affects DODO’s performance [32].
-
III. Present Work
Different existing ortholog prediction methods predict orthologs by applying different algorithms on sequence dataset. Some methods apply phylogenetic approaches and others use sequence based comparisons to measure similarity and infer orthologs. Existing methods have different advantages and disadvantages. Different methods use different data sets for ortholog predictions. They cover a different range of sequences and cover different types of organisms. Numbers of proteins covered by them are different. Some orthologs of a protein are given by one method and some by other methods. In this way, we do not get an all possible set of orthologs of a protein to decide from, for further analysis. As each of the different tools and methods have different positives and negatives, it can be figured that combining the predictions of different ortholog detection methods for analysis, may be the best way forward in predicting high quality and close orthologs of a protein.
In the present study, a phylogenetic method for the detection of orthologs is described that works on the predictions of other methods as raw data. The method is implemented using MATLAB.
-
A. Collection of Input data
The method takes the predictions of ortholog detection methods as raw data. Input data is collected by incorporating the ortholog predictions of different ortholog detection methods. A Database containing the predictions of different ortholog detection methods is created. Protein sequence ortholog predictions were obtained from the Inparanoid database, OMA, PHOG [33] and FATCAT [34] web servers. For integrating the data from different ortholog detection databases the main problem encountered is the use of different gene identifiers by different ortholog detection databases. As different methods use different gene identifiers for representing gene sequences, a common set of gene identifiers is created by using UniProt’s ID mapping service [35], for merging the ortholog predictions of different methods. By using the ID mapping service of
UniProt, different sets of identifiers were converted to a uniform standard format of UniProt identifiers. UniProt identifiers consist of 6 digit letter codes of the form Q810A1, where Q810A1 is the UniProt identifier used by UniProt database to represent zinc finger 18 (ZNF_18) protein in mouse. The identifiers that were not present in the UniProt database and were not mapped by UniProt were mapped using UniProt archive, UniParc database. UniParc is a non-redundant database and is broad in scope. It contains almost all of the publicly available protein sequences. UniParc assigns a stable UPI, unique identifier to each protein sequence.
-
B. Creation of gene tree
After creating a uniform database of ortholog predictions, protein sequences were retrieved in fasta format for all the ortholog proteins from the UniProt database.
From the retrieved set of fasta sequences, a gene tree is created using neighbor joining method. Neighbor joining method of tree creation is used as it is fast and accurate. ClustalX 2.1, windows based multiple sequence alignment and tree creation program is used for the creation of gene tree. ClustalX is used as it provides a graphical user interface that is easy to operate. Protein sequences form the leaf nodes of the created gene tree and branches connecting different nodes represent evolutionary paths of different proteins.
-
C. Species-overlap algorithm
Gene tree created with ClustalX is read and speciesoverlap score is then used to label the nodes of the tree with speciation and duplication events. The step takes gene tree as input and labels the tree nodes with speciation or duplication events for identifying orthologs. A gene-species file containing the list of protein identifiers of the gene tree in one column and the corresponding species in which the protein is present in second column is required by the algorithm for mapping between proteins and their corresponding species.
To tag the internal nodes of the gene tree with speciation and duplication events, the algorithm proceeds through all nodes of the tree to carry out the following steps:
-
a) At each node of the gene tree, two tree divisions are identified that have child nodes associated with them.
-
b) An overlap score is calculated for each node, between the two divisions to look for the species that are common across the divisions, as:
number of species common to both partitions score = (1)
sumof species in both partitions
-
c) If the species-overlap score calculated for that node is more than the threshold t, the node is considered to be a duplication node else if the calculated score is less than the specified threshold then the node is considered to be a speciation node.
After tagging all the nodes of the gene tree with speciation or duplication events, orthologs can be obtained for any protein (protein of interest) by finding the last common ancestor of each protein in the gene tree and the protein of interest and then determining whether the last common ancestor is a speciation or a duplication node. If the last common ancestor is a speciation node, then the seed protein and the corresponding protein of the gene tree are taken as orthologs of each other and if the last common ancestor node of the proteins is a duplication node then they are considered to be paralogs of each other.
Species-overlap algorithm is mostly used with a threshold value of 0 (zero), as this threshold gives better ortholog predictions However, the value of the threshold can be adjusted from the user interface easily.
-
D. Filtering through patristic distances
With species-overlap, it is not possible to drill the orthology predictions down to the closest ortholog of a protein. Patristic distances also known as tree distances are thus used to filter high quality and close orthologs from species-overlap orthology predictions.
A Path on a tree is a set of branches, followed when we move from one taxonomic node to other. Patristic distance is the path length between two terminal nodes in the gene tree. These distances specify the evolutionary differences between genes. It is observed that the patristic distance between the protein and the orthologs of a protein is less as compared to the distance between the protein and its paralogs. Therefore, patristic distances can be used to filter close orthologs of a protein. These are computed by following paths through the branches of the tree and adding the patristic branch distances. A matrix created by calculating patristic distances between all pairs of genes or species summarizes the genetic change or phylogenetic change [36]. A Patristic distance matrix is calculated between terminal nodes of the gene tree. Distances are observed between the protein of interest and all other proteins in the gene tree and only those proteins where the patristic distance is less than the threshold value, p are retained as a set of orthologs for the protein. The proteins where distance between protein of interest (whose orthologs has to be found) and the target protein is larger than this threshold cutoff value are eliminated. By implementing this step ortholog sequences whose patristic distances are large and comparable to paralogs are eliminated.
Finally in the last step, ortholog proteins that satisfy the species overlap method and are below the patristic distance threshold are retained as final set of orthologs of the protein of interest.
The patristic distance cutoff can be adjusted as per the required level of closeness between the proteins. It allows the researchers to control the closeness between the protein of interest and other ortholog proteins in the fasta sequence file. The larger the distance between two proteins, the lesser is the similarity and closeness between them.
The cutoff can be reduced down to any level to get only the closest orthologs of a protein. The patristic distance cutoff provides the users with the flexibility to adjust the stringency of orthology predictions. Flowchart depicting the various steps of the method is shown in figure 2.
-
IV. Results And Discussion
In this section, the results of ortholog detection after the implementation of proposed method are discussed. The program is developed in MATLAB 7.12.0.635. The steps of the developed program for ortholog detection had been discussed in the earlier section. Main objective of the research is to develop a method to predict accurate and close orthologs of a protein in different species by integrating the orthologs predicted by different existing ortholog detection methods. Methods that incorporate the predictions of different existing ortholog detection methods have also been proposed earlier [13],[37-39], but these methods provide orthology predictions between fixed number of genes and species and are not flexible enough to predict orthologs of any single gene or protein in different species. These methods do not provide the users with the flexibility to adjust the ortholog predictions at different levels, down to the closest ortholog of a gene.
Set of input fasta sequences for the method is created by collecting ortholog predictions of four ortholog detection methods. The predictions of the methods were collected from their web servers. The methods used are Inparanoid8 (accessed: 13 Mar), PHOG (accessed: 23 Feb), OMA (accessed: 11 Mar), FATCAT (accessed: 12 Feb) and some paralog predictions from MetaPhOrs and Ensembl [40] database are also included. The paralog predictions were added to check the correctness of the program, so that it is functioning correctly and should not include any paralogs in its results. After integration, a fasta sequence file of a total of 79 sequences was created.
ClustalX version 2.1 is employed for gene tree creation. Neighbor joining algorithm is used for creating the gene tree. For labeling the nodes of the gene tree with speciation and duplication events, species overlap score is used. Use of species-overlap score, eliminates the need to perform the computation intensive task of tree reconciliation. A species overlap score threshold of 0 (zero) is used as it gives better results. This score cutoff implies that if the child nodes of the internal nodes belong to different species, only then it will be labeled as speciation else it will be labeled as duplication. The species overlap cutoff can be adjusted as per user needs from the interface very easily.
Orthologs predicted using species overlap method are further filtered to give high quality and close orthologs of a protein. Patristic distance threshold allows controlling the closeness between the protein of interest and other proteins in the FASTA sequence file. The more the distance between proteins, the lesser the similarity and closeness between them. The threshold can be adjusted to get high quality orthologs and controls the closeness between them. The proteins where distance between protein of interest (whose orthologs has to be found) and the target protein is larger than this threshold value are eliminated. A patristic distance cutoff of 0.89 is used as a distance threshold cutoff in the program. Below this threshold value only orthologs were found to exist and no paralogs were included in the result. This cutoff is chosen to include only orthologs with high accuracy. However, the cutoff can be reduced further to predict closer orthologs of a protein.
Table 1. Specifications of thresholds used by the program
|
Species-overlap score cutoff |
0 (zero) |
|
Patristic distance cutoff |
0.89 |
Using the program described and the appropriate values of thresholds, 24 orthologs in different species were identified for the protein Q810A1 (ZNF_18 mouse). The results of the program were benchmarked by taking the predictions from four ortholog detection methods as a gold standard. The methods taken are Inparanoid, OMA, FATCAT and PHOG. Using the above results the program generates an accuracy of 0.72 i.e. 72 percent. The precision i.e. the positive predictive value of the program is 1.
Table 2. Value of measures for ortholog detection program
|
Accuracy |
0.72 (72%) |
|
Precision |
1 |
|
Sensitivity |
0.52 |
|
Specificity |
1 |
The values of the above table are calculated using the equations:
(TP + TN)
Accuracy = (2)
(TP + FN + TN + FP)
TP
Precision = (3)
(TP + FP)
TP
Sensitivity = (4)
(TP + FN)
Specifcity = (5)
(TN + FP)
These values are calculated by obtaining true positives (TP), false positives (FP), true negatives (TN) and false negatives (FN). The output of the program contains only orthologs of the protein and no paralogs were included in the result set. Different ortholog prediction methods cover a different range of proteins and of different organisms but as the program takes the set of predictions of different methods as input; almost all orthologs of a protein are available for analysis.
An easy to operate and user friendly graphical interface is created that allows the beginners and other users to easily operate and control the system. The speciesoverlap score threshold and the patristic distance threshold can be adjusted and modified from the interface to take any value and set the stringency level of ortholog predictions. The lower the value of distance threshold and species-overlap cutoff, the more close orthologs of the protein of interest are generated
-
V. Conclusion And Future Scope
Orthologs are the homologous genes that arise from the ancestral gene due to speciation event. They play an important role in a number of bioinformatics areas like functional annotation, phylogenetic inference or genome evolution. Orthologs hold the same biological function through evolutionary course so they are used to infer the function of unstudied or newly sequenced genes from model or well studied species (those species whose large data and information are available).
Phylogenetic methods provide the best evolutionary view of genes. Use of species-overlap score, to map the nodes of the gene tree with speciation and duplication events eliminates the need to perform the computation intensive task of gene / species tree reconciliation. The orthologs predicted through species overlap are further filtered to give high quality orthologs using patristic distances. Threshold for patristic distances can be adjusted manually from the user interface to adjust the closeness of the protein and its orthologs. The appropriate selection of patristic distance threshold leads to better results.
A MATLAB based user friendly graphical interface is created. Such type of user friendly interface is not provided by the standalone versions of existing ortholog detection methods like Inparanoid, Ortholuge and some others. Different existing programs run efficiently on Linux operating system terminal, but require the users to have knowledge to run Perl or Python scripts on terminal. No graphical, easy to use standalone interface is provided by such methods. Graphical interface provided by the method is easy to operate and no extra knowledge is required to operate the system.
Comparison of some existing ortholog detection methods and the proposed method is given in Table 3 below. The proposed method is compared with existing systems with regard to some characteristics like execution speed, complexity and interface. From the table it can be inferred that the proposed methodology is capable in all respects of ortholog predictions, besides providing filtering of protein orthologs up to closest level, adjusting the stringency and closeness of ortholog predictions. Proposed method provides a good, user friendly standalone graphical interface that is easy to operate. The complexity of program is low that allows users to easily understand and control ortholog prediction results.
In the Table 4 (given below), comparison is done between the proposed ortholog detection method and the other integrated methods of ortholog detection. The existing methods display ortholog predictions by different methods but by themselves do not filter them to generate better results. But the proposed methodology collects the predictions of different orthology based methods and further filters them through species-overlap algorithm and whose results are further filtered by the concept of patristic distances.
Accuracy and quality of predictions of different methods can be compared by executing the methods on a common data set. Running the ortholog prediction program mentioned in ‘The Human Phylome’ Huerta-Cepas et al., 2007, [9] on the data set, generated the following results,
Table 5. Value of measures
|
Accuracy |
0.76 (76%) |
|
Precision |
0.91 |
|
Sensitivity |
0.67 |
|
Specificity |
0.90 |
Although, this method has higher accuracy than the proposed method but it missed certain orthologs like P17022 (mouse-human ortholog) and wrongly predicted some paralogs like O14778, A2T736 and D4A3X9.
The program is computationally easy to implement and generates good quality orthologs with much reduced complexity.
The proposed method can be extended to include synteny information of orthologs for more accurate ortholog identification. Domain information of orthologs can also be added to visualize the orthologs from the domain perspective. The program can be extended to display the functional information of ortholog proteins.
Table 3. Comparison of proposed and other ortholog prediction methods
|
Property Method |
Standalone-user program |
Interface |
Orthology predictions (web server) |
Complexity of program |
Freedom to control predictions |
Execution speed |
|
Inparanoid |
Yes |
Cmd |
Incomplete |
Average |
Yes |
Moderate |
|
OMA |
Yes |
Cmd |
Incomplete |
Average |
No |
Moderate |
|
FATCAT |
No |
--- |
Incomplete |
High |
Yes |
Slow |
|
PHOG |
No |
--- |
Incomplete |
Average |
Yes |
Moderate |
|
OrtholugeDB |
Yes |
Cmd |
Incomplete |
Average |
No |
Moderate |
|
LOFT |
Yes |
Graphical |
--- |
Low |
No |
Fast |
|
DODO |
Yes |
Cmd |
--- |
Low |
No |
--- |
|
TreeFam |
No |
--- |
--- |
High |
No |
Slow |
|
OrthoMCL |
Yes |
Cmd |
--- |
Average |
Yes |
--- |
|
Proposed |
Yes |
Graphical |
Complete |
Low |
Yes |
Fast |
Cmd = Command line
Table 4. Comparison of proposed method with other integrated methods
|
Property Method |
Standalone-user program |
Freedom to control predictions |
Complexity |
Enhance ortholog predictions |
Remarks |
|
YOGY |
No |
No |
Low |
No |
Only display tables of predictions |
|
DIOPT |
No |
No |
Low |
No |
Finds orthologs in single output species |
|
HCOP |
No |
Yes |
Low |
No |
Human centered |
|
MetaPhOrs |
No |
Yes |
High |
Yes |
Species-overlap only |
|
Proposed |
Yes |
Yes |
Low |
Yes |
Species-overlap + PD |
PD = Patristic distance
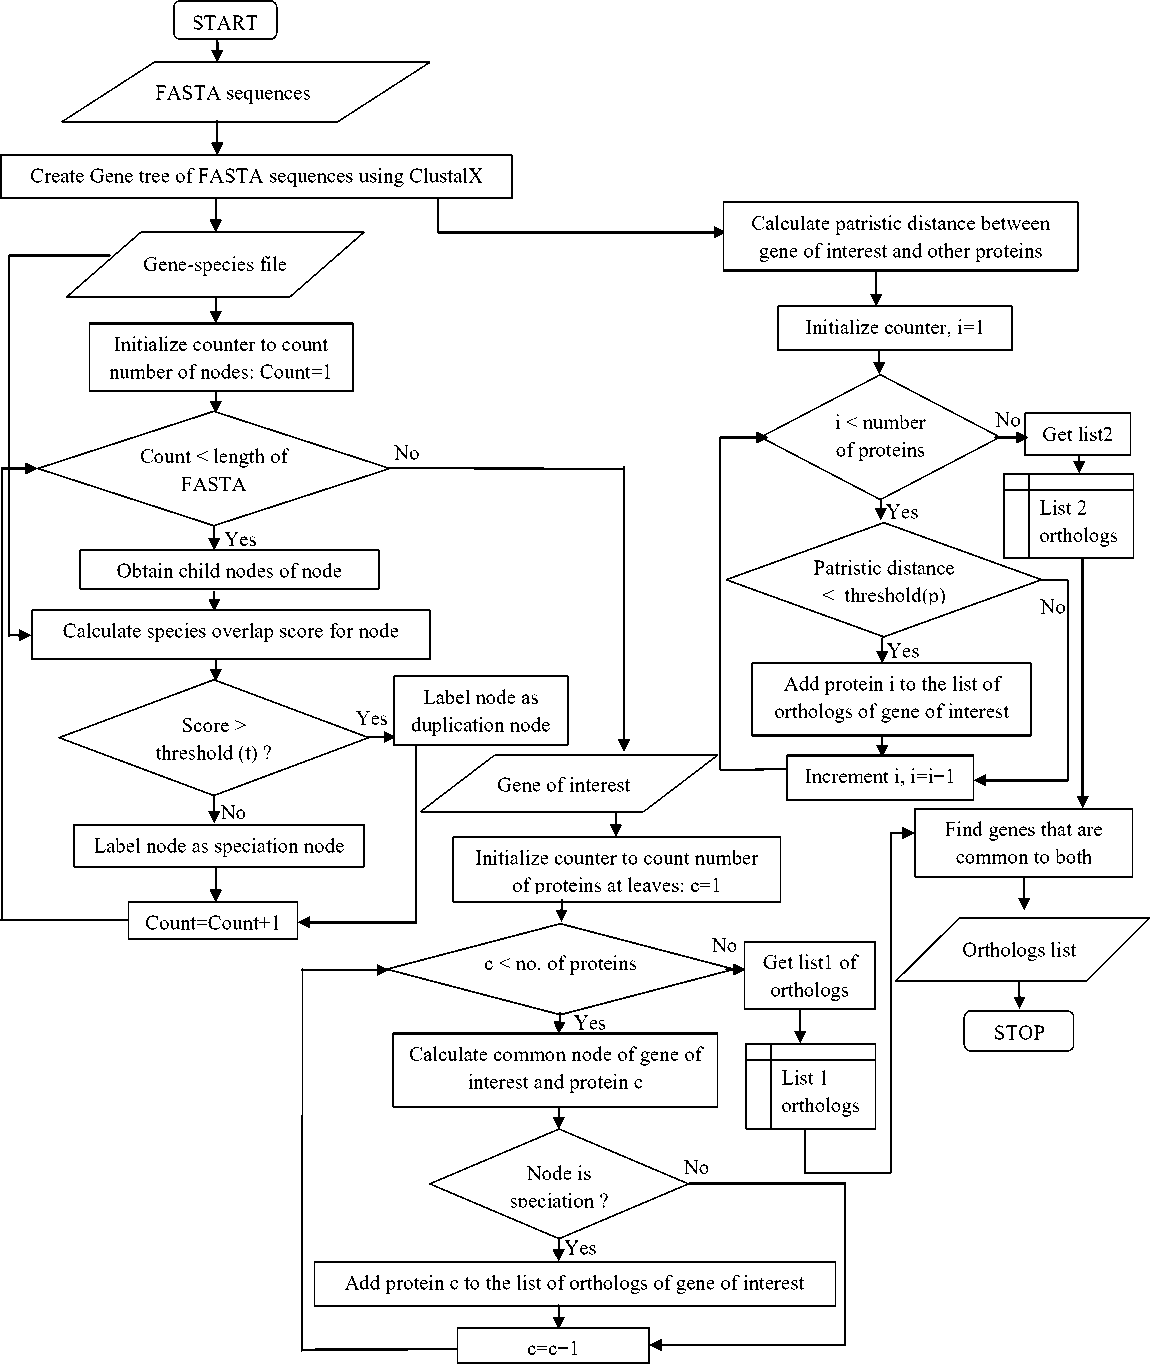
Fig. 2. Flowchart
