Physiological responses of safflower to exogenous putrescine under water deficit

Author: Toupchi Khosrowshahi Zhila, Slehi-Lisar Seyed Yahya, Ghassemi-Golezani Kazem, Motafakkerazad Rouhollah
Journal: Журнал стресс-физиологии и биохимии @jspb
Article in issue: 3 т.14, 2018.
Free access
Background: Drought stress is the most common abiotic stress factor which reduces the plant growth and development more than other factors. For this reason, identification of effective factors to increase drought tolerance of plants is necessary requirement. Many reports have been focused on the involvement of polyamines in plant response to abiotic stresses such as drought. Polyamines as growth regulators play important roles in keeping cell membrane stability and reducing ROS generation under water deficit. Carthamus tinctorius is an industrial, medicinal and oil crop from Asteraceae family. Many studies in other plants showed that polyamines increase tolerance to environmental stresses, but physiological responses of water-stressed safflower plants to putrescine is not clear. Thus, this research was carried out to investigate the physiological changes in safflower under different levels of water supply (100% and 40% field capacity) treated by putrescine (0, 40 and 60 µM)...
Antioxidants, carthamus tinctorius, drought stress, osmolytes, putrescine
Short address: https://sciup.org/143166691
IDR: 143166691
Text of the scientific article Physiological responses of safflower to exogenous putrescine under water deficit
Abiotic stresses are the most important factors limiting plant growth and metabolism. Drought is one of the most detrimental abiotic stress factors for plant growth (Krouma et al . 2015). Drought can affect different physiological and biochemical processes in plants (Mohammadi et al . 2016). Water deficit is characterized by reduction of water potential, CO2 assimilation due to stomata closure, production of reactive oxygen species (ROS), oxidative damage in chloroplasts, and reduction of chlorophyll contents, photosynthesis, cell enlargement and whole plant growth (Salehi-lisar & Bakhshayeshan-Agdam 2016). The severity of injury under drought stress is dependent on time of the stress, level of stress, inherent characteristics, and developmental stage of plants (Salehi-lisar & Bakhshayeshan-Agdam 2016).
Polyamines (PAs) such as putrescine (Put) could have essential roles in defense mechanism of plants against environmental stresses (Singh-Gill & Tuteja 2010). PAs are involved in scavenging of the free radicals, and regulating osmotic potential and proline metabolism under abiotic stresses (Gupta et al . 2013; Li et al . 2014). Some of the physiological processes such as cell division and plant development could be altered by these growth regulators (Singh-Gill & Tuteja 2010). Exogenous polyamine treatment in stressed-plants likely could lead to mitigation of injury and promotion of growth. Nevertheless, these effects are depended on type of polyamines, their concentration and plant species (Singh-Gill & Tuteja 2010). For example, PAs regulated drought stress tolerance of white clover that was related to antioxidative defense (Li et al . 2015). Also putrescine 0.1 mM induced antioxidative enzymes activities in Matricaria Chamomilla (Nazarli et al. 2015). Safflower ( Carthamus tinctorius L.) is important oilseed crop belonging to Asteraceae. Although, safflower is somewhat tolerant to drought stress, the physiological responses of this plant to polyamines such as putrescine under limited water supply is not clear. So, this research was conducted to investigate this subject in details.
MATERIALS AND METHODS
Experimental design and treatments
This experiment was carried out in a greenhouse with a factorial arrangement based on randomized complete block design with three replications. The seeds of spring safflower (cv. Goldasht) were supplied by East Azerbaijan Agricultural and Natural Resources Research Center (Tabriz, Iran). The seeds were pretreated by 5% (v/v) sodium-hypochlorite solution for 5 min and sufficiently washed using distilled water. In a preliminary experiment, plant performance under 100, 80, 60, 40, 20% FC was tested after three leaves stage for two weeks and 100% and 40% field capacity was selected as normal watering and water deficit treatments, respectively by measuring the growth and physiological parameters (data are not shown). In another preliminary experiment, stressed plants were treated with 0, 20, 40, 60, 80, 100 µM putrescine and 0, 40 and 60 µM were selected as the effective levels. After these pretests, the seeds were cultivated in plastic pots (15×15 cm) containing perlite. Thereafter, all the pots were irrigated up to 100% field capacity (FC) in a greenhouse with 25-30ºC, 60% humidity and 16/8 h light/dark conditions. The water loss of the pots was compensated by distilled water for the first 7 days, 50% Hogland solution from day 7 to day 14, and after that time with 100% Hogland solution until three leaves stage of plants. At this stage, plants were treated by different levels of watering (100% and 40% FC) and after two weeks, plants were sprayed with putrescine (0, 40 and 60 µM) just once. The appropriate amounts of putrescine for each treatment were dissolved in distilled water and sprayed on plants. The plants were gradually harvested after two weeks and physiological and biochemical traits were measured.
Growth parameters
Growth parameters such as shoot length, shoot and root fresh weight, fresh and dry weight of leaf and tap root length were measured. Plant organs were dried in an oven at 70 ºC for 48 h and their dry weight was recorded. Leaf area was determined by a graph paper.
Relative water content (RWC)
-
1974) . RWC was calculated as: RWC = (FW – DW / TW – DW) ×100
Photosynthetic pigments
Chlorophyll a, b and total carotenoids contents of fresh leaves were measured by a spectrophotometer (Dynamica, Halo- db-20 series, Switzerland). Briefly, 0.1 g of a fresh leaf sample was homogenized with 5 ml of 100% acetone. The absorbance of extracts was recorded at 645, 660 and 470 nm after 24 h (Sukran et al . 1998). The pigments contents were calculated as:
Chla=11.75 A662 - 2.35 A645
Chlb = 18.61 A645 - 3.96 A662
Carotenoid = 1000 A 470 - 2.27 Ca- 81.4 Cb / 227
Antioxidant enzymes activities
Fresh leaf and root samples (0.1 g) were homogenized in ice-cold phosphate - buffered solution (PBS, 50 mM). Homogenates were centrifuged at 10000 g for 10 min at 4 oC. Supernatant was used to determine the antioxidant enzymes activities and soluble protein content.
Catalase activity (CAT, EC 1.11.1.6) was assayed according to the methods of Chance and Maehly (1955) by a spectrophotometer using measurement of reduction in light absorption at 240 nm in 3 min after an initial lag period of 30 seconds . The reaction mixture contained 600 µL potassium phosphate buffer, 300 µL H2O2 (10 mM) and 100 µL enzyme extract. CAT specific activity
(unit mg-1 protein) was calculated using the extinction coefficient (39.4 mM-1 cm-1) for H2O2 and one unit of enzyme activity was considered as the amount of enzyme necessary for the reduction of 1 µM H2O2 per min.
Activity of superoxide dismutase (SOD, EC 1.15.1.1) was measured by determination of nitro-blue-tetrazolium (NBT) photo-reduction inhibition by the extracts (Winterbourn et al . 1976). 2.7 ml of potassium phosphate solution (1 M, pH 7.8), 100 µL of NBT (1.5 mM), 100 µL of EDTA (1 M) NaCN (0.3 mM), 50 µL of riboflavin and 50 µL of enzyme extract were mixed. The solutions were placed at light intensity of 5000 Lux for 12 min and the absorbance was recorded at 560 nm. The amount of the enzyme causing 50% inhibition of NBT photo-reduction was considered as one unit and SOD specific activity expressed as unit mg-1 protein.
Estimation of peroxidase (POX, EC 1.11.1.7) activity was carried out by recording the increase in absorbance at 470 nm during polymerization of guaiacol to tetraguaiacol for 3 min at intervals of 30s (Obinger et al . 1997). The 300 µL of guaiacol (4 mM), 350 µL of phosphate buffer (10 mM), 300 µL of H2O2 (50 mM) and 50 µL of enzyme extract were mixed. The reaction was initiated by adding H2O2 to reaction mixture, and POX specific activity (unit mg-1 protein) was calculated using the extinction coefficient of 26.6 mM-1 cm-1 for guaiacol. One unit of POX was defined as the amount of enzyme that caused the formation of 1 mM of tetraguaiacol per min.
Malondialdehyde (MDA), electrolyte leakage (EL) and H2O2
Leaf and root samples were homogenized using 3 ml of 0.1 trichlroacetic acid (TCA) and centrifuged at 10000 g for 5 min. The supernatant was added to 0.5% (w/v) tribarbitoric acid solution containing 20% (w/v) trichlroacetic acid. After heating for 30 min and rapid cooling, the absorbance of supernatant was measured at 530 nm. MDA concentration was calculated according to the standard curve prepared using 3, 1, 1, 3-tetraethoxy propane (0-100 µM) and expressed as µg g-
-
1 FW (Boominathan & Doran 2002).
The upper fully expanded leaf was detached and weighed, and then it was cut into three segments (1 cm2). Segments of every leaf were placed in a falcon containing 20 ml of double distilled water. Electrical conductivity (EC1) of samples was measured after 22 h. Then, the samples were transferred to 90 oC for 2 h and electrical conductivity (EC2) was measured again (Lutts et al . 1996). Finally, EL was calculated as: EL = (EC1 / EC2) × 100
Samples of 0.1 g leaves and roots (frozen powder) were homogenized with 5 ml of TCA 0.1% (w / v). The homogenate was centrifuged at 12000 g for 15 min at 4 oC. The 0.5 ml of supernatant, 0.5 ml of potassium phosphate buffer (10 mM, pH adapted to studied tissue) and 1 ml of KI (1M) were mixed at 4 oC for 10 min and kept at room temperature (about 25 oC) for 15 min. The absorbance of each sample was recorded at 390 nm. A calibration curve was provided by H2O2 standard solutions in TCA 0.1%, which was used for quantification of H2O2 content (µg g-1 FW) (Harinasut et al . 2003).
Total flavonoid, phenol and anthocyanin contents
The fresh leaves or roots (0.1 g) were homogenized using 5 ml of 80% methanol. Then, the solutions were centrifuged at 10000 g for 5 min and supernatants were used for determination of total flavonoid and phenol contents. All of the samples were kept in the dark. For quantification of flavonoids content, 1.5 ml of 80% methanol, 100 µL of 10% aluminum chloride, 100 µL of 1 M potassium acetate, and 2.8 ml of distilled water were mixed with 500 µL of each extract. After 40 min, mixture absorbance was measured at 415 nm. Quercetin (Q) was used to prepare the calibration curve (1-100 µg) and flavonoids content was reported as mg E Q g-1 FW (Chang et al. 2002). Total phenol measurement was performed by adding 2.8 ml of distilled water, 2 ml sodium carbonate 2%, and 100 µL of 50% Folin- cio-calteu reagent to 100 µL of each extract. After 30 min, absorbance of mixture was measured at 720 nm. Galic acid (GA) was used to provide the calibration curve and total phenol contents were reported as mg E GA g-1 FW (Meda et al. 2005).
Dry shoot (0.02 g) was grinded with 4 ml of 1% hydrochloric acid containing methanol. The solution was kept in the refrigerator for 24 h and then centrifuged for 10 min at 13000 g. Absorbance of the supernatant was measured at 530 nm and 657 nm. Anthocyanins content of each extract was calculated using the following equation according to the method described by Mita et al . (1997): A = A530 - (0.25 × A657) where, A shows absorbance of the solution (subscripts indicate the wavelengths at which the absorbance were recorded).
Soluble and insoluble sugars
Total soluble and insoluble sugars of leaf and root tissues were determined by the phenol sulfuric acid method as described by Kochert et al . (1978). Briefly, 5 ml of ethanol (70%) was added to 0.05 g of dry shoot and root samples and maintained in refrigerator for one week. Then, the mixture was centrifuged at 10000 g for 15 min at room temperature and supernatant and obtained sediment were used for determination of soluble and insoluble sugars content, respectively. Glucose was used to prepare a standard curve and data was expressed as mg g-1 DW.
Proline content assay
For evaluation of free proline, 0.1 g of fresh leaf or root samples were homogenized by using 2 ml of sulfu-salicylic acid 3%. Then, homogenates were centrifuged at 2000 g for 10 min and supernatant used for quantification of free proline by spectrophotometer at 520 nm. The reaction mixture contained 2 ml of ninhydrin (25% w/v), 2 of ml acetic acid and 2 ml of the extract. Samples were placed for 1 h in boiling water. Reaction was then stopped by ice bath. Then, 2 ml of toluene was added to the mixture and the upper phase used to measure the absorbance (Bates et al . 1973). Free proline content was calculated as μg g-1 FW, using a standard curve which was prepared by L. proline (0 -50 µL).
Total soluble protein and free amino acids
Statistical analysis
Analysis of variances (ANOVA) of the data were performed for all the traits by SAS (9.2) software. Means were compared according to Duncan multiple range test at p ≤ 0.05 and Excel 2013 software was used to draw the Figures.
RESULTS
Growth parameters
Drought stress and putrescine levels showed a significant interaction (p ≤ 0.01) for growth parameters, RWC and leaf photosynthetic pigments. Growth parameters significantly increased by foliar spray of putrescine in stressed plants. Fresh weight of roots, shoots, leaves and dry weight of leaves increased 4.17 fold, 1.86 fold, 2.53 fold and 3.05 fold in treated plants with 60 µM putrescine under water deficit, respectively comparison with untreated plants. The highest leaf area under stress was observed in plants treated with 60 µM putrescine. In non-stressed plants, foliar spray of 40 µM putrescine was more effective than 60 µM in improving growth parameters (Table 1).
Photosynthetic pigments contents
Putrescine considerably enhanced chl a, b and carotenoid contents in drought-stressed plants. Chlorophyll a content in plants treated with 60 µM putrescine was significantly higher than 40 µM treatment under water deficit. However, 40 µM putrescine was a superior treatment for enhancing photosynthetic pigments under well-watering (Figure 1A, B, C).
Leaf relative water content
Putrescine application increased RWC under water deficit. Putrescine treatment in non-stressed plants, significantly reduced RWC compared with untreated plants (Figure 2 A).
Antioxidant enzymes
The interaction of water deficit × putrescine treatment was also significant for the antioxidant enzymes activities of safflower leaves and roots (p ≤ 0.01). Antioxidant enzymes showed higher activities with 60 µM putrescine than 40 µM treatment in leaves of the stressed plants. 40 µM putrescine significantly enhanced POX activity in roots of stressed plants. Application of 40 µM putrescine in non-stressed plants significantly increased studied antioxidant enzymes activities in leaves and roots (Table 2).
Lipid peroxidation, H2O2 content and EL
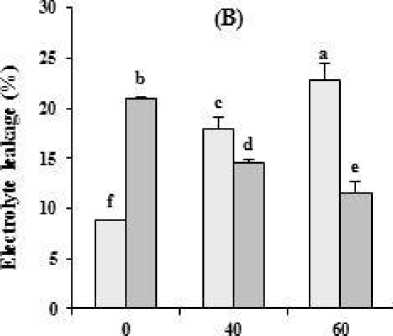
The interaction of water limitation × putrescine treatment was significant for MDA, H2O2 and EL in safflower (p ≤ 0.01). Putrescine significantly reduced MDA and EL under drought treatment in leaves. The lowest EL was observed in stressed plants treated with 60 µM putrescine. MDA content in leaves or roots of plants treated by 60 µM putescine under water deficit were 2.08 and 2.33 times lower than the plants treated only by water deficit, respectively. Exogenous putrescine decreased MDA content in roots of stressed plants. Putrescine spraying significantly decreased H2O2 content in leaves and increased in roots under stress condition. In the non-stressed plants, putrescine increased H2O2 and EL in leaves and decreased in roots (Table 2, Figure 2 B).
Total flavonoid, phenol and anthocyanin contents
Water deficit and putrescine levels showed a significant interaction on total flavonoid, phenol and anthocyanin contents of safflower leaves and roots (p ≤ 0.01). 60 µM putrescine enhanced total phenol in leaves and anthocyanin contents in shoots under water limitation compared with untreated plants. Total phenols in roots significantly enhanced with putrescine in stressed and non-stressed plants. In non-stressed plants, putrescine application significantly reduced total phenols, flavonoid (in leaves) and anthocyanin contents in shoots and enhanced them in roots (Table 3).
Osmolytes
The interaction of drought stress × putrescine treatment was significant (p ≤ 0.01) for osmolytes of safflower in shoots, leaves and roots. Soluble sugars (in shoots, roots) and proline contents in leaves and roots significantly decreased with putrescine application under water deficit. 60 µM putrescine significantly increased protein content in leaves of stressed plants. Putrescine
60 µM in non-stressed plants significantly reduced leaves and roots protein contents. In these plants, effect of putrescine on soluble sugars (shoots, roots) and proline contents (leaves, roots) was different related to concentrations (Table 4).
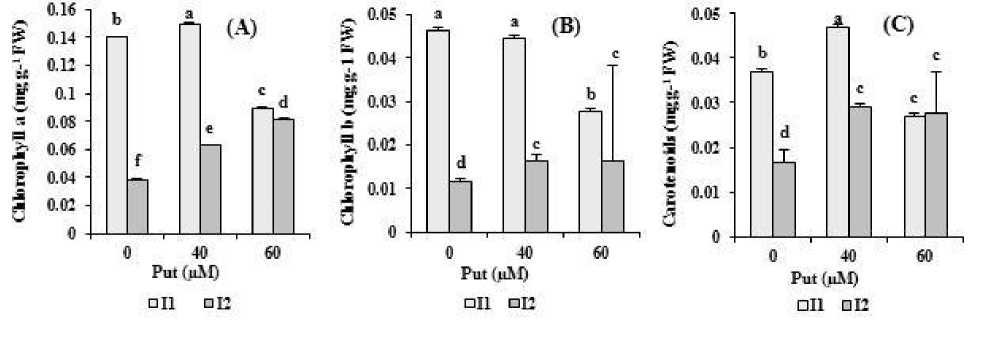
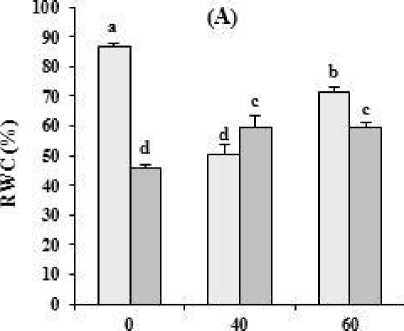
Figure 1. The effect of different concentrations of putrescine on photosynthetic pigments content (A) chlorophyll a, (B) chlorophyll b, (C) carotenoids of safflower plants under different levels of watering. The data represent the mean of three replications ± SD. Different letters indicate significant difference at p ≤ 0.05. I 1 , I 2 : 100% and 40% Field Capacity, respectively.
Put QAO
Put (uAI) □ Il aI2
□ Il DI2
Figure 2. The effect of different concentrations of putrescine on (A) relative water content (B) electrolyte leakage in safflower plants under different levels of watering. The data represent the mean of three replications ± SD. Different letters indicate significant difference at p ≤ 0.05. I 1 , I 2 : 100% and 40% Field Capacity, respectively.
Table 1: Effect of different rates of putrescine on growth parameters of safflower plants under different levels of watering.
|
Water |
Put |
Tap root length |
Root FW Shoot length Shoot FW Leaf FW Leaf DW |
Leaf area |
|
supply |
(µM) |
(cm) |
(mg) (cm) (mg) (mg) (mg) |
(mm2 ) |
|
0 |
12.83±0.28cd |
160±11.93d 19.50±0.50a624±40.73b35.33±1.52ab3.66±0.57b |
203.1±11.67a |
|
|
I1 |
40 |
15.83±1.44ab |
546±25.16a 16.66±0.57b 756±45.61a 46.66±1.52a 3.83±0.76b |
206.3±14.84a |
|
60 |
14.50±0.50bc |
219±15.09c 16.16±0.57b 476±35.36c 35.00±1.00ab 4.00±0.10b |
200.3±1.52ab |
|
|
0 |
12.16±1.15d |
105±8.66e 9.66±0.28e 250±8.62e 20.00±1.50b 2.16±0.28c |
102.5±2.50c |
|
|
I2 |
40 |
17.83±1.04a |
216±11.54c 12.16±0.57d333±15.27d33.33±1.52ab3.33±0.57b |
163.5±9.79b |
|
60 |
17.83±1.89a |
438±24.66b 14.33±0.28c 466±11.84c 50.66±1.15a 6.60±0.52a 179.2±13.76ab |
||
The data represent the mean of three replications ± SD. Different letters indicate significant difference at p ≤ 0.05. I 1 , I 2 : 100% and 40% Field Capacity, respectively.
Table 2: Changes in antioxidant enzymes activities, MDA and H 2 O 2 contents in leaf and root of safflower plants grown under different levels of watering treated by putrescine.
|
Water supply |
Put (µM) |
APX (unit mg-1 protein) |
CAT (unit mg-1 protein) |
SOD (unit mg-1 protein) |
POX (unit mg-1 protein) |
MDA (µg g-1 FW ) |
H2O2 (µM g-1 FW ) |
|
Leaf |
|||||||
|
0 |
7.48±0.005d |
0.31±0.01d |
2.01±0.26c |
1.62±0.09d |
28.66±0.12c |
37.46±0.12f |
|
|
I1 |
40 |
10.56±0.11c |
0.39±0.02c |
2.61±0.03b |
2.05±0.01c |
19.86±0.10e |
54.51±0.64c |
|
60 |
7.11±0.09d |
0.45±0.05c |
2.09±0.32c |
1.78±0.12d |
12.20±0.78f |
51.03±0.008d |
|
|
0 |
13.56±0.51b |
0.41±0.04c |
2.55±0.22b |
1.74±0.09d |
53.26±0.03a |
113.91±0.07a |
|
|
I2 |
40 |
6.89±0.79d |
0.90±0.06b |
2.24±0.22bc |
2.42±0.08b |
31.37±0.87b |
46.55±0.43e |
|
60 |
14.97±0.28a |
1.22±0.01a |
4.92±0.17a |
4.61±0.13a |
25.54±0.19d |
79.53±0.28b |
|
|
Root |
|||||||
|
0 |
7.83±0.30e |
0.14±0.009c |
2.13±0.33d |
2.23±0.04d |
17.97±0.82b |
85.03±0.10b |
|
|
I1 |
40 |
8.96±0.27d |
0.27±0.11b |
3.74±0.35b |
4.30±0.37c |
14.98±0.69c |
40.49±1.20d |
|
60 |
21.36±0.39a |
0.093±0.02c |
5.01±0.01a |
1.24±0.05e |
19.02±0.19b |
66.83±1.13c |
|
|
0 |
11.08±0.01b |
0.75±0.05a |
2.85±0.31c |
6.36±0.31b |
22.55±0.97a |
33.57±0.15e |
|
|
I2 |
40 |
5.83±0.09f |
0.11±0.002c |
1.96±0.12d |
9.93±0.15a |
14.02±0.32c |
168.3±0.63a |
|
60 |
10.22±0.10c |
0.14±0.002c |
3.17±0.19c |
6.19±0.25b |
9.69±0.79d |
66.66±0.87c |
|
The data represent the mean of three replications ± SD. Different letters indicate significant difference at p ≤ 0.05. I 1 , I 2 : 100% and 40% Field Capacity, respectively.
Table 3: Total flavonoid, phenol and anthocyanin contents in leaf, shoot and root of safflower plant affected by putrescine under different levels of watering
|
Water supply |
Put (µM) |
Total flavonoids (mg EQ g-1 FW ) |
Total phenols (mg E GA g-1 FW ) |
Total anthocyanins (mg g-1 DW) |
|
Leaf |
Leaf |
Shoot |
||
|
0 |
1.62±0.12a |
39.62±1.37a |
3.07±0.30b |
|
|
I1 |
40 |
1.23±0.07b |
24.53±1.07b |
1.39±0.01d |
|
60 |
0.70±0.11c |
12.37±0.74d |
1.68±0.33d |
|
|
0 |
1.53±0.10a |
24.31±1.81b |
2.05±0.10c |
|
|
I2 |
40 |
1.66±0.12a |
16.77±0.82c |
4.03±0.02a |
|
60 |
0.54±0.15c |
38.95±1.63a |
4.01±0.06a |
|
|
Root |
||||
|
0 |
0.14±0.03d |
1.28±0.17c |
0.23±0.01b |
|
|
I1 |
40 |
0.38±0.01c |
4.66±0.84b |
0.24±0.008b |
|
60 |
0.97±0.03a |
3.96±0.26b |
0.53±0.003a |
|
|
0 |
0.58±0.02b |
1.21±0.63d |
0.16±0.001c |
|
|
I2 |
40 |
0.21±0.04d |
4.64±0.44b |
0.17±0.03c |
|
60 |
0.39±0.10c |
6.53±0.58a |
0.06±0.03d |
|
The data represent the mean of three replications ± SD. Different letters indicate significant difference at p ≤ 0.05. I 1 , I 2 : 100% and 40% Field Capacity, respectively.
Table 4: The effect of different rates of putrescine on soluble and insoluble sugars contents, proline, soluble protein content, total free amino acids, in plant.
|
Water |
Put |
Soluble sugars Insoluble sugars |
Proline |
Total soluble protein Total free amino acid |
||
|
supply |
(µM) |
(mg g-1 DW) |
(mg g-1 DW) |
(µg g-1FW) |
(mg g-1 FW) |
(mg g-1 FW)) |
|
Shoot |
Leaf |
|||||
|
0 |
27/17±1.45d |
35.76±0.73a |
3.66±0.33bc |
22.72±0.08a |
0.31±0.01d |
|
|
I1 |
40 |
20.81±0.84e |
19.00±0.96e |
3.05±0.35cd |
13.63±0.11b |
0.33±0.01d |
|
60 |
30.99±1.00c |
29.99±1.94b |
3.89±0.37b |
11.64±0.12d |
0.52±0.002b |
|
|
0 |
39.42±1.44a |
21.20±1.78d |
7.36±0.14a |
11.31±0.04e |
0.74±0.01a |
|
|
I2 |
40 |
31.31±0.42bc |
28/78±0.51b |
4.09±0.41b |
4.52±0.04f |
0.42±0.002c |
|
60 |
32.52±1.15b |
25.59±0.61c |
2.84±0.43d |
12.84±0.34c |
0.34±0.02d |
|
|
Root |
||||||
|
0 |
10.61±0.60a |
8.73±0.34c |
1.56±0.08d |
12.77±0.09a |
0.39±0.01c |
|
|
I1 |
40 |
5.75±0.61d |
9.13±0.59c |
2.27±0.16c |
7.25±0.08f |
0.33±0.02d |
|
60 |
3.88±0.39e |
13.35±0.39b |
1.27±0.04e |
8.36±0.01d |
0.57±0.03a |
|
|
0 |
8.17±0.44b |
16.11±1.04a |
3.05±0.05a |
8.23±0.003e |
0.28±0.01e |
|
|
I2 |
40 |
6.36±0.05cd |
7.51±0.76d |
2.48±0.04b |
9.91±0.04c |
0.33±0.02d |
|
60 |
6.82±0.34c |
8.66±0.45c |
2.45±0.005b |
10.38±0.09b |
0.34±0.0.3d |
|
The data represent the mean of three replications ± SD. Different letters indicate significant difference at p ≤ 0.05. I 1 , I 2 : 100% and 40% Field Capacity, respectively.
DISCUSSION
Drought stress had negative effect on growth of safflower plants. Decreasing growth parameters, RWC and photosynthetic pigment contents under drought stress could be due to stomata closuring and decreasing CO2 diffusion into leaves that can lead to lower chlorophyll levels and photosynthesis, induction of oxidative stress and finally lower growth rate in plants (Krouma et al . 2015; Saruhan et al . 2012). Improving tap root length is an important functional trait for survival under water limitation. Increasing studied growth parameters, RWC and photosynthetic pigments contents with putrescine spraying can be related to antioxidative property of putrescine as well as its role as osmolyte under water deficit. This finding is similar to those of Nazarli et al . (2015) who suggested that putrescine alleviate the negative effects of water deficit and improves growth in Matricaria chamomilla . Enhancing fresh weight of leaves and roots in non-stressed plants with putrescine application probably was attributed to above mentioned roles of this polyamine.
Plants can use enzymatic and non-enzymatic mechanisms for ROS scavenging in order to alleviation of oxidative stress damage under stress condition (Salehi-lisar & Bakhshayeshan-Agdam 2016). Zhou et al. (2015) put forth that increasing antioxidant enzyme activity cause to enhance resistance to drought stress in white clover. Increasing APX, CAT, SOD and POX activities in leaves SOD and POX activities in roots with 60 µM putrescine indicated that safflower use these enzymes for protecting against destructive e ff ects of H2O2 and membrane damages. Numerous studies have demonstrated that polyamines application improves CAT, SOD and POX activities (Li et al . 2015; Zhou et al . 2015; Hanafy Ahmed et al . 2017). Generally, polyamines can activate antioxidant enzymes and modulate ROS homeostasis and oxidative damage by inhibiting accumulation of H2O2 (Singh-Gill & Tuteja 2010).
Plants produce high levels of osmolytes for increasing resistance to drought (Mohammadi et al . 2016). Increasing soluble sugars in stressed plants could be attributed to enhancing invertase and amylase activities and reducing consumption of soluble sugars. Proline is well-known compatible osmolyte (Salehi-lisar & Bakhshayeshan-Agdam 2016) and also it can protect membrane from damage by ROS (Razavizadeh et al .
2017). Enhancing proline under water deficit could be the result of increasing pyrroline-5-carboxylate synthase (P5C5) activity. Mohammadi et al . (2016) reported that proline and soluble sugars increase under water deficit in safflower. Decreasing proline in leaves and roots of plants treated with putrescine under drought stress could be due to enhancing chlorophyll synthesis, since both chlorophyll and proline are synthesized from same precursor (glutamate) (Mohammadi et al . 2016). In addition, putrescine can act as osmoticum as well as scavenger of ROS (two main functions of proline) and mitigated harmful effects of the stress (Hanafy Ahmed et al . 2017).
Reducing leaves protein contents in water limitation could be associated with protein degradation by protease which reported previously by Mohammadi et al . (2016). Proteins accumulation in leaves and roots of stressed-plants treated by putrescine have likely role in osmotic regulation. Improving proteins might be due to de novo synthesis in response to the stress (Saruhan et al . 2012).
References Physiological responses of safflower to exogenous putrescine under water deficit
- Amooaghaie R., Moghym S. (2011) Effect of polyamines on thermo tolerance and membrane stability of soybean seedling. Afr. J. Biotechnol., 10, 9673-9679
- Bates L, Waldren S.P., Teare I.D. (1973) Rapid determination of free proline for water-stress studies. Plant Soil. 39, 205-207
- Boominathan R., Doran P.M. (2002) Ni-Induced oxidative stress in roots of the Ni hyper accumulator, Alyssum bertolonii. New Phytol. 156, 205-215
- Bradford M. (1976) A rapid and sensitive method for the quantitation of quantities of protein utilizing the principle of protein-dye binding. Anal. Biochem., 72, 248-254
- Chance B., Mealy A.C. (1955) Assay of catalases and peroxidases. Methods Enzymol., 11, 764-755
- Chang C., Yang M., Wen H., Chern J. (2002) Estimation of total flavonoid content in propolis by two complementary colorimetric methods. J. Food Drug Anal., 10, 178-182
- Gupta K., Dey A., Gupta B. (2013) Plant polyamines in abiotic stress responses. Acta Physiol Plant., 35, 1-2
- Hanafy Ahmed A.H., Darvish E., Alobaidy M.G. (2017) Impact of putrescine and 24-epibrassinolide on growth, yield and chemical constituents of cotton (Gossypium barbadense L.) plant grown under drought stress conditions. Asian J. Plant Sci., 16, 9-23
- Harinasut P., Poonsopa D., Roengmongkol K., Charoensataporn R. (2003) Salinity effects on antioxidant enzymes in mulberry cultivar. Sci. Asia., 29, 109-113
- Hojati M., Modarres-Sanavy S.M., Karimi M. Ghanati F. (2011) Responses of growth and antioxidant systems in Carthamus tinctorius under water deficit stress, Acta Physiol. Plant., 33, 105-112
- Hwang M., Ederer G.M. (1975) Rapid hippurate hydrolysis method for presumptive identification of group B streptococci. J. Clin. Microbiol., 1, 14-115
- Kochert G. (1978) Carbohydrate determination by the phenol sulfuric acid method, In Helebust, J. A., Craig, J. S. (ed) Handbook physiological methods, Cambridge university, Press Cambridge, 9697
- Krouma A., Fujimura T. Abdely C (2015) Growth, photosynthetic activity and water relations three Tunsian chickpea genotypes (Cicer arietinum L.) subjected to a progressive water deficit stress. Int. Res. J., 5, 206-214
- Li Z., Peng Y., Zhang X.Q., Pan MH, Ma X., Huang L.K. (2014) Exogenous spermidine improves water stress tolerance of white clover (Trifolium repens L.) involved in antioxidant defence, gene expression and proline metabolism. Plant Omics., 7, 517-526
- Li Z., Jing W., Peng Y., Zhang X.Q. Huang L.K. (2015) Spermine alleviates drought stress in white clover with different resistance by influencing carbohydrate metabolism and dehydrins synthesis. PLoS J., 10, 250-258
- Lutts S., Kinet J.M., Bouharmont J. (1996) NaCl-induced senescence in leaves of rice (Oryza sativa L.) cultivars differing in salinity resistance. Ann. Bot., 78, 389-398
- Meda A., Lamien C.E., Romito M., Millogo J., Nacoulma O.G. (2005) Determination of the total phenolic, flavonoid and proline contents in BurkinaFasan honey, as well as their radical scavenging activity. Food Chem., 91: 571-577
- Mita S., Murano N., Akaike M., Nakamura K. (1997) Mutants of Arabidopsis thaliana with pleiotropic effects on the expression of the gen for beta-amylase and on the accumulation of anthocyanin that is inducible by sugars. Plant J., 11, 841-851
- Mohammadi M., Ghassemi-Golezani K., Zehtab-Salmasi S., Nasrollahzade S. (2016) Assessment of some physiological traits in spring safflower (Carthamus tinctorius L.) cultivars under water stress. Int. J. Life Sci., 10, 58-64
- Nazarli H., Hadian J., Ahmadi A. (2015) Evaluation of putrescine effect in drought tolerance inducing and changing of enzyme activities in Matricaria Chamomilla L. plant. Iran. J. Agric. Sci., 4, 222-293
- Obinger C., Maj M., Nicholls P., Loewen P. (1997) Activity, peroxide compound formation, and heme d synthesis in Escherichia coli HPII catalase. Arch Biochem. Biophys., 342, 58-67
- Razavizadeh R., Adabavazeh F., Rostami F., Teimouri A. (2017) Comparative study of osmotic stress effects on the defense mechanisms and secondary metabolites in Carum copticum seedling and callus. J. Plant Proc. Funct., 18, 23-33
- Salehi-lisar S.Y., Bakhshayeshan-Agdam H. (2016) Drought stress tolerance in plants: causes, consequences and tolerance. In: Hossain MA, Wani ShH, Bhattacharjee S, Burritt DJ, Phan Tran Lam-Son, Editors. Springer Press, pp. 35-60
- Saruhan N., Turgut Terzi R., Kadioglu A. (2012) The effects of exogenous polyamines on some biochemical changes during drought stress in Ctenanthe setosa (Rosc.) Eichler. Acta Biol. Hung., 57, 221-229
- Singh-Gill S., Tuteja N. (2010) Polyamines and abiotic stress tolerance in plants. Plant Signal. Behav., 5, 26-31
- Smart R E Bingham G.E. (1974) Rapid estimates of relative water content. Plant Physiol., 53, 258-260
- Sukran D., Gunes T., Sivaci R. (1998) Spectrophotometric determination of chlorophyll A, B and total carotenoid contents of some algae species using different solvents. Turk. J. Bot., 22, 13-18
- Winterbourn C.C., Mc Grath B.W., Carrell R.W. (1976) Reactions involving superoxide and normal unstable hemoglobins. Biochem. J., 155, 493-502
- Zamani Z., Niakan M., Gorbanly M. (2013) Effect of exogenous putrescine in phenolic composition, antioxidant enzymes and nitrate reductase of Hyosyamus niger under drought stress. J. Iran. Plant Ecophysiol. Res., 3, 78-90
- Zhou L., Yn Zh., Danda P., Xiaojan W., Yan P., Yan Y. (2015) Polyamine regulates tolerance to water stress in leaves of white clover associated with antioxidant defense and dehydrin genes via involvement in calcium messenger system and hydrogen peroxide signaling. Front Pysiol., 6, 1-16
