Potential Study of Parallel Dipoles Line Technology as Tiltmeter Sensor for Geotechnical Applications

Author: Indra Hartarto Tambunan, Andi Ray Hutauruk, Philippians Manurung, Amsal Sinambela, Febrian Cornellius Sidabutar
Journal: International Journal of Information Engineering and Electronic Business @ijieeb
Article in issue: 1 vol.18, 2026.
Free access
Tiltmeters with high accuracy and sensitivity are indispensable for various geotechnical applications, including soil deformation monitoring, structural inclination analysis, and seismic activity assessment. This study proposes a novel tiltmeter system utilizing Parallel Dipole Line (PDL) technology, where a diamagnetic graphite cylinder is levitated within a camelback potential field generated by parallel magnetic dipoles. Variations in the vertical position of the graphite cylinder correspond to tilt angles, which are captured by a high-resolution imaging system and processed using a Jetson Nano microcomputer for real-time analysis. Experimental results show that shorter graphite lengths can increase the measurement range. One of the test results is that 6 mm graphite can measure inclination in the range of -1.00000° to +0.99999°. In contrast, longer graphite, such as 12 mm, only reaches a range of -0.60000° to +0.60434°. In addition, the increase in graphite length and the reduction in magnet dimensions significantly help reduce oscillations during measurement, which ultimately improves system stability. The optimized PDL-based tiltmeter is capable of detecting inclination with a high resolution of up to 10⁻⁵ degrees, with critical damping used to eliminate oscillatory interference. These findings confirm that the PDL tiltmeter system offers much better precision, stability, and durability than conventional methods, making it a potential innovative tool for high-resolution geotechnical and structural monitoring.
Geotechnical Sensor, Graphite Cylinder, Jetson Nano, Parallel Dipole Line, Tiltmeter
Short address: https://sciup.org/15020165
IDR: 15020165 | DOI: 10.5815/ijieeb.2026.01.06
Text of the scientific article Potential Study of Parallel Dipoles Line Technology as Tiltmeter Sensor for Geotechnical Applications
Tiltmeters are crucial tools in geotechnical and structural monitoring, designed to detect small changes in soil inclination, structural deformation, and seismic activity [1-5]. Their application is vital in managing risks associated with landslides, slope stability, and the safety of critical infrastructures such as bridges and dams [6-8]. Despite their importance, conventional technologies face limitations, prompting researchers to explore innovative solutions that integrate advances in material science, sensor development, and signal processing. With the increasing demand for accuracy and stability, research has been continuously directed toward the development of high-precision tiltmeters [911]. Conventional technologies, such as mechanical and fiber-optic inclinometers, face limitations, including long-term drift, sensitivity to external interference, and instability in extreme environments [12-14]. As an alternative, diamagnetic levitation based on Parallel Dipole Line (PDL) has emerged as an innovative solution. PDL generates a camelbackshaped magnetic potential field, enabling stable levitation of graphite without mechanical contact [15,16]. This technology not only enhances sensitivity but also mitigates mechanical oscillations that often interfere with high-precision measurements [17,18].
The use of tiltmeter networks for large-area landslide monitoring has demonstrated high reliability in mitigating geotechnical and infrastructure risks [7,19-21]. Integrating magnetic levitation technology into modern sensors significantly enhances the sensitivity of tilt measurements, which is crucial for geotechnical applications [18]. Real-time data processing has also emerged as a key enabler for the success of such systems. Advanced devices like Jetson Nano facilitate rapid and precise data analysis, making it possible to detect subtle angular changes with high accuracy [22, 23]. The synergy of PDL technology and real-time processing opens new possibilities for monitoring soil deformation and structural behavior [9,22,24-27].
This research focuses on designing and evaluating a tiltmeter system based on Parallel Dipole Line (PDL) technology to tackle key challenges in geotechnical monitoring. By employing diamagnetic levitation, the system achieves exceptional sensitivity, capable of detecting tilt changes as minute as 10-5° (0.00001°) [28,29], ensuring high accuracy in detecting minor angular deviations [1,16]. Precision in measurements is further enhanced by optimizing the length of the graphite and the size of the magnets, which reduces oscillations and improves stability [30]. To ensure the system is efficient and responsive, Jetson Nanotechnology is incorporated, allowing for real-time data processing and adaptive monitoring in dynamic conditions [22,23,31,32]. Field applications, including slope stability monitoring, structural deformation analysis, and seismic activity assessment, validate the system's versatility and effectiveness [33, 34]. This integrated approach underscores the tiltmeter's potential as a transformative tool for geotechnical and structural health monitoring.
This study also highlights key advancements in tiltmeter design and application. The use of Parallel Dipole Line (PDL) technology allows for the adaptation of camelback potential fields to improve tilt measurement accuracy, addressing long-standing challenges in sensitivity and stability, as noted in earlier research [35,36]. Further, the optimization of system parameters such as graphite length and magnet dimensions ensures superior performance by striking a balance between sensitivity and stability [15,17,37]. Jetson Nanotechnology plays a pivotal role in supporting real-time structural deformation analysis, demonstrating its effectiveness in practical settings [31]. Additionally, advanced techniques to dampen oscillations, achieved by fine-tuning magnetic field configurations, greatly enhance the system's precision and reliability for high-resolution measurements [38-40]. Together, these innovations establish a new benchmark in geotechnical and structural health monitoring technologies.
2. Methods
The methodology adopted in this study integrates theoretical analysis, system design, experimental testing, and advanced object detection techniques. This approach aims to develop a PDL-based tiltmeter with high sensitivity. Key objectives include enhancing the system's sensitivity, reducing oscillations for improved stability, and confirming its practical effectiveness through comprehensive experimental validation.
-
2.1. Parallel Dipole Line
Parallel Dipole Line (PDL) is a configuration of two cylindrical bar magnets arranged in parallel and used to create a magnetic trap. The specialty of this magnet is that it has parallel dipole lines with the north and south poles of the magnet located along the diametrical side, compared to ordinary magnets which only have dipole lines located at the ends of the cylinder. Fig. 1 shows the position of the dipole lines of the PDL magnet, where the dipole direction (red arrow) comes out from the South pole (S) towards the North pole (N) along the diameter line of the magnet [15,16]. When a pair of diametrical rods are arranged parallel, a PDL configuration will be obtained because the sideways (transverse) direction of the magnetic field allows lateral interaction between the magnetic fields of several magnetic rods.
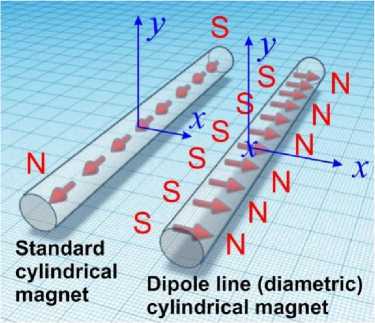
Dipole line (diametric) cylindrical magnet
Standard cylindrical magnet
Fig. 1. The difference between magnets in general and parallel dipole line magnets
The arrangement of the magnets in parallel will produce a magnetic field in the middle between the magnets or the longitudinal direction of the magnets as shown in Fig. 2(a). In the physical cross-section, the direction of the magnetic field in this parallel arrangement is M (Fig. 2(b)). When arranged in parallel, the fields meet in the middle and create a minimum potential that can cause diamagnetic materials to levitate. If a diamagnetic particle is placed between these two magnets, it will be pushed away from the sides of the magnets but will be attracted to the middle where the magnetic field is weakest. The effect produced by these two magnets forms a line resembling a camel's hump, so it is called the camelback effect in Fig. 2(c) which is colored blue [15,16,28].
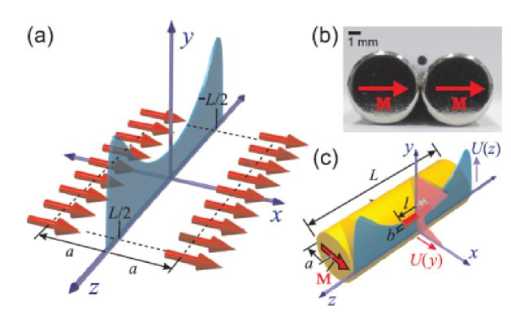
Fig. 2. (a). Parallel magnetic dipole line direction, (b). Magnetic field direction, (c). Camelback effect produced by a pair of PDL magnets (Duplicated with Permission) [15]
-
2.2. Theoretical Analysis: Tiltmeter with Parallel Dipole Line
The operating principle of a tiltmeter relies on detecting changes in the relative position between the sensor's internal components and a gravity reference, as illustrated in Fig. 3 [28]. Sensitivity, which is a key characteristic of any tiltmeter, determines its effectiveness in identifying small angular shifts. In the PDL-based tiltmeter proposed in this study, the sensitivity is primarily affected by the movement of the levitated graphite within the camelback potential field. The mathematical expression for the system’s sensitivity (S') is given as follows (1) [41]:
S= - (1) д
Here, it represents sensitivity (mm/degree), denotes the displacement of the graphite along the z-axis (mm), and signifies the change in the tilt angle (degrees). This formula highlights how sensitivity is directly influenced by the positional shifts of the graphite in response to angular changes. A larger for a given Δθ results in higher sensitivity, allowing the system to detect even the smallest tilt variations accurately. However, the system's resolution is limited by the accuracy, which is determined by the camera's imaging capabilities and the stability of the PDL magnetic field [16, 28]. Positioning two parallel dipole magnets at a fixed and equal distance creates the camel hump effect, as demonstrated in previous Parallel Dipole Line research [15,16,28]. To optimize the proposed system's performance, efforts were focused on enhancing the precision of graphite displacement measurements and stabilizing the PDL magnetic field. Advanced imaging techniques, including sub-pixel edge detection and high-frame-rate cameras, were implemented to improve the resolution.
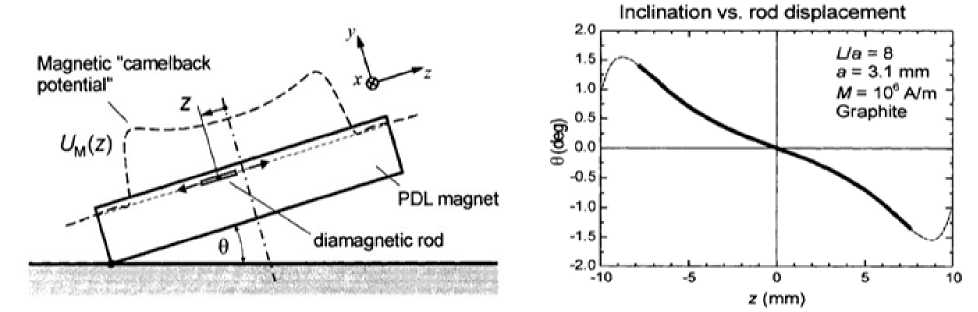
Fig. 3. Camel hump effect and tilt comparison to magnetic shift on PDL tiltmeter (Duplicated with Permission)
In image processing, we use subpixel edge detection to achieve higher measurement precision than single-pixel resolution. This is achieved by analyzing the grayscale intensity profile along the edge of a floating object (graphite diamagnetic) and estimating the edge position through an interpolation method around the intensity transition. To detect the exact moment of edge appearance, the zero-crossing method is used, which calculates the first derivative of the intensity gradient in each image line. Edges are identified at the points where this derivative changes sign (i.e., from positive to negative or vice versa), indicating a sharp contrast boundary. This technique allows to extract small angular displacements from video frames with increased precision, allowing for tilt measurements of up to the order of 10⁻⁵ degrees. Several edge detection methods were considered, including Sobel and Canny detectors. However, these approaches often rely on adjustable threshold parameters and may suffer from inconsistent edge localization under varying illumination. In contrast, the zero-crossing method provides consistent detection of sharp intensity transitions and is more suitable for capturing small, repeatable shifts in the object’s position. This makes it better aligned with the sub-pixel accuracy required for tilt measurements in our setup. Additionally, the camelback potential field was meticulously calibrated to ensure stable levitation of the graphite, reducing the impact of external disturbances and minimizing drift over prolonged periods. These enhancements significantly boost the system's sensitivity and resolution while ensuring reliable operation in challenging environmental conditions, making it adaptable to a wide range of geotechnical and structural applications.
Furthermore, the ratio between the size of the parallel dipole magnets and the dimensions of the graphite has a critical impact on the oscillation behavior and the sensitivity of graphite movement within the magnetic field [28]. For that, based on the theoretical equation, various levels of oscillation and sensitivity of graphite movement can be produced. The implementation of this phenomenon can be used in various applications in the engineering field. Starting from the movement and shifting of the ground (earthquakes), detecting shifts or levels of inclination of structures, and various other applications. Therefore, it was found that the relationship between the magnitude of the camelback effect and the oscillation of graphite movement along the z-axis varies based on the following parameters [16,28], namely:
-
a. The length of the identical parallel dipole magnetic pair material b. The diameter of the identical dipole magnetic pair material
-
c. The proportion of graphite length to diamagnetic material
-
2.3. System Design and Tiltmeter Workflow
The basic working model of the inclinometer principle is presented in Fig. 4. below [28], where measurements are made with a scale in degrees that have been set as the measurement resolution.
Fig. 4. Inclinometer architecture with PDL sensor application (Duplicated with Permission)
The measurement resolution is still minimal because the measurements are made manually. This is an important factor that is the basis for the development of using an image-based measurement method. Through the detection of both floating graphite edges, we can determine the position of the graphite midpoint and then measure the shift of the graphite midpoint along the x-axis (image pixel). The position of the graphite midpoint will be interpolated to the calibration point, which has been determined through empirical testing. The interpolation results show the degree of inclination of the measured object.
The Parallel Dipole Line (PDL) based tiltmeter uses a Jetson Nano microcomputer as a processing center. Jetson Nano was selected due to its balance of GPU performance, compact size, and native support for high-speed CSI camera interfaces, which are essential for real-time image processing in our system. While alternatives such as Raspberry Pi or BeagleBone were considered, they lacked sufficient GPU acceleration for edge detection at high frame rates. Nevertheless, the algorithmic framework is platform-agnostic and could be adapted to other microcomputers with comparable processing capabilities. PDL technology uses a pair of magnets with parallel dipole lines placed with a graphite rod floating between the magnetic gaps. When the system is turned on, the Jetson Nano will command the camera to capture an image while the camera has been installed perpendicular to the PDL Tiltmeter sensor. The captured image will be processed by making the graphite position as a shift in the tilt and the magnetic rod as a frame. The process of determining the tilt is carried out through the process flow in Fig. 5.
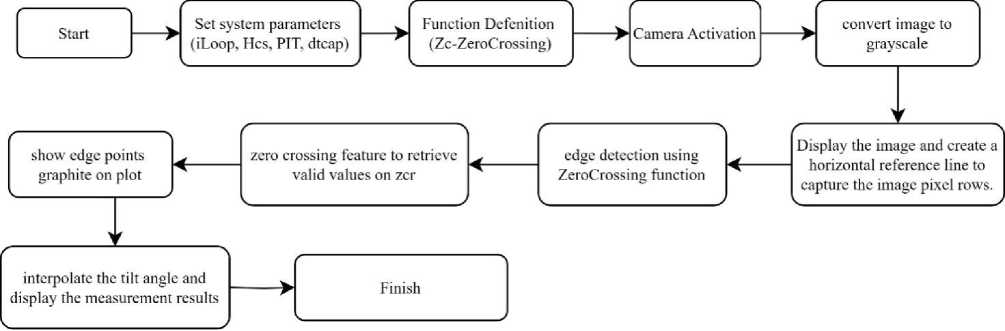
Fig. 5. Graphite Shift Image Processing Flowchart between Magnets
The first process of iLoop Iteration which determines the number of iterations to be performed by the program. Next Hcs (Horizontal Cross Section) determines the position of the horizontal line (pixel) to detect graphite edges [42, 43]. The PIT (Pixel Intensity Threshold), which is the threshold value of pixel intensity used to modify the intensity value in the image when analyzing graphite edges. Zcr (Zero Crossing) determines Zero Crossing Range, which is a valid range for the location of graphite edges in the image. Varible dtcap: Delay time capture that determines the time delay between displaying results. The use of a microcomputer such as Jetson Nano as a processing center enables the integration of efficient image processing algorithms for real-time slope analysis. The Jetson Nano, known for its compact design and robust AI (Artificial Intelligence) computing capabilities [44], has been extensively utilized in applications such as object recognition and tracking using camera-based systems. Furthermore, image processing technologies have been successfully incorporated into vision-based sensors for monitoring underground structures in areas prone to landslides, achieving impressive accuracy and resolution in detecting slope angles [45,46].
This system leverages readily available hardware and software, including digital cameras and the OpenCV library, to facilitate image processing [47,48]. By adopting this approach, the system provides a cost-efficient and practical solution for slope monitoring while also supporting integration with Internet of Things (IoT) platforms to enable remote monitoring capabilities.
2.4. The Process of Measuring Slope with Image Processing
The tilt measurement test for the sensor was conducted using a Jetson Nano Developer Kit B01, equipped with a camera offering a resolution of 1080P through a CSI (Camera Serial Interface) [49,50]. Images were captured across a series of calibration points, utilizing a cross-section (line scan) along the horizontal axis. The calibration point used is the determination of the image pixel position that represents the tilt angle, which means that when the graphite image is processed, the result is the graphite position along the specified horizontal pixel row. The value of each pixel has been determined through testing with a conventional tiltmeter, with a resolution of 0.1 degrees, this value is then entered into an array in the program code to store the tilt value representing each pixel. Specifically, pixel point 372 was designated to represent a tilt angle of -0.7°, while pixel point 1316 corresponded to a slope value of +0.7°. The presence/detection of graphite edges is processed through zero crossing [51-53], which is a method of detecting significant changes that
3. Result and Discussion
3.1. Variation in Graphite Length
occur from successive pixel intensity values along the Cross Section. For example, if pixel 379 has an intensity of 255 (Bright/White Light), then pixel 380 has a light intensity value of 0 (Dark), then the difference in intensity between pixels 379-380 is 255. This is intended as a Zero Crossing as a significant change because there is a change between the value 0 to the value + (Positive); The opposite also applies if the light intensity of pixel 379 is zero and the light intensity value at pixel 380 is 255, then the difference between the light intensity at pixel 379-380 = -255 which indicates a significant change from 0 to the value - (negative). If the zero-crossing result is significantly negative or positive, the pixel address is stated as the location of the graphite edge. Then, the graphite pixel address will be interpolated into an array that contains the pixel position and an array that contains the maximum and minimum slope points. Interpolation is done to display the slope value between the maximum and minimum slope points of the reading.
During the testing process, the PDL tiltmeter is placed on a horizontal platform with an adjustable slope, to verify the measurement results, the PDL tiltmeter is also placed on the same platform, a comparative measuring instrument in the form of a conventional inclinometer with a reading resolution of 0.1º. Then the tilt control knob is turned to measure the maximum and minimum limits of each measuring instrument. The platform used as the basis for the PDL Tiltmeter also aims to adjust the slope or initial calibration to varying structures such as irregular surfaces.
Fig. 6 show tilt measurement range for different graphite lengths. The experiment evaluated the effect of graphite length on the tilt measurement range, using lengths of 6 mm, 8 mm, 10 mm, and 12 mm. A fixed magnet length of 2 inches was employed throughout the test. The findings indicate that the length of the graphite plays a crucial role in determining the range of angular measurements.
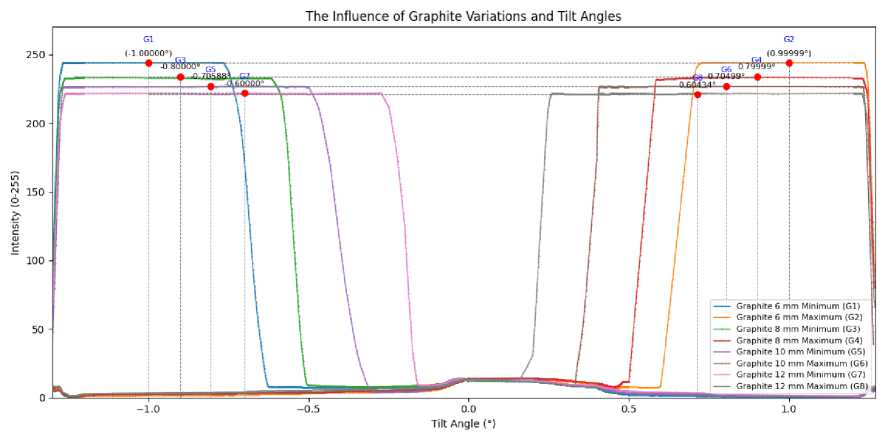
Fig. 6. Tilt measurement range for different graphite lengths
Table 1 presents the tilt measurement results for graphite lengths of 6 mm, 8 mm, 10 mm, and 12 mm, highlighting their respective minimum and maximum tilt angles.
Table 1. Tilt measurement results for different graphite
|
No |
Graphite Length (mm) |
Minimum Tilt Angle ( ) |
Maximum Tilt Angle ( ) |
|
1 |
6 |
-1.00000 |
+0,99999 |
|
2 |
8 |
-0,80000 |
+0,79999 |
|
3 |
10 |
-0,70588 |
+0,70499 |
|
4 |
12 |
-0,60000 |
+0,60434 |
The findings show that shorter graphite lengths, such as 6 mm, provide the widest measurement range, spanning from -1.00000° to +0.99999°, resulting in a total range of 1.99999°. In contrast, longer graphite lengths, like 12 mm, offer a narrower range of -0.60000° to +0.60434°, with a total span of 1.2°. These results suggest that shorter graphite lengths enhance sensitivity to angular changes, enabling greater responsiveness to tilt variations. However, this increased sensitivity comes at the expense of stability, which is discussed further in subsequent sections. Fig. 6 illustrates these findings, depicting the tilt measurement range for each graphite length, the curve for the 6 mm graphite has a steeper gradient, reflecting higher sensitivity and a broader range, while the curve for the 12 mm graphite is flatter, indicating reduced sensitivity and a narrower range. Graphite lengths of 8 mm and 10 mm offer a middle ground, balancing sensitivity and stability, and providing moderate measurement ranges. These observations underscore the importance of selecting an appropriate graphite length to balance sensitivity and stability, enabling customized solutions for geotechnical and structural health monitoring applications.
-
3.2. Variation in Magnet Length
The connection between magnet length and the tilt measurement range was analyzed by testing magnet sizes of 1 inch, 2 inches, and 3 inches, while maintaining a fixed graphite length of 8 mm. Table 2 presents the tilt measurement results for magnets of varying lengths: 1 inch, 2 inches, and 3 inches, with a constant graphite length of 8 mm.
Table 2. Tilt measurement results for different magnet
|
No |
Magnet Length (inches) |
Minimum Tilt Angle ( ^ |
Maximum Tilt Angle ( ) |
|
1 |
1 |
-0,60000 |
0.59473 |
|
2 |
2 |
-1,00000 |
0,99999 |
|
3 |
3 |
-0,70000 |
0,70000 |
The results show that the 2-inch magnet provided the broadest measurement range, from -1.00000° to +0.99999°, with a total span of 1.99999°. The 1-inch magnet, on the other hand, demonstrated a narrower measurement range, spanning from -0.60000° to +0.59473°, while the 3-inch magnet covered a range from -0.70000° to +0.70000°, resulting in a total span of 1.40000°. These results emphasize the superior performance of the 2-inch magnet, which provides an ideal balance between magnetic field strength and stability, enabling both sensitivity and accuracy in tilt measurements.
Fig. 7 illustrates the tilt measurement ranges corresponding to different magnet lengths. The curve for the 2-inch magnet displays a steeper gradient and wider range, reflecting greater sensitivity and responsiveness to tilt changes. In comparison, the narrower ranges observed for the 1-inch and 3-inch magnets highlight limitations in their magnetic field strength and stability. In particular, the weaker magnetic gradient of the 3-inch magnet reduces the sensitivity of graphite displacement, thereby impacting its overall effectiveness. These findings highlight the critical role of selecting the correct magnet length to optimize the PDL-based tiltmeter for accurate and reliable geotechnical monitoring.
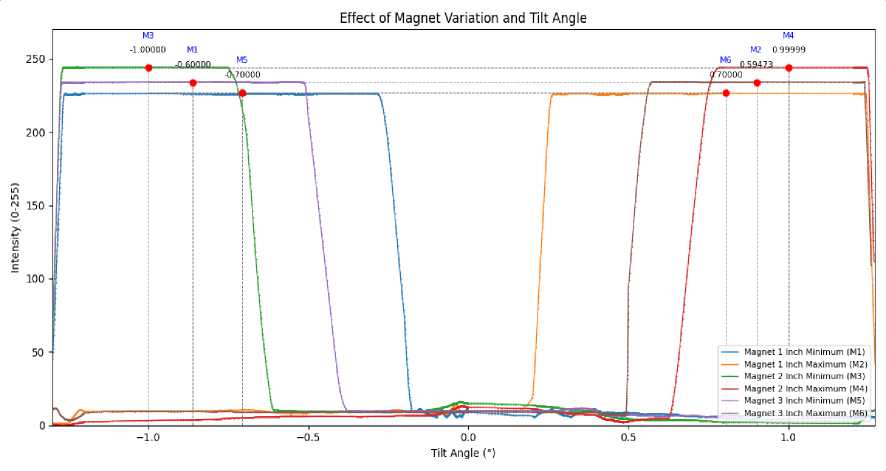
Fig. 7. Tilt measurement range for different magnet lengths
-
3.3. Oscillation Analysis Based on Graphite Length
-
3.4. Oscillation Analysis Based on Magnet Length
The oscillatory behavior of the tiltmeter was evaluated with varying graphite lengths (6 mm, 8 mm, 10 mm, and 12 mm) using a 2-inch magnet. Oscillation amplitude was used as the primary indicator of system stability. Fig. 8 demonstrates the oscillatory behavior of the PDL-based tiltmeter for different graphite lengths (6 mm, 8 mm, 10 mm, and 12 mm) using a 2-inch magnet. The results obtained in Fig. 8 illustrate the effect of graphite length on the resulting oscillations, this is in line with research conducted by [15,16], where the peak of the camel hump will be higher when the graphite is shorter, and conversely the peak of the camel hump will be lower when the graphite is longer. A high camel hump and short graphite will result in a higher graphite displacement velocity or a very sensitive graphite response to shifting. However, the downside is that it produces very high oscillations. The graph reveals that longer graphite lengths significantly reduce oscillation amplitudes, indicating improved stability. Specifically, the 12 mm graphite exhibits the lowest oscillation amplitude, ensuring steady and reliable readings even under dynamic conditions. Conversely, the 6 mm graphite shows substantial oscillatory behavior, with frequent spikes in tilt measurements, compromising the system's stability. This disparity is attributed to the leverage and moment of inertia in longer graphite lengths, which naturally dampen oscillatory movements. The variation in graphite length affects the maximum and minimum measurement limits in the tilt angle measurement, but the stability factor of each graphite is the main factor in achieving a fast and accurate tilt calculation. In contrast, shorter graphite lengths are more susceptible to rapid oscillations due to their lower inertia. However, this trade-off results in decreased sensitivity for longer graphite lengths, as explained earlier in Section 3.1.
These observations underscore the importance of graphite length in achieving a balance between sensitivity and stability, with longer graphite being particularly suited for applications that demand reliable and steady performance.
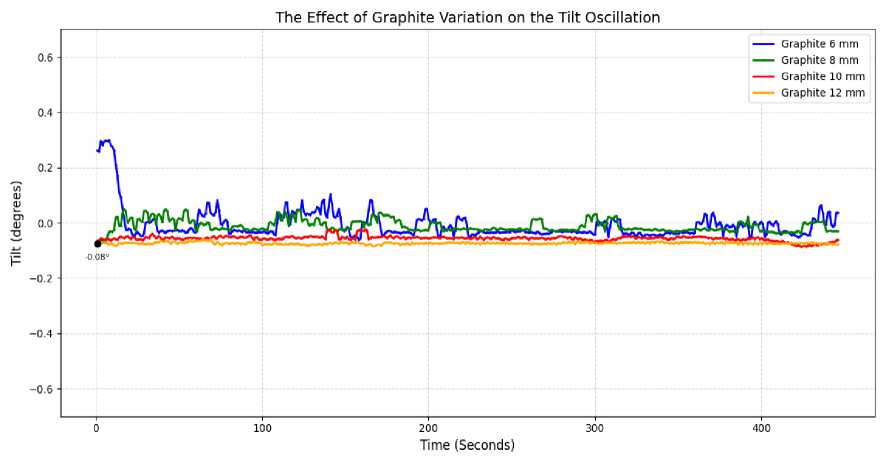
Fig. 8. Oscillation amplitude for different graphite lengths
The oscillatory behavior of the system was also evaluated for magnet lengths of 1 inch, 2 inches, and 3 inches, while keeping the graphite length fixed at 8 mm. Fig. 9 depicts the oscillatory responses of the PDL-based tiltmeter for these magnet lengths under the same graphite conditions.
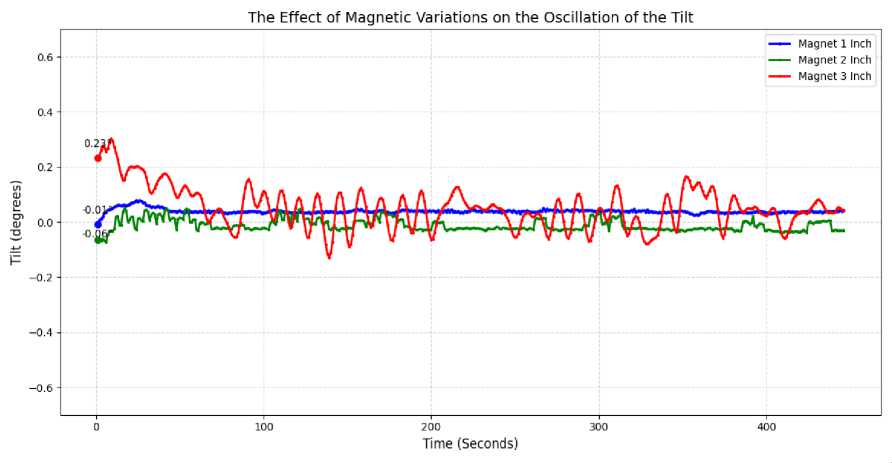
Fig. 9. Oscillation amplitude for different magnet lengths
The results indicate that shorter magnets, such as the 1-inch version, produce the lowest oscillation amplitudes. This stability is attributed to the concentrated magnetic gradient of shorter magnets, which helps maintain the graphite's position and reduces displacement variations. On the other hand, the 3-inch magnet exhibits the highest oscillation amplitudes due to its weaker and more dispersed magnetic gradient, causing greater instability in the graphite's movement. The 2-inch magnet provides a moderate balance, offering a compromise between stability and oscillation levels. These observations confirm that shorter magnets improve overall system stability, making them more suitable for applications where consistent readings are crucial. However, as discussed in Section 3.2, shorter magnets come with a trade-off of reduced measurement range, emphasizing the need to carefully balance stability and sensitivity when choosing the appropriate magnet length for specific geotechnical applications.
The oscillations analyzed in the testing of various magnet variations are used to handle possible noise or deviations that occur against the supposed slope value, the cause of this reading oscillation can be a very high deformation in a very short period. The test is carried out by looking at the time the sensor returns to its equilibrium point, a stable measurement value reading is obtained using a PDL magnet with a size of 2 Inch which is shown through the slope value (blue graph) in Fig. 9 with an oscillation position that is not far from the supposed equilibrium point (-0.01º).
3.5. Comparison of Measurements with Conventional Measuring Instruments
4. Conclusions
The testing process using 2 Inch graphite, a comparison and verification of the PDL Tiltmeter measurement results were carried out against conventional measuring instruments that had been standardized with the GVDA Inclinometer type, the measurement results were obtained as in Table 3.
Table 3. Tilt Measurement on PDL Tiltmeter and Conventional Inclinometer
|
No |
Graphite Length (mm) |
Minimum Tilt Angle ( t ) |
Maximum Tilt Angle ( ) |
||
|
PDL Tiltmeter |
Conventional Inclinometer |
PDL Tiltmeter |
Conventional Inclinometer |
||
|
1 |
6 |
-1.00000 |
-1.0 |
+0,99999 |
+0.9 |
|
2 |
8 |
-0,80000 |
-0.8 |
+0,79999 |
+0.7 |
|
3 |
10 |
-0,70588 |
-0.7 |
+0,70499 |
+0.7 |
|
4 |
12 |
-0,60000 |
-0.6 |
+0,60434 |
+0.6 |
The measurement results of the PDL Tiltmeter have been verified up to a resolution of 0.1° as indicated by the similarity of decimal values in the readings of the Conventional Tiltmeter and the PDL Tiltmeter. However, a very significant difference is that the PDL Tiltmeter can measure up to a resolution of 10-5 degrees, with the test carried out measuring the maximum and minimum points of each measuring instrument. The advantage of the PDL Tiltmeter is in the sensor resolution section which reaches 10-5 degrees and the technical side is better because it uses the principle of using passive diamagnetic traps on the camelback effect which produces relatively low sensitivity to environmental noise.
This study concludes that the Parallel Dipole Line (PDL) based tiltmeter system offers important advantages over conventional methods in terms of sensitivity for angle measurements, as well as a good level of stability against angular changes. Empirical data reveal that both graphite and magnet sizes significantly influence the system's angle measurement range and oscillation behavior. Shorter graphite lengths, such as 6 mm, provide a wider-angle measurement range, spanning from -1.00000° to +0.99999°, while longer graphite lengths, such as 12 mm, limit the range to -0.60000° to +0.60434°. In contrast, longer graphite lengths help reduce oscillations, enhancing the system's stability. For magnet size, the 2-inch magnet achieves the broadest angle measurement range of -1.00000° to +0.99999°. However, shorter magnets exhibit lower oscillation levels, further contributing to the system’s overall stability. These findings align with the study's goal of developing a high-accuracy tiltmeter, suitable for geotechnical applications like ground deformation monitoring, structural tilt analysis, and seismic activity detection.
The PDL-based tiltmeter system, utilizing graphite levitation within a parallel magnetic potential field, achieves an angular detection resolution as precise as 10⁻⁵. By optimizing graphite length and magnet size to minimize oscillations, the system demonstrates significantly improved stability. Therefore, this research establishes the PDL-based tiltmeter as a transformative and reliable solution for high-resolution geotechnical and structural health monitoring, surpassing the capabilities of traditional approaches.
Acknowledgment
This paper is supported by BIMA Kemendikbudristek Indonesia, through the regular fundamental research program.
