Predicting Diabetes Using Machine Learning: Models and Insights

Author: Santanu Basak, Angshuman Khan, Mayank Raj, Abhishek Pandey
Journal: International Journal of Information Engineering and Electronic Business @ijieeb
Article in issue: 2 vol.18, 2026.
Free access
Diabetes mellitus is a chronic metabolic disorder with a rapidly increasing global prevalence, posing a significant public health challenge. Early detection of diabetes can enable timely intervention and preventive measures, thereby reducing the risk of long-term complications. In this study, a machine learning (ML)-based methodology is proposed for the early prediction of diabetes mellitus. The proposed approach enhances existing prediction systems by improving key performance metrics, including precision, recall, and F1-score, and achieves an efficiency improvement of 4%–10% compared to state-of-the-art methods. Experimental results demonstrate that the support vector machine outperforms other ML algorithms for diabetes prediction, achieving 92% accuracy, 95% precision, 92% recall, 93% F1-score, 92% specificity, and an area under the receiver operating characteristic curve of 0.97.
Diabetes Prediction, Machine Learning Models, Support Vector Machine (SVM), Medical Data Classification, Classification Performance Metrics
Short address: https://sciup.org/15020254
IDR: 15020254 | DOI: 10.5815/ijieeb.2026.02.12
Text of the scientific article Predicting Diabetes Using Machine Learning: Models and Insights
Published Online on April 8, 2026 by MECS Press
Diabetes is a long-term condition that occurs when the pancreas either fails to produce sufficient insulin or the produced insulin cannot be used effectively or adequately. Insulin functions as a vital facilitator; it transfers glucose from the bloodstream into the body’s cells to produce energy. As the body converts carbohydrates into blood glucose, insulin’s function in enabling glucose transport into cells is crucial. The inability to utilize insulin effectively leads to elevated blood glucose levels, known as hyperglycemia. Chronic hyperglycemia is associated with injury and impairment across multiple organs and tissues. Given the urgency of tackling such lethal diseases, a sophisticated ML-based diagnostic system is considered imperative [1]. Artificial Intelligence (AI) has been ingeniously integrated into medical diagnostic systems to detect diseases. In line with this, the research proposes an early detection system for diabetic patients, leveraging machine learning (ML) and introducing a conceptual framework for its implementation.
Gestational Diabetes Mellitus (GDM) is increased blood glucose levels that arise during pregnancy and often subside following delivery. The GDM can affect the health of both the mother and the infant, potentially leading to long-term consequences. It may result in pregnancy issues such as severe hypertension, macrosomia, and obstructed labour. Nonetheless, lifestyle modifications and pharmacological interventions can help alleviate the symptoms. The syndrome may lead to pregnancy-related complications, including hypertension, the delivery of macrosomic infants, and difficulties during labour. Nonetheless, implementing lifestyle changes and adhering to recommended drugs can effectively manage the condition. The following is the discussion on the classification of diabetes [2].
Type 1 diabetes: The pancreas produces minimal insulin. Diabetes can impact people of any age, but it most commonly appears in children or young adults. People with this type of diabetes take insulin injections regularly to maintain blood sugar levels, as their survival depends on sufficient insulin.
Type 2 diabetes (T2D): Insulin resistance, characterized by the body’s diminished capacity to respond effectively to insulin, is the primary indicator for developing T2D. This constitutes the primary type of diabetes, affecting 90% of those diagnosed with the disorder. It results from a confluence of genetic predisposition and lifestyle decisions.
The GDM denotes increased blood glucose levels that occur during pregnancy and often subside after delivery. GDM can affect the health of both the mother and the infant, potentially leading to long-term consequences. It may result in pregnancy issues such as severe hypertension, macrosomia, and obstructed labour. Nonetheless, lifestyle modifications and pharmacological interventions can help manage the illness. The syndrome may lead to pregnancy-related complications, including hypertension, the delivery of macrosomic infants, and difficulties during labour [3]. Nonetheless, implementing lifestyle changes and adhering to recommended drugs can proficiently manage the condition [3].
Early detection of diabetes is crucial for effective management and prevention. In the era of ML, numerous advanced systems have been implemented to assist individuals, but improving their efficiency can further enhance their impact. This paper focuses on developing a robust and efficient ML model to predict diabetes at an early stage. The key contributions of this study include:
^ Designed a prediction system that leverages ML to detect diabetes in its early stages, using various algorithms trained on a diabetes dataset.
^ Evaluated the proposed model’s efficiency metrics such as accuracy, precision, and F1 -score.
^ Additional performance analysis was conducted using the confusion matrix and the area under the receiver operating characteristic curve.
2. Background and Related Works
The structure of this paper is as follows: Section 2 provides an overview of the background and related research, summarizing significant studies and their outcomes. Section 3 outlines the methodology employed. Section 4 discusses the experiments and results, highlighting performance comparisons among various models. Lastly, the paper concludes with a summary of the findings.
Diabetes mellitus is a prevalent and long-term condition characterized by elevated blood glucose levels, which can result in numerous health complications if not adequately controlled. Precise and prompt diabetes prediction is essential for appropriate intervention and management. ML algorithms have proven to be excellent tools for forecasting diabetes risk. This literature review delineates current research in diabetes prediction utilizing ML approaches.
Linear Regression (LR) is a method for binary classification that uses a sigmoid function to estimate the probability of one of two possible outcomes from input features. This approach furnishes interpretable coefficients that indicate the influence of each feature [4]. Support Vector Machine (SVM) is an adaptable ML algorithm that determines optimal hyperplanes to separate data into distinct classes. By maximizing the margin between classes, SVM proves efficacious in both binary and multiclass classification tasks. Notably, SVM excels at handling high-dimensional data, leveraging kernel functions to address non-linear datasets and yield interpretable decision boundaries [5]. Decision Trees (DT) are interpretable models that employ a tree structure to generate predictions based on input features, often prone to overfitting but mitigated by ensemble methods such as Random Forest (RF) [6]. RF is a versatile and powerful ML tool, usually chosen for its ability to balance accuracy and generalization, making it invaluable in various real-world applications [7]. The K-nearest neighbours (k-NN) algorithm, known for its versatility, makes predictions based on the similarity of data points. It is well-suited for classification and regression tasks, although its effectiveness depends on carefully selecting the ‘k’ parameter and poses challenges in high-dimensional spaces [8]. A standard neural network (NN), derived from the human brain, serves as the cornerstone of deep learning and can tackle a wide range of tasks, from image recognition to Natural Language Processing. While they have transformed the landscape of AI, persistent challenges in data availability and interpretability continue to fuel ongoing research endeavours [9].
The performance of a model is assessed using various metrics, including accuracy, F1 score, precision, recall, and specificity. Greater values for these metrics indicate improved effectiveness.
Accuracy reflects the percentage of correct predictions made by the algorithm. Meanwhile, mean squared error (MSE) quantifies the error in predictions [9]. True Positive (TP) denotes accurately predicted instances of the positive class, whereas True Negative (TN) signifies accurately predicted instances of the negative class. A False Positive (FP) transpires when the positive class is inaccurately predicted, while a False Negative (FN) occurs when the negative class is erroneously predicted [9]. Accuracy is determined using Eq. 1 [9]. The model’s ability to predict the positive class correctly is known as precision, as shown in Eq. 2 [10].
On the other hand, the model’s ability to correctly identify the negative class is known as specificity, which is computed using Eq. 3 [10]. Recall, also known as the true positive rate, is the proportion of correct positive class predictions and is calculated using Eq. 4 [11]. The F1 score, which combines precision and recall, is determined using Eq. 5 [11].
The Confusion Matrix (CM) (refer to Fig. 3) illustrates TP, TN, FP, and FN across four quadrants: TN is located in the top-left, TP in the bottom-right, FN in the bottom-left, and FP in the top-right.
TP + TN
Accuracy = (1)
7 TP + TN + FP + FN v 7
Precision =
|
Specificity = r J TN + FP |
(3) |
|
TP Recall = TP+ FN |
(4) |
~ 2 × Precision × Recall
F 1 =
Precision+Recall
In [12], the authors have implemented RF, Naïve Bayes (NB), Multilayer Perceptron (MLP), and SVM to forecast diabetes using a health dataset. The MLP model achieved 82% accuracy, demonstrating that combining multiple algorithms enhances early detection and prediction of diabetes. This approach highlights the capabilities of ML in the healthcare sector. In [13], the authors explored the prediction of diabetes using ML techniques. They utilized the PIMA Indian Diabetes Database, which contains health-related attributes such as age, BMI, and glucose levels. The algorithms tested include DT, SVM, and KNN. Among these, SVM achieved the highest accuracy at 78.6%, followed by DT at 76.4%. This study demonstrates the effectiveness of ML models in diabetes prediction, with SVM emerging as the most accurate in their tests. In [14], the authors explored diabetes prediction using the Pima Indian Diabetes dataset from UC Irvine. They evaluated various ML techniques, including KNN, DT, and Random Forests. The RF technique had the highest efficacy, achieving an accuracy of 77.6%. This study demonstrates that ML, particularly random forests, can accurately predict diabetes. The study in [15] used a dataset of 1,000 patients from an ophthalmology clinic, including age, gender, BMI, blood pressure, cholesterol levels, and diabetes duration. It applied ML algorithms such as LR, DT, RF, SVM, KNN, and NN. The RF and NN achieved good accuracy. This research highlights the effectiveness of ML models, particularly RF, in predicting diabetic retinopathy based on patient risk factors.
Most recent works on diabetes prediction models face several challenges, including proven inaccuracy with highdimensional data, generalization failures across different populations, and the inability to interpret complex models, especially those based on NNs. Additionally, hyperparameter optimization is either missing or implemented inefficiently, limiting the potential effectiveness of models such as RF and SVM.
Thus, the limitations mentioned can be addressed through hyperparameter optimization and fusion techniques. Hyperparameter optimization techniques are used to improve the model’s performance. The model fusion technique combines algorithms to compensate for each other’s weaknesses, resulting in more reliable predictions. In addition, the interpretability of the models is enhanced by selecting algorithms that lead to explicit decision paths, such as RF and LR, to avoid the “black-box” issue that arises with NNs. Additionally, Table 1 presents a review of related literature, in which we discuss the aims, descriptions, and performance metrics reported by the authors. Additionally, it has been observed that most authors did not consider all the metrics necessary to evaluate the efficiency of their work, which are essential for accurately identifying effectiveness.
3. Proposed Approach
In this section, the methodology for creating and evaluating a diabetes prediction model using ML techniques is elucidated. The study aims to achieve a precise prediction of diabetes risk. It involves a comparative analysis of the effectiveness of LR, RF, SVM, DT, K-NN, and NN Models. Subsequently, this developed model holds potential for practical application in predictive scenarios.
Table 1. A comprehensive study of related work.
|
Work |
Aim |
Methodology / Description |
Performance |
|
[2] |
To enhance diabetes management using CGM data |
ML-based state-space modeling integrating physical activity and stress data |
Excellent |
|
[16] |
To analyze fasting plasma glucose and triglyceride levels |
Binary logistic regression applied to data from 11,937 subjects to assess metabolic risk factors |
Moderate |
|
[17] |
To develop a diabetes prediction and monitoring system |
ID3 classifier for symptom-based prediction with blood glucose monitoring and alert visualization |
Moderate |
|
[18] |
To reduce diabetes incidence through risk prediction |
Supervised ML models, including Naïve Bayes, SVM, and J48 decision trees |
Excellent |
|
[19] |
To distinguish diabetic and nondiabetic individuals |
Feature selection combined with ensemble learning techniques |
Moderate |
|
[20] |
To predict cardiovascular risk in T2D patients |
Neural networks and Self-Organizing Maps addressing class imbalance |
Moderate |
|
[21] |
To develop a robust T2D risk assessment model |
Joint bagging–boosting framework with ML models and cross-validation |
Moderate |
|
[22] |
To handle uncertainty in diabetes diagnosis |
Neutrosophic logic applied to the Pima Indian Diabetes Dataset |
Excellent |
|
[23] |
To improve disease diagnosis accuracy |
Stability Selection for identifying significant diagnostic features |
Moderate |
|
[24] |
To estimate HbA1c levels using personalized models |
Clustering-based ML models using CGM and wearable data |
Moderate |
|
[25] |
To predict diabetes using wearable sensors |
Feature engineering from multimodal sensor data with ML classifiers and k-fold validation |
Excellent |
|
[26] |
To develop a robust diabetes prediction model |
ML classifiers, including LR, SVM, NB, RF, and ensemble methods |
Excellent |
|
[27] |
To enable early-stage diabetes detection |
Comparative evaluation of multiple classification algorithms |
Excellent |
|
[28] |
To support early diagnosis of stroke and diabetes |
XGBoost-based AI diagnostic framework |
Moderate |
|
[29] |
To predict postprandial blood glucose levels |
Explainable deep learning with SHAP and LOSO crossvalidation |
Moderate |
|
[30] |
To monitor glucose during physical activity |
ML models with tensor factorization and Elastic Net regression |
Moderate |
Fig. 1 shows the framework of our proposed work. Here, data acquisition involves collecting data for training the ML model. The preprocessing stage involves tasks that enhance data quality, such as data cleaning, normalization, and splitting the data into training and test sets. The data cleaning technique resolves missing value issues, converts categorical values to numerical values, removes outliers, and performs feature selection, among other tasks. Features with higher values are normalized using the normalization technique. Next, the training set is used to train the ML models with various algorithms. The test set is then used to evaluate the trained model’s performance. Finally, the models are combined based on their performance to form the final model.
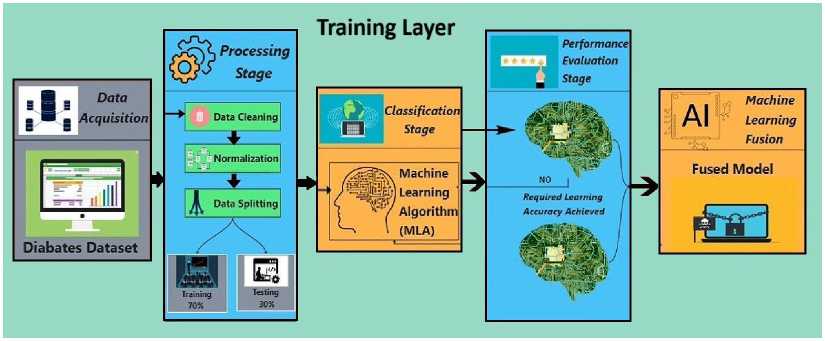
Fig. 1. Proposed framework of diabetes prediction.
In Algorithm 1, the process begins by acquiring a dataset related to the disease, diabetes. This collected data is then cleaned and normalized to the highest level of possible accuracy. Next, the data is split into two groups: one for training and another for testing. 70% of the data will be used for training, while the remaining 30% percent will be used to test the model. Various ML algorithms will then be applied to the training data to facilitate learning about diabetes. In every algorithm, the performance is evaluated based on the accuracy achieved on the testing data. If an algorithm’s accuracy reaches the desired level, it is stored. If not, its settings are changed, and it is retaught; a retrial is then conducted. If an algorithm still does not yield good results, it is discarded. The models that meet the accuracy conditions are combined to build a robust last model. If none of the algorithms produce the desired output, an error message is displayed indicating that no model was created. Therefore, the previous integrated model can be used to predict the likelihood of diabetes. We used a soft voting ensemble of the top three performing models to improve the accuracy and robustness of the fusion technique. In soft voting, we average the predicted probabilities across models, and the class with the highest average probability is selected. This method increases the strengths of each model.
Algorithm 1: Diabetes Prediction System
Step 1: Data Acquisition:
Acquire the diabetes dataset
Step 2: Processing Stage:
Perform data cleaning
Normalize the dataset
Split the data into training (70%) and testing (30%) sets
Step 3: Classification Stage:
Initialize an empty list of successful models
Step 4: for each ML algorithm (MLA) in the set of MLA do
Train the MLA on the training set
Test the MLA on the testing set
Evaluate the performance of the MLA if required learning accuracy is achieved then
Save the MLA model to the list of successful models else
Adjust parameters and retrain the MLA
Test the MLA on the testing set again
Evaluate the performance of the MLA again if required learning accuracy is still not achieved then Discard the MLA model end if end if end for
Step 5: ML Fusion:
if list of successful models is not empty then
Fuse the models in the list to create the final model else
Return an error indicating no suitable model was found end if
Step 6: Output:
Return the fused model for diabetes prediction
4. Experiments, Results, and Analysis
This section outlines the details of the experiment, presents the results, and provides an analysis of the findings.
-
4.1. Experiment
Our experiment was executed using Python 3.10.0 and the Jupyter Notebook environment. The experiments were conducted on a computer equipped with an 11th Gen Intel(R) Core (TM) i5-1135G7 processor at 2.40 GHz, 8 GB of RAM, and a 64-bit Windows 11 operating system. The dataset used in this study was sourced from the University of California, Irvine (UCI) ML repository [31]. It consists of 520 instances, each with 16 features and one target class. The features and target class of the dataset are provided in Table 2.
Essential steps in data preprocessing were taken, including handling missing values, scaling features, and encoding categorical variables. The features are selected using a correlation coefficient matrix, as shown in Fig. 2, which signifies the relation among the features, including the target class. If the value of a feature relative to the target class is close to zero, the feature is considered less critical; otherwise, it has an impact on the target class. Its value ranges from -1 to +1. If the value is exactly zero, it indicates that the feature has no impact on the target class; however, this is an ideal case.
If the value is close to zero, then that feature is not considered for the experiment. Thus, all features are considered in this experiment [10].
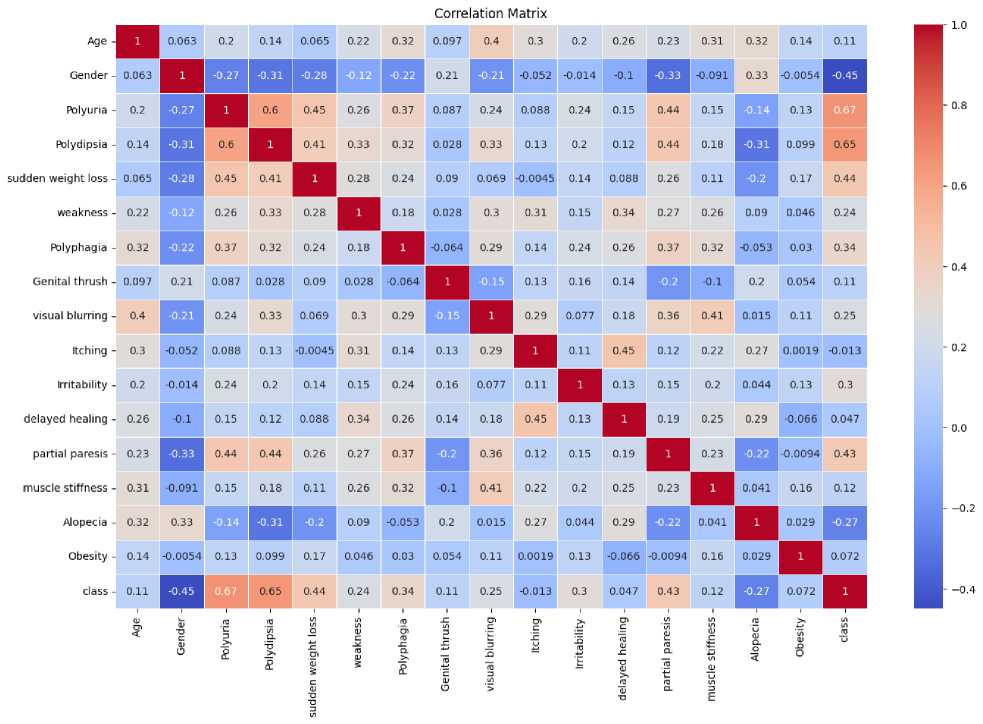
Fig. 2. Correlation coefficient matrix among features and the target class.
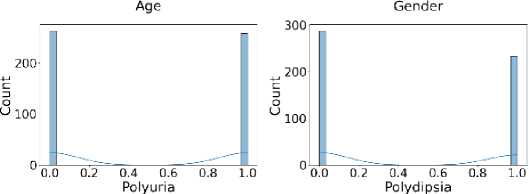
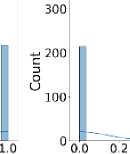
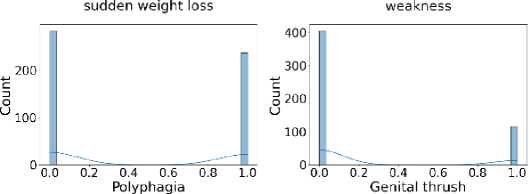
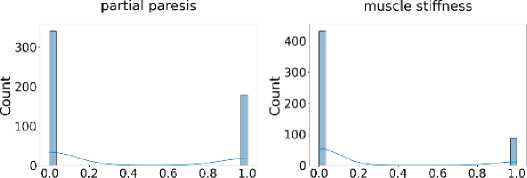
Additionally, Fig. 3 shows that the target class is nearly balanced, and Fig. 4 illustrates the distribution of features that reflect the dataset’s diversity. The experiment utilized six different ML algorithms: LR, SVM, DT, RF, k-NN, and NN. Accuracy, F1 score, precision, recall, and specificity are used to assess the performance of the proposed method.
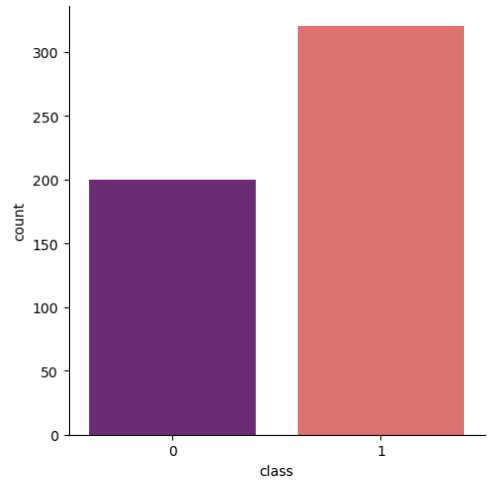
Fig. 3. Distribution of the target class illustrating the class balance.
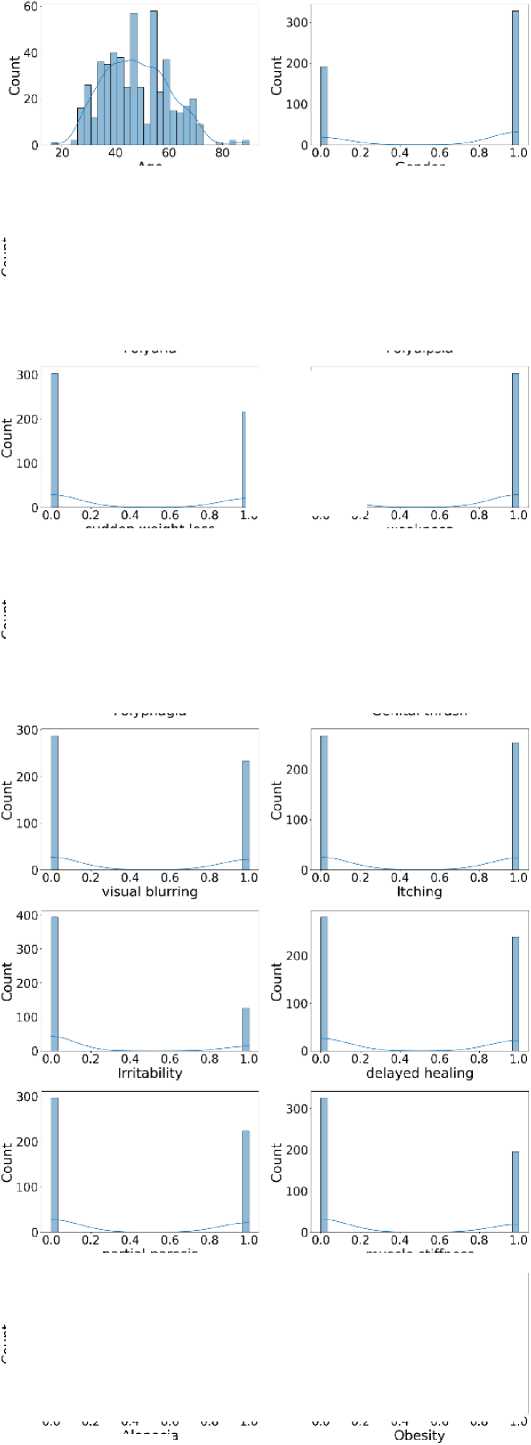
Fig. 4. Distribution of all features in the dataset used for the experiment.
Alopecia
Table 2. Description of the dataset used for the experiment
|
Name of the variable |
Description |
|
age |
It is a feature, and the value is between 1 and 65. |
|
gender |
It is a feature, with values 1 and 2, where 1 denotes male and 2 denotes female. |
|
Frequent urination, Excessive thirst, Rapid weight loss, Fatigue, increased hunger, Genital yeast infection, Blurred vision, Skin irritation, Mood swings, Slow wound healing, Partial paralysis |
These are features. Here, the value is either 1 or 2, where 1 denotes YES and 2 represents NO. |
|
class |
It is the target class. Its value is 1 or 2, where 1 indicates a positive value and 2 indicates a negative value. |
Diabetes prediction models often employ evaluation metrics such as accuracy, MSE, F1 score, precision, recall, and specificity. However, these metrics have limitations. Accuracy can be misleading in imbalanced datasets, where non-diabetic cases often outnumber diabetic cases. MSE is less suitable for classification tasks, such as diabetes prediction, and does not account for class imbalance. The F1 score balances precision and recall, but it assigns equal weight to false positives and negatives, which can be problematic in medical settings. Precision focuses on positive predictions but does not account for missed cases. Recall captures all diabetic cases at the expense of increased false positives, while specificity may overlook undetected diabetes. Relying solely on these metrics can obscure the true clinical effectiveness of a diabetes prediction model.
All experiments were repeated using 10-fold cross-validation to prevent overfitting. We record the mean and standard deviation of each performance metric across the folds. A McNemar test was also conducted to compare the proposed fused model against the best individual model. The test confirmed that the performance improvement was statistically significant (p < 0.05).
Hyperparameter optimization was performed using an exhaustive grid search with 10-fold cross-validation. The best values selected are as follows:
In hyperparameter optimization for LR, we set the regularization strength parameter C to 1 to balance underfitting and overfitting. We also used ridge regularization, which penalizes large coefficients to avoid overfitting.
For hyperparameter optimization of SVM, we used a radial basis function kernel, which helps capture non-linear relationships. The gamma parameter was set to ‘scale,’ which adapts to the data by using the inverse of the number of features.
Hyperparameter optimization for the DT, the maximum tree depth was 5 to avoid overfitting, and the splitting was set to ‘gini.’ The minimum number of samples required to split an internal node was set to 4.
We used 100 decision trees with a maximum depth of 10 for hyperparameter optimization for RF to limit model complexity. The max_features parameter was set to ‘sqrt’, a common choice that works well for classification tasks. Bootstrap sampling was enabled to reduce variance through bagging.
Hyperparameter optimization for k-NN revealed that the optimal number of neighbors was 7. The weighting scheme was set to ‘distance,’ so closer neighbours have a more substantial influence on the prediction. The distance metric used was Minkowski with p = 2, equivalent to the Euclidean distance.
Hyperparameter optimization for the NN yielded the best configuration, which consisted of two hidden layers with 50 and 30 neurons, respectively. The activation function was ReLU, which speeds up convergence during training. The solver used for weight optimization was ‘adam,’ a popular gradient-based optimizer. The initial learning rate was set to 0.001, and training was allowed for a maximum of 300 iterations.
-
4.2. Results and Analysis
In Table 3, we can see the output value of different parameters. We evaluated the performance of our ML algorithms using various metrics, such as accuracy, F1 score, precision, recall, and specificity. SVM achieved the highest accuracy of 92%, with RF close behind at 91%. The Standard NN achieved 90% accuracy, while LR and k-nearest neighbors achieved 89%. The DT model had the lowest accuracy, reaching 82%. Thus, SVM achieves higher accuracy. For the F1 score, both SVM and RF attained the highest value of 0.93, while LR, k-nearest Neighbor, and Standard NN reached an F1 score of 0.91. The DT model achieved the lowest F1 score of 0.85, suggesting it has greater difficulty balancing precision and recall than the others. So, in terms of F1 score, both SVM and RF perform better. In terms of precision, KNN achieved the highest precision score of 0.98. SVM and RF both achieved a precision score of 0.95, while the Standard NN and LR followed closely with 0.94 and 0.93, respectively. The DT had the lowest precision score at 0.91. Thus, KNN is efficient in terms of precision.
Table 3. Comparison of results obtained using different ML algorithms in the proposed model.
|
Algorithm |
Accuracy |
MSE |
F1 Score |
Precision |
Recall |
Specificity |
|
LR |
89% |
0.11 |
0.91 |
0.93 |
0.89 |
0.90 |
|
SVM |
92% |
0.08 |
0.93 |
0.95 |
0.92 |
0.92 |
|
DT |
82% |
0.18 |
0.85 |
0.91 |
0.79 |
0.88 |
|
RF |
91% |
0.09 |
0.93 |
0.95 |
0.90 |
0.92 |
|
k-NN |
89% |
0.11 |
0.91 |
0.98 |
0.85 |
0.97 |
|
Standard NN |
90% |
0.10 |
0.91 |
0.94 |
0.89 |
0.91 |
For recall, SVM achieved the highest score of 0.92, while RF and Standard NN both followed with 0.90. LR and KNN achieve a recall of 0.89 and 0.85, respectively. The DT had the lowest recall score at 0.79. So, based on the recall, SVM performs better again. Lastly, KNN achieved the highest specificity of 0.97, indicating its effectiveness at identifying negative cases. SVM and RF both attained a specificity of 0.92, while the Standard NN and LR achieved 0.91 and 0.90, respectively. The DT had the lowest specificity at 0.88. Hence, in terms of specificity, KNN is more efficient than the others. Finally, overall performance is suitable for all, but SVM performs comparably.
The proposed approach using the SVM and some existing approaches are listed in Table 4. Additionally, existing works do not consider all performance metrics, which is especially important for verifying predictability across all target classes. The results show that, performance-wise, SVM is a highly efficient and comparatively proposed method that outperforms others due to its high accuracy, F1 score, precision, recall, and specificity.
о
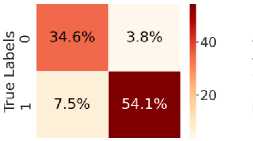
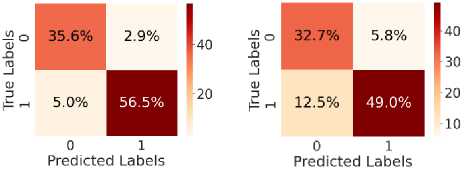
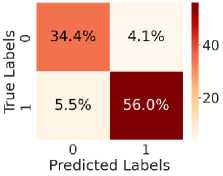
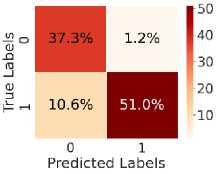
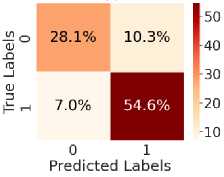
Fig. 5. shows the CM after testing with the test dataset. Fig. 5 (a) shows CM using LR, with TN = 34.6%, TP = 54.6%, FN = 7%, and FP = 3.8%. Fig. 5(b) shows CM using SVM, with TN = 35.3%, TP = 56.5%, FN = 5.0%, and FP = 3.1%. Fig. 5(c) shows CM using DT, with TN = 33.4%, TP = 48.6%, FN = 13%, and FP = 5.4%. Fig. 5(d) shows CM using RF, with TN = 34.6%, TP = 56.0%, FN = 5.5%, and FP = 3.8%. Fig. 5(e) shows CM using k-NN, with TN = 37.3%, TP = 52.2%, FN = 9.4%, and FP = 1.2%. Fig. 5(f) shows CM using NN, with TN = 37.3%, TP = 50.7%, FN = 10.8%, and FP = 1.2%. Hear, although all the ML models perform well comparatively. It can be observed that the higher predictability of all the models is in correctly predicting the TN and the TP. On the other hand, the FN and the FP rates are close across all methods, but the SVM yields the lowest FN rate. Thus, overall, SVM performs better.
Predicted Labels
(a)
(d)
(b)
(e)
(c)
(f)
Table 4. Comparative analysis of the proposed model results with existing works.
|
Work |
Algorithm |
Accuracy |
F1 Score |
Precision |
Recall |
Specificity |
|
[1] |
SVM |
89% |
87 |
Not mentioned |
89 |
88 |
|
[6] |
Voting Classifier |
80% |
Not mentioned |
72.5 |
68.51 |
70.47 |
|
[7] |
LR |
83.78% |
Not mentioned |
Not mentioned |
69.23 |
83.78 |
|
[28] |
XGBClassifier |
87.5% |
87.5 |
87.5 |
87.5 |
Not mentioned |
|
Proposed |
SVM |
92% |
93 |
95 |
92 |
92 |
Fig. 5. CM obtained using different ML algorithms: (a) LR, (b) SVM, (c) DT, (d) RF, (e) k-NN, and (f) NN.
(d)
(e)
(c)
(f)
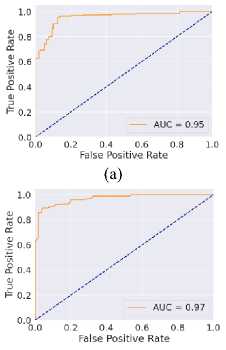
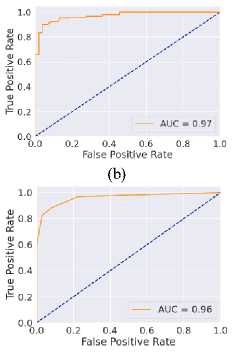
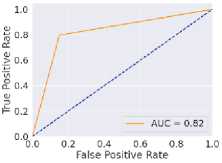
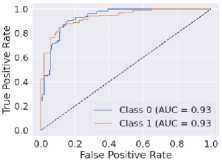
Fig. 6. ROC curves obtained using different ML algorithms: (a) LR, (b) SVM, (c) DT, (d) RF, (e) k-NN, and (f) NN.
Fig. 6 represents the ROC curves using different ML algorithms. It is used to evaluate AUC; a higher value indicates better performance. Fig. 6(a) shows the ROC curve using LR, with an AUC of 0.95. Fig. 6(b) shows the ROC curve using SVM, with an AUC of 0.97. Fig. 6(c) shows the ROC curve for DT, with an AUC of 0.83. Fig. 6(d) shows the ROC curve using RF, with an AUC of 0.97. Fig. 6(e) shows the ROC curve using k-NN, with an AUC of 0.96. Fig. 6(f) shows the ROC curve for the NN, with an AUC of 0.95. Here, all the models perform well, but SVM and RF perform comparatively better than the others, as indicated by their highest AUC values. Again, after considering all the metrics, it can be concluded that SVM’s overall performance is the highest.
The dataset for this experiment is small. Therefore, there is a possibility of biased prediction results; however, the results shown in CM indicate high predictability for TP and TN. It indicates that both negative and positive classes are efficiently predicted, and that all models exhibit unbiased behaviour. This is because the target class distributions were nearly balanced, and the dataset was scaled before training the model. The comparison of performance metrics indicates that our model performs better with feature scaling and hyperparameter tuning.
5. Conclusion
The ML-based solution has become an essential part of the healthcare system, where performance is crucial as it involves life risks. This study explores diabetes prediction through various ML techniques. Different ML algorithms, including LR, DT, RF, SVM, k-NN, and NNs, are tested to identify the most effective solutions. All the ML algorithms performed well, with SVM standing out as the best overall. Compared with existing studies, SVM is the top performer, achieving 92% accuracy, 93% F1 score, 95% precision, 92% recall, 92% specificity, and an AUC of 0.97, all of which are the highest. In the current scenario, SVM’s superior performance highlights its ability to handle high-dimensional data effectively, making it particularly suitable for medical diagnosis tasks. This research establishes ML as a powerful tool for predicting diabetes risk, enabling early diagnosis and significantly improving patient outcomes. However, there are several directions for future exploration, such as ensuring data security and privacy through encryption or federated learning, enhancing model interpretability via explainable AI methods, integrating additional clinical features, implementing real-time applications, validating models on diverse datasets, and exploring hybrid or ensemble techniques, which are promising areas for further to advance the practical application of ML in diabetes prediction.
Author Contributions Statement
Santanu Basak – Conceptualization, Methodology, Writing – Drafted the initial manuscript, Handled data acquisition, dataset preprocessing, Constructed the overall framework, contributed to the literature survey.
Angshuman Khan – Supervision, Visualization, Writing – Drafted the initial manuscript, Writing – Review and Editing, Data Curation and Software Implementation: Handled data acquisition, dataset preprocessing, and implemented the research model, Review and Editing, and Project Management: Reviewed and edited the manuscript, ensured clarity and coherence, and helped coordinate project milestones and deadlines.
Mayank Raj – Model Training, Validation, and Performance Evaluation: Led the model training process, validated results using standard metrics, and benchmarked performance against existing methods.
Abhishek Pandey – contributed to the literature survey and the implementation of the proposed research model. Formal Analysis, Visualization, and prepared performance charts, documenting the technical background of the study.
All authors have read and agreed to the published version of the manuscript.
Conflict of Interest Statement
The authors declare no conflicts of interest.
Funding Declaration
This research received no external funding.
Data Availability Statement
This study analyzed publicly available datasets. The results obtained and datasets can be found here: “Early Stage Diabetes Risk Prediction” dataset, UCI Machine Learning Repository, 2020. [Online]. Available:
Ethical Declarations
This study does not involve human participants or animals.
Acknowledgments
Not applicable
Declaration of Generative AI in Scholarly Writing
The authors used ChatGPT (OpenAI, GPT-5.3 version), a generative artificial intelligence (AI) tool, solely for language editing and improving the readability of the manuscript. All scientific content remains the responsibility of the authors.
Abbreviations
The following abbreviations are used in this manuscript:
ML – Machine Learning
SVM – Support Vector Machine
ROC – Receiver Operating Characteristic
AUC – Area Under the Receiver Operating Characteristic
AI – Artificial Intelligence
GDM – Gestational Diabetes Mellitus
T2D – Type 2 Diabetes
LR – Linear Regression
DT – Decision Tree
RF – Random Forest k-NN – k-Nearest Neighbours
NN – Neural Network
MSE – Mean Squared Error
TP – True Positive
TN – True Negative
FP – False Positive
FN – False Negative
CM – Confusion Matrix
NB – Naïve Bayes
MLP – Multilayer Perceptron
MLA – Machine Learning Algorithm
UCI – University of California, Irvine
