Predicting student academic performance in computer science courses: a comparison of neural network models

Author: Abimbola R. Iyanda, Olufemi D. Ninan, Anuoluwapo O. Ajayi, Ogochukwu G. Anyabolu
Journal: International Journal of Modern Education and Computer Science @ijmecs
Article in issue: 6 vol.10, 2018.
Free access
This study compared two neural network models (Multilayer Perceptron and Generalized Regression Neural Network) with a view to identifying the best model for predicting students’ academic performance based on single performance factor. Only academic factor (students’ results) was considered as the single performance factor of the study. One cohort of graduated students’ academic data was collected from the Computer Science and Engineering Department of Obafemi Awolowo University, Nigeria using documents and records technique. The models were simulated using MATLAB version 2015a and evaluated using mean square error, receiver operating characteristics and accuracy as the performance metrics. The results obtained show that although Multilayer Perceptron had prediction accuracy of 75%, Generalized Regression Neural Network had a better accuracy. The response time of Generalized Regression Neural Network (0.016sec) was faster than Multilayer Perceptron (0.03sec) and its memory consumption size (5kb) lower than that of Multilayer Perceptron (8kb). The simulated models were further compared with t-test method using a confidence interval of 95%. The attained t-test result from p-value (0.6854) suggests acceptance of null hypothesis, which shows that there is no significant difference between the predicted Grade Point Average and the actual Grade Point Average. The findings therefore reveal that the overall performance of Generalized Regression Neural Network outperforms the Multilayer Perceptron model with an accuracy of 95%. The study concluded that Generalized Regression Neural Network model which was simulated and with 95 % accuracy could be deployed by educationists to predict students’ academic performance using single performance factor.
Academic performance, Neural Network, Model, Grade point average, Computer science and engineering, evaluation
Short address: https://sciup.org/15016766
IDR: 15016766 | DOI: 10.5815/ijmecs.2018.06.01
Text of the scientific article Predicting student academic performance in computer science courses: a comparison of neural network models
Published Online June 2018 in MECS DOI: 10.5815/ijmecs.2018.06.01
The recent decline in the standard of education and the recurrent poor academic performance of students which have led to high failure or withdrawal rates in the past in most developing countries (such as Nigeria) have necessitated researches that will help offer solutions to some of these problems. Consequential to this is the higher institutions growing interest in taking preemptive steps such as the prediction of students’ academic performance (SAP). SAP is one way to enhance the quality level and provide better educational services, however its prediction poses a great challenge owing to the large number of factors that can influence it. For an instance, “Ref. [1]” examined the effect of time students spend on smartphones per day and their academic performances and reported the possible harm the excessive use poses on students’ academic performance. There are several other factors which may vary from personal, cultural, social-economic, psychological, academic, demographic, psychosocial, personality, cognitive to other environmental factors ([2-7]). In addition, due to rapid advancement in the field of information technology, student data (which includes enrolment data, academic data and so on) accumulated by the education institution in their database are constantly increasing. This has led many researchers to employ various branches of artificial intelligence such as data mining and machine learning techniques in the development of more efficient models which can more accurately predict students' academic performance than previously possible.
Predicting students’ performance using data mining methods has been performed at various levels: at a tutoring system level to predict whether some specific knowledge or skills are mastered, at job selection level to predict the students’ behaviour in an educational environment and his/her career objective or placement performance ([8-9]), at a course level or degree level to predict whether a student will pass a course or a degree, or to predict her/his mark ([10-13]). Conversely, this research work focuses on Grade Point Average (GPA) of students at the end of each semester using AI to predict students’ performance as early as at the start of a new semester which will help universities not only to focus more on bright students but also to initially identify students who might be at-risk of failing and find ways to support them. This paper is further organized as follows, Section 2 discusses the review of the related works; Section 3 presents the research approach, data collection and model development; Section 4 discourses the results while Section 5 concludes the paper.
-
II. Related Works
Several studies deployed and compared various data mining techniques for either classification or regression task in respect to predicting academic performance of student whether it is at subject/course level, semester/degree level, postgraduate level (traditional learning environment) or at intelligent tutoring system/learning management system level (at distance learning environment). However, a thorough search of literature yielded only few that have compared neural network models for the prediction of students’ academic performance in order to determine the most appropriate model that can be recommended to educational managers, faculty, as well as student for making academically informed yet timely decisions.
“Ref. [14]” proposed a model for predicting the mathematics achievement of pre-university students using back propagation neural network (BPNN), classification and regression tree (CART) and generalized regression neural network (GRNN). The research findings reveal that the overall performance of BPNN outperforms the CART and GRNN models in predicting the mid-semester evaluation result with the highest hit rate of 66.67% and the lowest root mean square error (RMSE) of 0.7174, as well as in predicting the final examination result with the highest hit rate of 71.11% and the lowest RMSE of 0.4733 respectively. “Ref. [5]” developed a generalized regression neural network model for the prediction of student academic performance. The result shows that among the variable considered previous performance of the students measured in scores had the largest regression value. This therefore shows the applicability of generalized regression neural network model in students’ performance prediction.
“Ref. [16]” compared two neural network models (Multilayer perceptron (MLP) and Radial basis function (RBF)) with two other algorithms (Multiple linear regression-MLR, Support vector machine-SVM) on the prediction of academic performance of students in an introductory engineering course titled “Engineering Dynamics”. Amongst MLR, MLP, RBF and SVM classifier used for prediction, SVM outperformed the other models with an accuracy of 89% and therefore identified as the most superior model for the prediction. “Ref. [17]” proposed a fuzzy probabilistic neural network (FPNN) model designed in MATLAB environment for predicting students’ academic performance in order to classify them based on their similar characteristics. The research findings demonstrate that FPNN model gave an average classification accuracy of 98.56% and went further to reveal that the proposed model was achieved at a very minimal training time which is in line with the conclusion found in [18].
“Ref. [10]” explored the possibility of predicting students’ performance based on their academic data at an early stage of their degree program. Two datasets of the collected data were fed to the MLP network and other data mining techniques like Decision Tree, Rule Induction, K-Nearest Neighbour, and Naive Bayes. The result shows Naive Bayes outperformed other technique. It also stated that students’ degree performance prediction is possible without any socio-economic or demographic feature but with just their academic data (Pre-university marks and marks obtained in year 1 and year 2). “Ref. [19]” applied Neural Network, Decision tree, Support vector machine, K-Nearest Neighbor and Naïve Bayes techniques in its prediction. It discovered that among the technique reviewed, ANN and DT were the two method mostly used in predicting students’ performance and Artificial neural network outperformed the other algorithms.
“Ref. [20]” studied the performance of undergraduate students using data mining approach to predict students’ academic achievement at the end of a four-year study programme as well as studying typical progressions, combining them with prediction results. It was reported that focusing on a small number of courses that are indicators of good or poor performance, it is possible to provide a timely counsel to low achieving students, as well as high performing students.
“Ref. [21]” uses decision tree approach for predicting students’ academic performance. Statistical Package for Social Studies (SPSS) was used in producing the decision tree structure. The research shows that factors such as finance level, motivation level, gender and grades contribute to academic performance and established that female students performed better than their male counterpart. The study recommended that educational institutions need to pay more attention to efficient prediction analysis in education to determine students’ academic performance for making better decision.
“Ref. [22] identifies the learning ability of the learners using rough set and data mining approaches through a sample online/e-learning mode. The study establishes that the choice of course and performance of the learners depends on the mode of learning.
Though existing models have achieved their specific objectives, but with reference to this research, limited number of study have looked into the prediction of students’ academic performance using different artificial neural network models and comparing these models in order to choose the most suitable model. Some of the reviewed literature have either made predictions and/or comparisons of several data mining models based on a combination of factors, which can lead to excessive training time of the model and consequently wastage of system resources. This research investigated the accuracy of neural network models in predicting students’ academic performance (GPA) based on single performance factor (academic data). The single factor (students’ raw scores) was identified to be a high predictor variable in the prediction of students’ academic performance [10].
-
III. Data and Methodology
This study focuses on the use of neural network models for the prediction of students’ grade point average using data collected from the study location in south-western Nigeria. Fig. 1 shows a diagram of the model comparison framework which was applied in investigating the accuracy of the selected neural network models for predicting academic performance of students based on single performance factor using MATLAB neural network fitting tool.
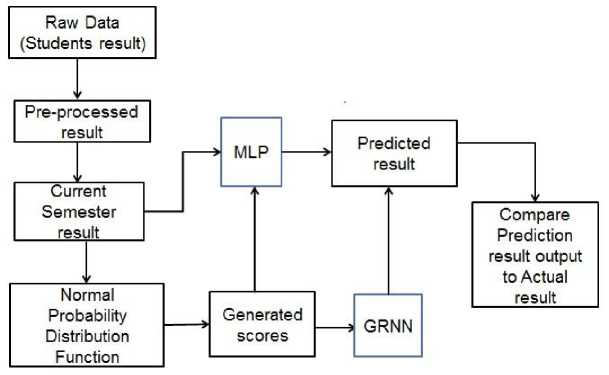
Fig.1. Framework for the comparative analysis of neural network models
-
A. Data
The collected dataset contains students’ academic record (raw scores) as the input parameter and the associated GPA as the output variable. Data preprocessing methods were used to eliminate students’ record with incomplete information needed for the study. Following this, the dataset was divided into training and testing dataset and fed to each neural network model selected for this study. The following performance metrics; Mean square error (MSE), Receiver operating characteristic (ROC) and Accuracy were used to evaluate and compare the performance of the selected models so as to identify the most appropriate for predicting students’ academic performance.
The data used for this study is the student academic data of one batch who graduated from Computer Science and Engineering Department of Obafemi Awolowo University, Ile-Ife Osun State, Nigeria. The data consists of the three B.Sc. degree options (B.Sc. Computer Engineering, B.Sc. Computer with Economics and B.Sc. Computer with Mathematics). A total of 100 graduated students’ data who enrolled in the academic batch of
2007– 2008 academic session were collected, analyzed and used for the prediction of students’ academic performance.
The data collected was stored in spreadsheet format following the identification of the variables needed for this study. Also for confidentiality, electronic data containing each student’s results excluded their personal information such as names and registration numbers made up of total scores and corresponding GPA of these students for three (3) sessions, that is, from Part1 to Part3 (6 semesters) were used. Table I gives a description of the data collected consisting of the variables used. It shows samples of students’ results recorded in terms of total scores and the GPA on some of the courses taken in Part1 (Harmattan and Rain Semesters). The numbers in parenthesis signify the corresponding course units.
-
B. Methodology
For the purpose of handling the problem as a regression problem, the students’ GPA was used as target output (output variable) and the students’ immediate previous semester results were used to predict the current semester. For every semester, students in Computer
Science and Engineering Department are required to register minimum of five (5) courses of not less than fifteen units. However, in this study, five (5) courses per semester were purposely selected for the study based on the assumptions that:
-
a. It must be a compulsory course offered by at least 90 percent of the students.
-
b. The selected courses units must not be less than two except for Part1 semesters.
-
c. The minimum number of course units the model experts use should not be less than fifteen in order to avoid much variation between the results that will be predicted and the actual results.
The foregoing is justified using Table II which shows the computed GPA of the selected 5 courses and the actual GPA of all registered courses for a particular semester as well as the error of the GPA computed with the selected five courses against the GPA of all the courses registered for by the student that semester.
Data were pre-processed for further analysis and normal probability distribution function was used to manipulate the pre-processed data into a suitable form. The distribution function generates random variable of the input data (scores). The processed data were fed to the selected artificial neural network models to solve regression problem (predicting students’ grade point average).
In this study, the input neurons were represented by scores of each selected course which is determined by Xi = {X1, X2, X3 …. Xi} where i, is the number of variables (input neurons). The dataset was divided into three portions (60:20:20) as a required step taken when using MATLAB simulation tool, 60% being the training dataset, 20% is the validation dataset and 20% is the testing dataset.
The MLP network was trained using levenberg-marquardt back propagation algorithm in MATLAB R2015a tool. This algorithm was chosen because it offers numerical solution to the problem of minimizing a nonlinear function and it has a fast and stable convergence ([23-24]). Each of the inputs (score) was assigned weights, added up with a bias and passed through a transfer function which was then forwarded to the hidden layer. Sigmoid/logistic function was used between the input layer and the hidden layer, then the output was modified by a non-linear function before being outputted and the result was compared with the output of experimental data by propagating the error. This was done by adjusting the weights until minimal error was attained in the network.
Table 1. Sample Dataset
|
ID |
CHM101-(4) |
CHM103-(1) |
CSC101-(2) |
MTH101-(5) |
PHY101-(4) |
GPA1 |
CHM102-(4) |
CSC102-(2) |
MTH102-(5) |
MTH104-(2) |
PHY102-(4) |
GPA2 |
|
1 |
36 |
70 |
62 |
50 |
53 |
2.72 |
46 |
46 |
41 |
46 |
46 |
2.32 |
|
2 |
71 |
70 |
64 |
53 |
60 |
3.94 |
75 |
53 |
71 |
57 |
67 |
4.14 |
|
3 |
55 |
75 |
70 |
45 |
43 |
2.72 |
53 |
61 |
60 |
45 |
48 |
2.97 |
|
4 |
58 |
72 |
53 |
62 |
54 |
3.50 |
54 |
60 |
54 |
53 |
44 |
3.16 |
|
5 |
71 |
72 |
82 |
55 |
70 |
4.39 |
73 |
74 |
73 |
51 |
69 |
4.46 |
|
6 |
65 |
76 |
73 |
60 |
72 |
4.39 |
68 |
66 |
70 |
52 |
70 |
4.38 |
|
7 |
62 |
74 |
70 |
50 |
54 |
3.56 |
60 |
52 |
51 |
47 |
47 |
3.27 |
|
8 |
46 |
77 |
48 |
40 |
55 |
2.22 |
48 |
40 |
40 |
40 |
46 |
1.97 |
|
9 |
58 |
75 |
71 |
77 |
59 |
4.06 |
53 |
67 |
62 |
43 |
51 |
3.68 |
|
10 |
51 |
74 |
51 |
50 |
23 |
2.50 |
43 |
86 |
55 |
53 |
26 |
2.41 |
|
11 |
47 |
71 |
61 |
47 |
60 |
2.94 |
67 |
52 |
50 |
50 |
29 |
2.81 |
|
12 |
42 |
74 |
52 |
40 |
44 |
1.67 |
37 |
60 |
50 |
50 |
43 |
1.92 |
|
13 |
74 |
73 |
52 |
65 |
64 |
4.17 |
60 |
74 |
63 |
43 |
54 |
3.84 |
|
14 |
52 |
70 |
66 |
41 |
57 |
2.72 |
61 |
55 |
63 |
60 |
62 |
3.32 |
|
15 |
47 |
77 |
38 |
46 |
44 |
1.89 |
53 |
50 |
43 |
40 |
44 |
1.95 |
|
16 |
54 |
78 |
68 |
50 |
56 |
3.39 |
55 |
58 |
63 |
48 |
56 |
3.32 |
|
17 |
50 |
80 |
47 |
51 |
58 |
3.00 |
35 |
40 |
50 |
40 |
29 |
2.16 |
|
18 |
47 |
72 |
67 |
42 |
44 |
2.06 |
61 |
66 |
40 |
40 |
17 |
2.46 |
|
19 |
67 |
77 |
65 |
61 |
48 |
3.56 |
40 |
61 |
70 |
45 |
52 |
3.38 |
|
20 |
58 |
75 |
79 |
66 |
54 |
3.72 |
50 |
61 |
50 |
40 |
44 |
3.16 |
Table 2. Error of GPA Computed with 5 Courses against all Registered Courses
|
ID |
CHM101 (4) |
CSC101 (2) |
MTH101 (5) |
PHY101 (4) |
PHY107 (1) |
Predicted GPA (5 courses) |
Actual GPA |
Error |
|
1 |
71 |
64 |
53 |
60 |
52 |
3.88 |
3.94 |
0.016 |
|
2 |
55 |
70 |
45 |
43 |
66 |
2.50 |
2.72 |
0.081 |
|
3 |
71 |
82 |
55 |
70 |
70 |
4.38 |
4.39 |
0.003 |
|
4 |
65 |
73 |
60 |
72 |
63 |
4.38 |
4.39 |
0.003 |
|
5 |
62 |
79 |
59 |
54 |
54 |
3.50 |
3.56 |
0.017 |
|
6 |
46 |
48 |
40 |
55 |
48 |
1.94 |
2.22 |
0.127 |
|
7 |
58 |
71 |
77 |
59 |
60 |
3.94 |
4.06 |
0.030 |
|
8 |
51 |
51 |
50 |
23 |
57 |
2.25 |
2.50 |
0.100 |
|
9 |
47 |
61 |
47 |
60 |
40 |
2.69 |
2.94 |
0.086 |
|
10 |
74 |
52 |
65 |
64 |
64 |
4.13 |
4.17 |
0.011 |
-
IV. Result and Discussion
0.8
0.2
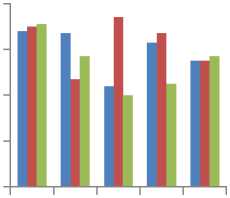
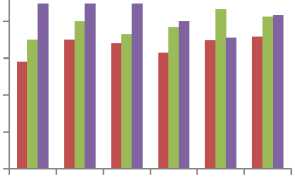
The GRNN network was built by selecting the proper spread parameter. For the purpose of attaining desired estimation accuracy in this study, six networks of different spread parameters such as 0.35, 0.45, 0.55, 0.65, 0.75 and 0.85 were tested and it was observed that the best GRNN network was achieved with spread parameter 0.45. The output produced by the network was repetitively compared with the target output and each time the connecting weights were adjusted slightly to the direction of the target GPAs. It can also be seen that for the tested MLP networks (Fig. 2), the network with 10 hidden neuron provided better prediction accuracy on all the study options when compared to the rest of the tested networks with their respective neurons.
Fig. 2 shows the performance of MLP networks when different numbers of hidden neuron were being tested in order to find the most optimal network that can provide accurate predictions for the three degree options while Fig. 3 shows that of the GRNN in terms of the spread parameters. Following the selection of the number of hidden neurons for MLP and that of spread parameter for GRNN (the optimal networks), the networks were then further trained. Fig. 4 shows the performance plot of the function developed for MLP network where the best validation achieved is 0.061275 at epoch 6.
A uc 0.6 r
a yc 0.4
■ CEngr
■ CEcons
■ CMaths
10 15 20 25 30
No of Neurons
-
Fig.2. General MLP performance for different options
0.2
0.35 0.45 0.55 0.65 0.75 0.85
Ac 0.8 c ur 0.6 a c y 0.4
■ CEngr
■ CEcons
■ CMaths
Spread parameter
-
Fig.3. General GRNN performance for different options
Thus, the best linear fit realized in MLP model is 0.99603 which is approximately 1, thereby showing a good agreement between the predicted output and the target output. Finally, the error histogram which depicts the performance of MLP model is also shown in Fig. 6. In the performance plot, the Mean square error which is the average squared difference between outputs and targets is small, also the validation set and test set have similar characteristics with no significant occurrence of over fitting which therefore shows a good prediction accuracy. Fig. 5 shows the regression plot of the network response between ANN outputs and the corresponding targets.
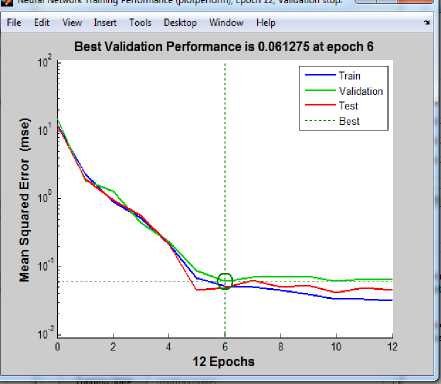
Fig.4. Performance Plot for MLP model
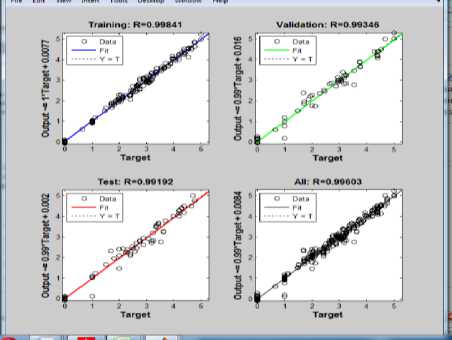
Fig.5. Regression Plot of all Training, Validation and Testing Data
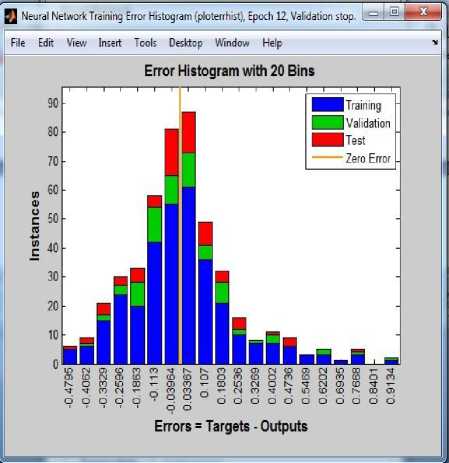
Fig.6. Error Histogram showing network error values.
A regression value of zero (0) means a random relationship between the predicted data and the experimental data while a regression value of one (1) means there is a linear relationship between the data. The model was simulated and the result presented in Figs. 7, 8 and 9. By using students’ actual scores to predict their forthcoming GPA, it was observed that MLP model had a better performance than the GRNN model. This observation is shown in Fig. 10.
Performance evaluation results from the selected ANN models (MLP and GRNN) for computer science and engineering option, computer with economics option and computer with mathematics option are shown in Figs. 11, 12 and 13. The Figures show the MSE, ROC in terms of true positive rate (TPR) and false positive rate (FPR) and the accuracy results obtained from the models. The evaluation shows that GRNN model outperformed MLP with minimum MSE, high TPR (correctly predicted GPA), low FPR (wrongly predicted GPA) and high accuracy.
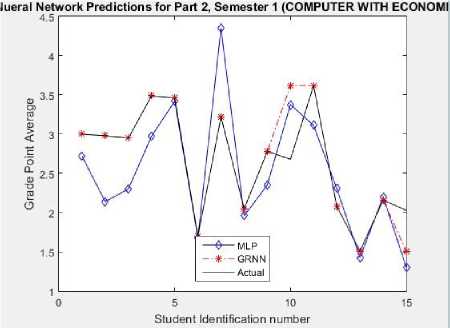
Fig.7. Graphical plot of the NNMs models prediction output for CEcons
Finally, the models generated were further compared with statistical t-test method using a confidence interval of 95%.
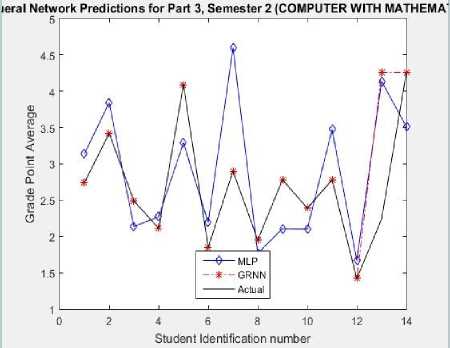
Fig.8. Graphical plot of the NNMs prediction output for CMaths
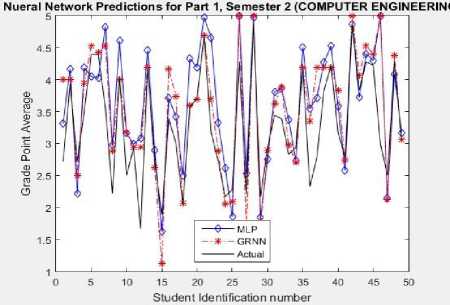
Fig.9. Graphical Plot of the NNMs prediction output for CEngr
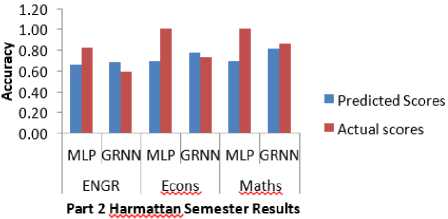
Fig.10. Prediction performance of MLP and GRNN using students’ actual scores
The t-test results were presented using analysis of variance as shown in Table 3 (ANOVA table). The analysis consists of Sum of Squares (SS), degrees of freedom (df), Mean Square (MS), F (F-ratio), and Sig (p- value). The table describes that the p-value (0.6854) suggests acceptance of null hypothesis (Ho) at 95% confidence interval that there is no significant difference between both samples (predicted and actual results). Thus, they were drawn from population with the same mean.
Table 3. Analysis of variance result
|
ANOVA Table |
|||||
|
Source |
SS |
df |
MS |
F |
Prob> F |
|
Columns |
0.0974 |
1 |
0.09741 |
0.17 |
0.6854 |
|
Error |
56.6335 |
96 |
0.58993 |
||
|
Total |
56.7309 |
97 |
|||
Results-(COMPUTER ENGINEERING-Part 1, Semester 2)
|
GPA Prediction using Students* Predicted Scores Network MSE ROC Acuracy TPR FPR MLP 0.40 0.77 0.37 0.69 GRNN 0.34 0.81 0.35 0.69 |
||
|
Results-(COMPUTER ENGINEERING-Part 2, Seitester 1) |
Results-(COMPUTER ENGINEERING-Part |
2, Semester 2) |
|
GPA Prediction using Students' Predicted Scores Rework MSE ROC Acuracy TPR FPR MLP 0.32 0.78 0.35 0.67 GRNN 0.13 0.86 0.25 0.88 |
GPA Prediction using Students' Predicted Scores Network MSE ROC Acuracy TPR FPR MLP 0.52 0.69 0.25 0.45 GRNN 0.30 0.78 0.15 0.80 |
|
|
Results-(COMPUTER ENGINEERING-Part 3, Semester 1) |
Results-(COMPUTER ENGINEERING-Part |
3, Semester 2) |
|
GPA Prediction using Students' Predicted Scores Network MSE ROC Acuracy TPR FPR MLP 0.51 0.73 0.30 0.55 GRNN 0.19 0.88 0.23 0.90 |
GPA Prediction using Students' Predicted Scores Network MSE ROC Acuracy TPR FPR MLP 0.55 0.73 0.28 0.53 GRNN 0.23 0.85 0.23 0.84 |
|
Fig.11. Screenshot of evaluation results of MLP and GRNN models for CEngr
Results-(COMPUTER WITH ECONOMICS-Part 1, Semester 2)
GPA Prediction using Students* Predicted Scores
Network MSE ROC Acuracy
TPR
MLP 0.740.66
GRNN 0.600.74
Results-(COMPUTER WITH ECONOMICS-Part 2, Semester 1)
FPR
0.250.47
0.290.60
Results-(COMPUTER WITH ECONOMICS-Part 2, Semester 2)
|
GPA Prediction using Students' Predicted Scores |
||||
|
Network |
MSE |
ROC |
Acuracy |
|
|
TPR |
FPR |
|||
|
MLP |
0.33 |
0.71 |
0.26 |
0.53 |
|
GRNN |
0.05 |
0.75 |
0.16 |
0.87 |
|
GPA Prediction using Students' Predicted Scores |
||||
|
Network |
MSE |
ROC |
Acuracy |
|
|
TPR |
FPR |
|||
|
MLP |
0.43 |
0.68 |
0.24 |
0.47 |
|
GRNN |
0.03 |
0.80 |
0.20 |
0.93 |
Results-(COMPUTER WITH ECONOMICS-Part 3, Semester 2)
Results-(COMPUTER WITH ECCNOMICS-Part 3, Semester 1)
GPA Prediction using Students’ Predicted Scores
|
Network |
MSE |
ROC |
Acuracy |
|
|
TPR |
FPR |
|||
|
MLP |
1.08 |
0.55 |
0.16 |
0.20 |
|
GRNN |
0.10 |
0.72 |
0.13 |
0.87 |
GPA Prediction using Students' Predicted Scores
|
Network |
MSE |
ROC |
Acuracy |
|
|
TPR |
FPR |
|||
|
MLP |
0.65 |
0.62 |
0.18 |
0.33 |
|
GRNN |
0.06 |
0.80 |
0.20 |
0.93 |
Fig.12. Screenshot of evaluation results of MLP and GRNN models for CEcons
Results-(COMPUTER WITH MATHEMATICS-Part 1, Semester 2)
GPA Prediction using Students' Predicted Scores
|
Network |
MSE |
ROC |
Acuracy |
|
|
TPR |
FPR |
|||
|
MLP |
0.80 |
0.67 |
0.27 |
0.50 |
|
GRNN |
0.68 |
0.78 |
0.34 |
0.71 |
Results-(COMPUTER WITH MATHEMATICS-Part 2, Semester 1) Results-(COMPUTER WITH MATHEMATICS-Part 2, Semester 2)
GPA Prediction using Students' Predicted Scores GPA Prediction using Students' Predicted Scores
|
Network |
MSE |
ROC |
Acuracy |
Network |
USE |
ROC |
Acuracy |
||
|
TPR |
FPR |
TPR |
FPR |
||||||
|
MLP |
0.23 |
0.75 |
0.36 |
0.71 |
MLP |
0.27 |
0.72 |
0.28 |
0.57 |
|
GRNN |
0.11 |
0.72 |
0.14 |
0.86 |
GRNN |
0.14 |
0.69 |
0.10 |
0.86 |
|
Results- |
(COMPUTER WITH MATHEMATICS- |
-Part 3, Semester 1) |
Results- |
(COMPUTER WITH MATHEMATICS- |
•Part 3, Semester 2) |
||||
|
GPA Prediction using Students' Predicted Scores |
GPA Prediction using Students' Predicted Scores |
||||||||
|
Network |
MSE |
ROC |
Acuracy |
Network |
MSE |
ROC |
Acuracy |
||
|
TPR |
FPR |
TPR |
FPR |
||||||
|
MLP |
1.64 |
0.66 |
0,22 |
0.43 |
MLP |
0.67 |
0.72 |
0.28 |
0.57 |
|
GRNN |
0.06 |
0.75 |
0.17 |
0.86 |
GRNN |
0.29 |
0.78 |
0.18 |
0.93 |
Fig.13. Screenshot of evaluation results of MLP and GRNN models for CMaths
V. Conclusion
Predicting students’ performance is mostly useful to help educators and learners improve their learning and teaching process. This research work shows a step-by-step and consistent procedure towards actualising students’ performance prediction based on single performance factor using neural network models with generalized regression neural network giving a very high prediction accuracy. Hence, the model can be successfully employed to generate experimental data (scores) and predict the students’ grade point averages, thereby aid in the students’ performance advisory process.
Artificial neural network offers some favourable features such as generalization, efficiency and simplicity, which makes it suitable for predicting students’ academic performance. Increasing the number of dataset can positively influence the capability of neural networks to understand the complex behaviour of the system and update the learning parameters in order to generate a better performance. The current knowledge of students’ performance prediction based on single performance factor is still limited. More work can be done using other neural network models or various other intelligent system techniques such as fuzzy logic, Bayesian networks and so on.
References Predicting student academic performance in computer science courses: a comparison of neural network models
- D. D. Felisoni and A. S. Godoi, “Cell phone usage and academic performance: An experiment”. Computers and Education, 117, 175-187. 2018.
- M. J. Akomolafe, “Personality Characteristics as Predictors of Academic Performance of Secondary School Students” Mediterranean Journal of Social Sciences, 4(2):657-664. 2013.
- T. Farsides, and R. Woodfield, “Individual Differences and Undergraduate Academic Success: The Roles of Personality, Intelligence, and Application”. Personality and Individual Differences, 34:1225–1243. 2003.
- K. McKenzie and R. Schweitzer, “Who succeeds at university? Factors predicting academic performance in first year Australian university students”. Higher Education Research and Development, 20(1):21-33. 2001.
- E. Osmanbegovic, H. Agić and M. Suljic, “Prediction of Students' Success by Applying Data Mining Algorithams”. Journal of Theoretical and Applied Information Technology, 61(2):378 - 388. 2014.
- M. Ramaswami and R. Bhaskaran, “A CHAID based performance prediction model in educational data mining”. IJCSI International Journal of Computer Science Issues, 7(1):10-18. 2010.
- F. Sarker, T. Tiropanis and H. C. Davis, (). Students’ performance prediction by using institutional internal and external open data sources. Available at: http://eprints.soton.ac.uk/353532/ Date Accessed: 21st January, 2016. 2013.
- S. Venkatramaphanikumar, K. Prudhvi Raj, D. S. Bhupal Naik and K. V. Krishna Kishore, “A Novel Prediction Model for Academic Emotional Progression of Graduates”. ARPN Journal of Engineering and Applied Sciences, 10(6):2561-2569. 2015.
- K. J. Sathick and A. Jaya, “Extraction of Actionable Knowledge to Predict Students’ Academic Performance using Data Mining Technique- An Experimental Study”. International Journal of Knowledge Based Computer System, 1(1). 2013.
- R. Asif, A. Merceron and M. K. Pathan, “Predicting Student Academic Performance at Degree Level: A Case Study”. International Journal of Intelligent Systems and Applications, 7(1):49. 2014.
- P. Cortez and A. Silva, “Using Data Mining to Predict Secondary School Student Performance” 15th Portuguese Conference on Artificial Intelligence, EPIA 2011, Lisbon Portugal, 491-505. 2011.
- A. Mueen, B. Zafar and U. Manzoor, “Modeling and Predicting Students' Academic Performance Using Data Mining Techniques”. International Journal of Modern Education and Computer Science, 8(11), p.36. 2016.
- M. Singh and J. Singh, “Machine Learning Techniques for Prediction of Subject Scores: A Comparative Study”. International Journal of Computer Science and Network, 2 (4):77-79. 2013.
- C. T. Lye, L. N. Ng, M. D. Hassan, W. W. Goh, C. Y. Law, and N. Ismail, “Predicting Pre-university. student's Mathematics achievement. Procedia-Social and Behavioral Sciences, 8:299-306.
- G. A. El-Refae and Q. K. Al-Shayea, “Predicting Students’ Academic Performance Using Artificial Neural Networks: A Case Study”. International Journal of Computer Science and Information Security (IJCSIS), 8 (5):97-100. 2010.
- S. Huang and N. Fang, “Prediction Of Student Academic Performance In An Engineering Dynamics Course: Development and validation of multivariate regression models”. International Journal of Engineering Education, 26(4):1008-1017. 2010.
- N. Arora and J. R Saini, “A Fuzzy Probabilistic Neural Network for Student’s Academic Performance Prediction”. International Journal of Innovative Research in Science, Engineering and Technology, 2(9):4425-4432. 2013.
- J. N. Undavia, P.M. Dolia and A. Patel, “Comparison of Decision Tree Classification Algorithm to Predict Students Post Graduate Degree in Weka Environment”. International Journal of Innovative and Emerging Research in Engineering, 1(2):17-21. 2014.
- A. M. Shahiri and W. Husain, “A Review on Predicting Student's Performance Using Data Mining Techniques”. Procedia Computer Science, 72:414-422. 2015.
- R. Asif, A. Merceron, S. A. Ali and N. G. Haider, “Analyzing undergraduate students' performance using educational data mining”. Computers & Education, 113, 177-194. 2017.
- K. D. Kolo, S. A. Adepoju and J. K. Alhassan,"A Decision Tree Approach for Predicting Students Academic Performance", International Journal of Education and Management Engineering(IJEME), Vol.5, No.5, pp.12-19, 2015.DOI: 10.5815/ijeme.2015
- A. Kangaiammal, R. Silambannan, C. Senthamarai, and M. V. Srinath. “Student Learning Ability Assessment using Rough Set and Data Mining Approaches”. International Journal of Modern Education and Computer Science, 5(5), 1. 2013.
- Ö. Kisi, “Multi-layer perceptrons with Levenberg-Marquardt training algorithm for suspended sediment concentration prediction and estimation”. Hydrological Sciences Journal, 49(6). 2004.
- H. Yu and B. M. Wilamowski, “Levenberg–Marquardt Training”. Industrial Electronics Handbook, 5(12):1. 2011.
