Prediction of Dye Adsorption in Textile Industry using Machine Learning
Журнал: International Journal of Image, Graphics and Signal Processing @ijigsp
Статья в выпуске: 5 vol.18, 2026 года.
Бесплатный доступ
Adsorption of dyes present in textile industry waste water is an important process for environmental remediation and pollution control. Dyes are complicated organic compounds used in textile dyeing processes. The presence of dyes in wastewater is of major environmental concern because of their recalcitrance and potential toxicity. Adsorption technology is a promising solution for the removal of dyes from textile wastewater. It uses adsorbent materials to capture and immobilize dye molecules from aqueous solution. Machine learning techniques have been used to reduce the analytical efforts for prediction of concentration of dye solution in parts per million using a UV spectrophotometer. In the research work, a prediction technique using Machine Learning and image processing is used to identify the color of images of samples and corresponding adsorption of the dye. The suggested model has achieved correct dye concentration estimates using retrieved image attributes with 93% accuracy with experimental data.
Короткий адрес: https://sciup.org/15020786
IDS: 15020786 | DOI: 10.5815/ijigsp.2026.05.11
Текст научной статьи Prediction of Dye Adsorption in Textile Industry using Machine Learning
The textile sector is a substantial contributor to worldwide environmental concerns, notably owing to the massive use of dyes and the complicated dyeing processes involved. The textile industry plays a significant role in the global economy, producing a wide range of fabrics and garments for consumer use. However, the production processes in the textile industry often involve the extensive use of dyes to impart color and aesthetics to the textile materials. As a result, large quantities of dye-containing wastewater are generated, posing environmental challenges due to the presence of complex and persistent organic compounds. Dyes used in the textile industry are designed to be vibrant and long-lasting, but their chemical properties make them resistant to degradation, leading to potential environmental pollution when released into water bodies. The presence of dye effluents in wastewater not only affects aquatic ecosystems but also poses health risks and aesthetic concerns. Adsorption technology has emerged as a promising and effective method for the removal of dyes from textile industry wastewater. Adsorption involves the adhesion of dye molecules onto the surface of solid materials, known as adsorbents, leading to the purification of wastewater by capturing and immobilizing the dyes. Various adsorbent materials with high surface areas and porosities have been explored for their ability to adsorb textile dyes efficiently.
The adsorption of dyes from the textile industry wastewater is a complex process influenced by factors such as the physicochemical properties of the dye molecules, the characteristics of the adsorbent materials, solution conditions (pH, temperature), and the presence of competing ions. Understanding the adsorption mechanisms and optimizing the process parameters are essential for enhancing the efficiency of dye removal from textile effluents.
Machine learning (ML) represents a sophisticated data-driven methodology that offers a framework for elucidating intricate and nonlinear connections between input and output parameters within a process [1-2]. The distinctive capacity of ML models to learn autonomously, employ uncomplicated algorithmic designs, and execute rapid computations endows them with the ability to deliver precise and optimal solutions, making them viable alternatives to traditional models [3-7]. Moreover, the enhanced predictive accuracy achieved by ML models can be attributed to their proficiency in extrapolating relationships between variables without necessitating explicit knowledge of the system's underlying physics [8-10]. ML techniques were not used for dye concentration prediction before. This is the first different approach and attempt to use an ML technique for dye concentration prediction to minimize the use of a UV spectrophotometer using a colorimetric approach.
Advancements in image processing and machine learning provide captivating answers to these difficulties. Image processing has been used to record and evaluate the colorimetric qualities; it is able to link these attributes with the PPM of the dye solution. These algorithms can manage the complicated, non-linear interactions between picture attributes and dye concentration, delivering more accurate and trustworthy predictions compared to older approaches. This research attempts to harness the synergy between image processing and machine learning to estimate the PPM of dye solutions pre- and post-absorption. By establishing accurate prediction models, we attempt to optimize the accuracy and efficiency of adsorption operations.
2. Literature Review
Dye-laden wastewater from textile and related industries is still a big environmental concern. Usually the dye levels in those effluents run from about 10 to 200 mg/L—enough to mess with ecosystems, cause toxicity, and even raise cancer risks. The scale is real: roughly 700,000 tons of dyes are made each year, and nearly 140,000 tons end up in wastewater. In response, adsorption has turned out to be one of the most practical treatment routes, especially with fancy nanomaterials like nanozeolites. They’re appealing because they’ve got high surface area, a porous structure, and handy ion-exchange properties. Reported adsorption capacities generally sit between 0 and 60 mg/g, although much higher values—up to 250 mg/g—have been seen for certain dyes like Acridine Orange, while Crystal Violet shows a more modest uptake around 48 mg/g. How well the adsorption works depends a lot on conditions like adsorbent dosage (0.5–4.5 g/L), dye concentration (15–900 mg/L), pH (3–11), and contact time (5–150 minutes). It’s also clear that cationic dyes are more readily adsorbed than anionic ones because of favorable electrostatic interactions, and simple operational tweaks—like using magnetic stirring instead of sonication—can noticeably boost adsorption efficiency. Additionally, molecular weight seems to play an important role, showing a meaningful correlation with adsorption behavior [11-13].
In recent years, machine learning has offered a fresh take on understanding and tuning adsorption systems. With pretty large datasets—take 446 samples comprising over 7,000 data points, for example—these models can really pull out the messy, non-linear relationships between process variables and adsorption performance. Among the approaches, XGBoost has shown particularly strong predictive capability—very high accuracy during training, and it stays reliable on testing (R² > 0.8) with low error values. Artificial Neural Networks also look promising, though they may show higher prediction errors in some cases. Looking at variable importance, dye concentration is the most influential factor for adsorption capacity, followed by adsorbent dosage, contact time, and pH. All in all, this suggests adsorption efficiency comes from a mix of material properties and operating conditions, with nanozeolites offering considerable potential for high-efficiency dye removal. The integration of machine learning not only improves prediction accuracy but also reduces the need for extensive experimentation, making it a powerful tool for process optimization and future scale-up of wastewater treatment systems [14-16].
The primary objective of the proposed work is not to replace the adsorption process itself, but to develop a lowcost and accessible prediction framework for estimating dye concentration in situations where a conventional UV spectrophotometer may not be available.
3. Proposed Methodology
The systematic goal of this research is to predict dye absorption in textile samples by machine learning and image processing methods. Initially, the model starts by collecting a dataset consisting of captures of dyed textile samples, indicating varied dye concentrations or other important characteristics. The feature extraction process begins, employing several ways to acquire distinguishing properties from the captures. Specifically, Gray-Level Co-Occurrence Matrix (GLCM) analysis is applied to extract texture-related parameters, including contrast, dissimilarity, homogeneity, energy, correlation, and angular second moment (ASM). Fig. 1 presents the architectural pipeline of the proposed method.
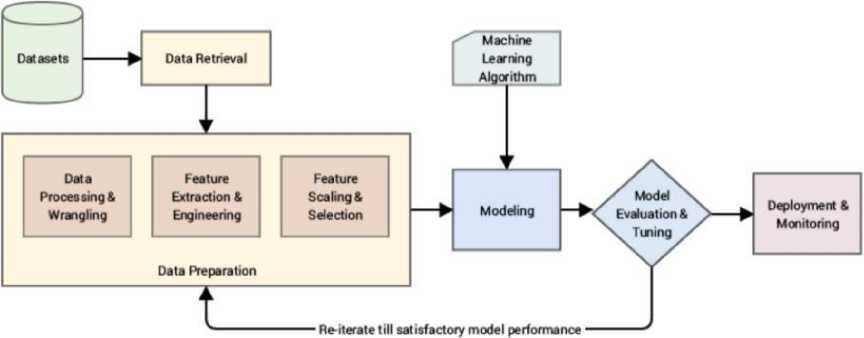
Fig. 1. Machine Learning pipeline for prediction of Dye concentration.
-
3.1. Dataset Preparation
-
3.2. Extraction of Features using the Gray Level Co-occurrence Matrix (GLCM)
For any particular dye if the concentration is known, the adsorption (measured in PPM) can be predicted using a lookup table. Hence in the laboratory, the dye with different concentration was generated. Fig. 2 presents images of the dye with particular concentration captured in the laboratory.
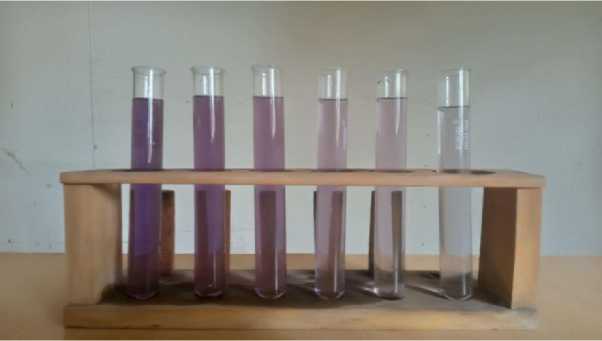
Fig. 2. Images of the dye adsorption captured in the laboratory during adsorption of the dye.
The color of the dye and the concentration of the dye are used as ground truth labels for supervised learning for prediction of dye adsorption. Fig. 3 presents the generation of dataset along with ground truth labels for ML experimentation.
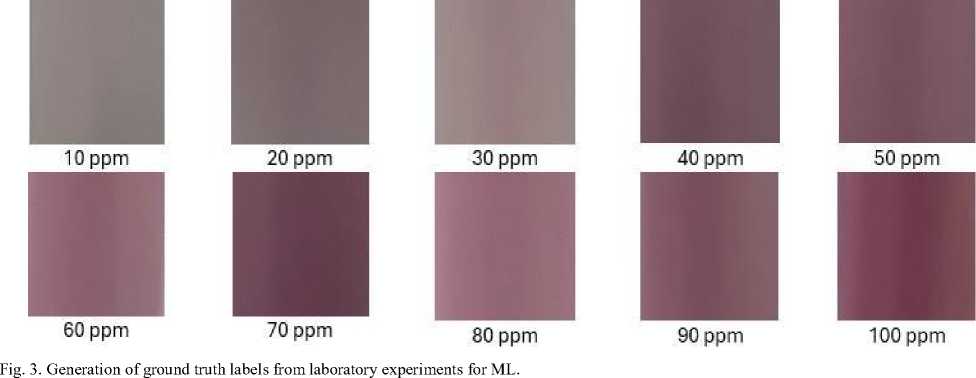
Surface texture changes during adsorption. As dye molecules are adsorbed, the surface morphology of the adsorbent undergoes observable changes that can be captured by image analysis. These variations appear as alterations in grayscale intensity, which correspond to separate adsorption stages. To determine the extent of these changes, we extracted textural features from the images using the GLCM, a statistical method that records spatial correlations between pixel intensities.
-
a. Constructing the GLCM
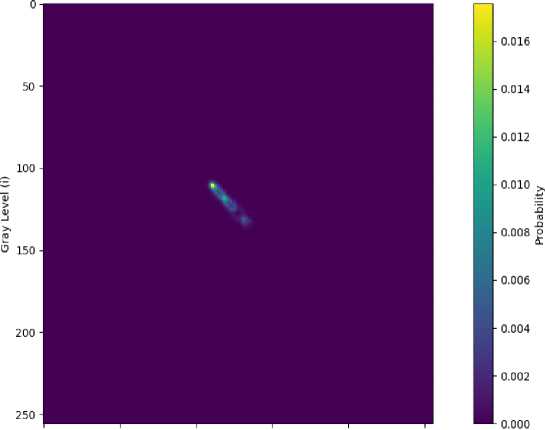
Each grayscale image I, which is represented by pixel values /( i,j ) is analyzed using the GLCM matrix P(d, ) to measure the co-occurrence of pixel values at a certain spatial distance d and orientation. The spatial relationships account for the changes in texture caused by adsorption. The GLCM is formally defined as Eq. 1
p (d,e\ j =
_!№,?)_
ItMd.e)
Optimal GLCM (d=5, 6=0.00)
0 50 100 150 200 250
Fig. 4. Construction of GLCM with distance d=5 and angle as 0°.
-
b. Statistical Features from GLCM
The following statistical features can be defined after the construction of the GLCM.
-
(i) . Contrast: Contrast measures the variation of intensity differences between a pixel and its neighboring pixel across the entire image, which reflects surface roughness as dye accumulates. It is defined as in Eq. (2)
L-1L-1
Contrast = ^^( i -j)2P( i,j) i=oj=o
As more dye molecules are adsorbed, the surface becomes less heterogeneous, resulting in a higher contrast.
-
(ii) Dissimilarity: Dissimilarity measures the difference between neighboring pixel values, which can indicate the heterogeneous nature of adsorption sites. Eq. (3) represents the dissimilarity between the pixels
L-lL-l
Dissimilarity = 22 I i - j IP(iS) i=o j=o
This feature is critical to distinguish non-uniform dye adsorption patterns, particularly during the earliest stages of adsorption.
-
(iii) . Homogeneity: Homogeneity shows how close the distribution of elements in the GLCM is to the GLCM diagonal, which is an indication of a uniform adsorption pattern across the surface. This is especially apparent in later stages of adsorption when complete dye coverage is achieved. It is defined as Eq. (4).
L-lL-l
( ,■)
H о m о g en г ty = 22 1+ 2
1=0 j=0
Homogeneity increases as adsorption reaches equilibrium, indicating that the dye covers the surface more evenly.
-
(iv) . Energy: Energy is a measure of the textural homogeneity of the surface. When the surface reaches equilibrium in adsorption, energy increases. This suggests a more uniform distribution of dye. It is represented by Eq. (5).
L-lL-l
Energy = 22^ i J)2 i=oj=o
-
(v) . Correlation: Correlation quantifies the linear dependency between pixel values in the GLCM, describing the linear dependency of pixel intensities. This is consistent with ordered adsorption patterns. It is defined as in Eq. (6),
Correlation =
X^^(i-p^(-pdP(W
where
i
and
i
are the mean and standard deviation of pixel values. These features are computed over different GLCMs and represent the changes of dynamic texture as the adsorption process progresses. The extracted feature vector f of each image is constructed as shown in Eq. (7)
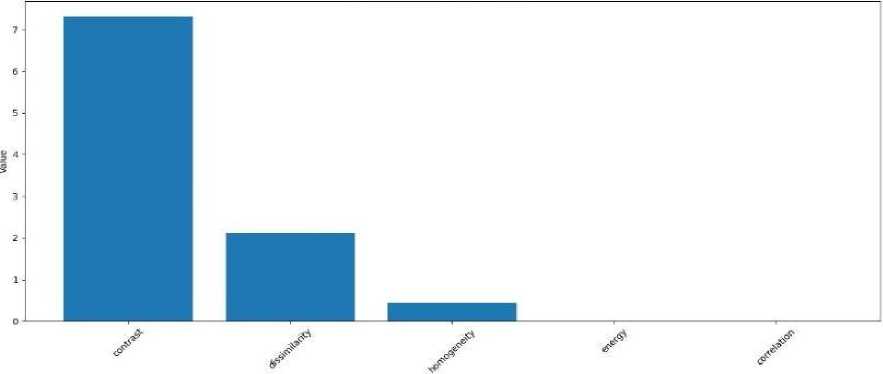
f = [С о ntrast, D issimi I arity, H о m о gene ity, Energy, С о rrelati on] The optimal GLCM features obtained are shown in Fig. 5. Optimal GLCM Features (d=5, 6=0.00) Fig. 5. Optimal GLCM features for Machine Learning pipeline.
3.3. Prediction of Dye Adsorption using Machine Learning models
The LightGBM machine learning model is used as an ML pipeline. The LightGBM ML model is used as the adsorption process is inherently nonlinear, influenced by numerous variables like dye concentration, adsorbent characteristics, and environmental conditions. Gradient boosting methods, such as LightGBM, are appropriate for capturing these nonlinearities. LightGBM is especially beneficial in this case due to
(i) . Efficiency: Capable of managing huge datasets with many features, making it excellent for high-dimensional GLCM feature vectors.
It also handles the prediction of several adsorption processes or dye types
(ii) . Multiclass Classification: The concentrations of the Dye represent multiclass classification.
(iii) . Gradient Boosting Framework: LightGBM uses gradient boosting to repeatedly minimize the prediction error. At each iteration, it generates a decision tree that corrects the faults committed by the previous tree. The model at iteration m is updated as in Eq. 8,
()= -1( )+ ⋅ ( )
(8)
where n is the learning rate, and
Treem
(
x
) is the
mth
decision tree. The objective function optimized is the multiclass cross-entropy loss, useful for adsorption classification tasks and can be represented as Eq. 9,
= i w Г c ∑[-∑ log(̂ ) l+ i=l k=l where, is the number of adsorption stages, is the real label, ̂ is the predicted probability, and .Ω( ) is the regularization term.
3.4. Model Training and Hyper parameter Tuning
Key hyperparameters of the LightGBM model are optimized via grid search and cross-validation. These parameters are as follows:
a. Number of Leaves: The number of leaves controls the complexity of each decision tree.
b. Max depth: Limits tree depths to prevent overfitting, ensuring that the model generalizes effectively to unknown data.
c. Learning rate: governs the step size of gradient changes.
These hyperparameters are set such that they balance the tradeoff between bias and variance. Steps of the proposed method are as follows: 1. Dataset preparation: Images of the different dye adsorption samples are taken during preparation in the laboratory 2. Image pre-processing: The images are resized into the same size for feature extraction. 3. Conversion of the images into grayscale images 4. GLCM Feature extraction of images 5. Splitting the prepared dataset of features into Testing and Training 6. Implementation of Light GBM model for prediction 7. Model training and hyper parameter tuning to obtain results In summary, for the proposed work, heterogeneous image-derived features such as the gray-level co-occurrence matrix were used. Also, the dataset is relatively small-to-medium. In the present study, the relationship between image attributes (RGB/color intensity features) and dye concentration is nonlinear and influenced by multiple correlated variables. The initial objective of this work was to establish the feasibility of machine learning-assisted dye concentration prediction using image processing and adsorption analysis. Therefore, LightGBM was adopted as the primary predictive model after preliminary internal testing showed satisfactory performance. LightGBM has the capability to efficiently handle non-linear relationships.
Fig. 6 presents the GLCM features of the grayscale image. The graph shows the optimal GLCM features at a distance of
d
= 5and angle
О
=0
∘
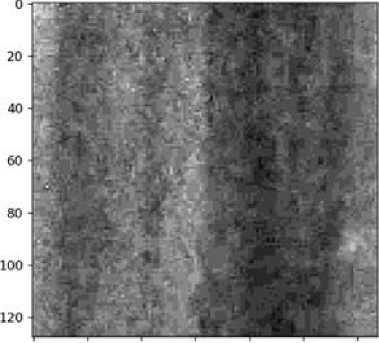
. Contrast has the highest value, indicating strong variations in pixel intensity and a highly non-uniform texture. Dissimilarity is moderate, supporting the presence of noticeable gray-level differences. In contrast, homogeneity is low, which confirms poor uniformity in the image. Both energy and correlation are close to zero, suggesting the absence of repetitive patterns and weak relationships between neighboring pixels. Overall, these features indicate that the sample has an irregular, heterogeneous texture, and the chosen parameters effectively capture this variation. Fig. 6 presents a sample image converted to grayscale for feature extraction.
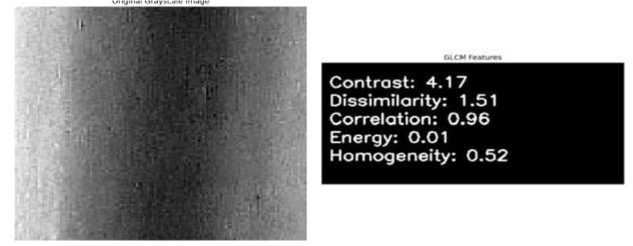
Sample Image 0 20 40 60 80 100 120 Fig. 6. Sample of dataset image converted to Grayscale. Fig. 7. Sample of dataset image with extracted GLCM features. Figure 7 shows the prediction of the dye adsorption is evaluated using the Mean Square error given as Eq.10.
Mean Square Error (MSE) = (actual value- predicted value)
2
Table 1 demonstrates the results of Actual and Predicted PPM and the Error Percentage of PPMs by the proposed ML Model. In Table 1, error is represented as a percentage. Table 1. Example of Actual-predicted and Error Percentage of PPMs by the Model.
Actual PPM
Predicted PPM
% Error
53 ppm
49 ppm
7.54 %
64 ppm
63 ppm
1.58 %
77 ppm
74 ppm
3.89 %
97 ppm
95 ppm
2.10 %
Table 1 shows that the predicted values are quite close to the actual concentrations, which indicates that the model is performing well. The error ranges from about 1.5% to 7.5%, with most values staying within a low error range. The prediction at 64 ppm is very accurate, while the 53 ppm case shows the highest deviation. Overall, the model slightly underpredicts the values but remains fairly consistent and reliable across the concentration range. Table 2 presents the experimental analysis of different Machine learning algorithms for the dataset. The proposed method is tested with Random Forest, SVM, XGBoost and LightGBM models. We added evaluation metrics MAE and RMSE for a better analysis of the performance validation. Table 2. Comparative Analysis of Machine Learning algorithms.
Model
Accuracy (%)
MAE
RMSE
Random Forest
88.4
0.124
0.196
Support Vector Machine
85.7
0.146
0.228
XGBoost
91.2
0.098
0.171
LightGBM
93.0
0.082
0.154
As shown in Table 2, the LightGBM model has the highest prediction accuracy (93%) and the lowest MAE and RMSE among all the evaluated models. While XGBoost also performed competitively, LightGBM achieved a better trade-off between prediction accuracy and computational efficiency. Hence, LightGBM was selected as the best model for prediction of dye concentration from image derived features in the adsorption study.
5. Conclusions The present study demonstrates that machine learning with image processing can be a promising approach to predict dye adsorption in textile samples. The GLCM based feature extraction was able to extract useful texture information from the images. But the results are slightly influenced by the limited samples with the same dye concentration and thus some prediction errors happened. This is a significant limitation of the study. Convolutional neural network (CNN) models can be employed in the future to enhance prediction accuracy because they can learn important features from the data automatically. Moreover, the development of a larger and more consistent dataset, especially with uniform dye concentrations, will be critical to improve the model's reliability and robustness. All the Declarations and StatementsAuthor Contributions Statement Archana Chaudhari – Conceptualization, Methodology, Review and Supervision: Proposed research ideas, Constructed the overall framework, Reviewed and edited the manuscript, and supervised project execution. Satchidananda Satpute – Proposed research ideas and data set creation Vivek Randad, Pratik Karde, Dipak Limbhore, Rushikesh Lonikar – Software Implementation, Model Training and validation, Statistical Analysis and Writing: Handled dataset preprocessing and implementing the research model, Led the model training process, validated results and benchmarked performance against existing methods, performed indepth analysis of experimental results, Drafted the initial manuscript. All authors have read and agreed to the published version of the manuscript. Conflict of Interest Statement The authors declare no conflicts of interest. Funding Declaration Not applicable as this research was not supported by any grant. Data Availability Statement Can be made available upon request to the corresponding author Ethical Declarations Not applicable as this study did not involve human subjects and/or animals. Acknowledgments We sincerely thank the Department of Instrumentation Engineering and Chemical Engineering for their support. We sincerely thank the anonymous reviewers for their professional evaluation and valuable recommendations, which have contributed to improving the quality of the manuscript. Declaration of Generative AI in Scholarly Writing AI-assisted technologies are used at very few places to strengthen the language and readability. Abbreviations The following abbreviations are used in this manuscript: GLCM- Gray Level Co-occurrence Matrix PPM - Parts per Minute GBM - Gradient Boosting Machine Appendix None.