Preliminary forest plant biomass inventory in monsoon tropical forest in Cat Tien national park (South Vietnam)
")
Author: Novichonok A.O., Evdokimova E.V., Markovskaya E.F., Kurbatova J.A.
Journal: Ученые записки Петрозаводского государственного университета @uchzap-petrsu
Section: Биология
Article in issue: 8 (129) т.1, 2012.
Free access
The results of forest plant biomass inventory in monsoon tropical forest in Cat Tien National Park are presented. The study demonstrates the differences in plant biomass production between forest areas with different levels of anthropogenic disturbance.
Cat tien national park, forest inventory, lagerstroemia calyculata, tropical forest biomass
Short address: https://sciup.org/14750317
IDR: 14750317 | UDC: 630*524.34
Text of the scientific article Preliminary forest plant biomass inventory in monsoon tropical forest in Cat Tien national park (South Vietnam)
Forest plantations in Vietnam, especially lowland forests in the southern part of the country, suffered severe damage during the 20th century [8]. The main causes were land clearing for farming, collection of forest products by the local population, excessive timber cutting, and the use of herbicides during the Vietnam War [4], [11], [12], [20]. At present, only 17 % (5,5 million hectares) of the total area of Vietnam is forested [7], whereas about 44 % of the area was covered with forests in 1944. The forest area reduction is considered to be one of the most important environmental threats in Vietnam. It is estimated that more than 6 million hectares have to be reforested in Vietnam [8]. The problem is aggravated by heavy overpopulation of the country that limits forest restoration and causes a conflict between man and nature. This situation is common in many tropical developing countries [18].
Lowland forests in southern Vietnam have been poorly studied. Only little data is available on structural and floristic parameters and successional trends of these forests, and questions regarding forest recovery are under discussion [6], [10], [17], [19]. The origin of these forests remains controversial. According to Trung [19] and Schmid [17], closed deciduous tropical forests dominated by Lagerstroemia calyculata Kurz belong to ‘climax forests’ whereas Rollet [15], [16] regarded them as secondary forests.
In this study we consider, like Brown and Lugo [6], primary (climax) forests as those which structural and floristic parameters do not reflect past degradation and secondary forests as those formed as a consequence of human impact.
In the southern part of Cat Tien National Park the tower for continuous eddy covariance and microclimate measurements has been set up. In view of this the question arises whether forest communities around the tower are representative, as carbon dioxide balance measured in these communities will serve for the estimation of the potential for carbon sequestration in tropical moist forests in South Vietnam.
The satellite data have shown that the forests of Cat Tien National Park appear like a mosaic of forest formations more or less dominated by Lager-stroemia species [2], which is confirmed by the field observations of Vandekerkhove et al. [21]. The degree of representativeness of the forests around the tower can be estimated on the basis of the taxonomic composition of communities and comparison with literature data.
The aim of this work is preliminary inventory of forests on the typical territory around the eddy covariance tower. The objectives of this study are to define the main types of plant communities in the study area, and estimate the productivity and representativeness of these communities for the national park.
MATERIALS AND METHODS
Study area . The study was carried out in the southern part of Cat Tien National Park, one of the largest national parks in Vietnam that covers an area of 720 km2. The study area was located within a 2-km radius of the eddy covariance tower (coordinates: 11°26’30’’N, 107°24’04’’E). The total study area was approximately 12 km2. The area is subject to a tropical monsoon climate with two distinct seasons: a rainy season from April to November and a dry season from December to March. The mean annual rainfall is 2450 mm [3]. August and September are the most rainy months of the year. The temperature amplitude (month average) is very low, varying from 24 to 29 °C, and the mean annual temperature is 25,4 °C.
The park is divided into two clearly defined topographic areas: the eastern flat part (the study area) and the western hilly part with altitudes up to 375 m. There are many streams and rivers in the park (especially in the low eastern part), most of which dry up during the dry season. Soils of the greater part of the park are loamy, developed on basalt, volcanic tufas, tuff breccias and shales. In flood plains there are areas with sandy alluvial soils [1].
Methods . The field reconnaissance study was conducted in July-September 2011. Based on the Forest Inventory Map of Cat Tien National Park (1999) (Fig. 1) three dominant types of forest communities typical of the study area were identified: (1) primary forest dominated by Lagerstroemia species, (2) secondary, naturally recovering forest and (3) secondary, the most disturbed sparse forest. In these communities 3, 5 and 2 field plots were established, correspondingly.
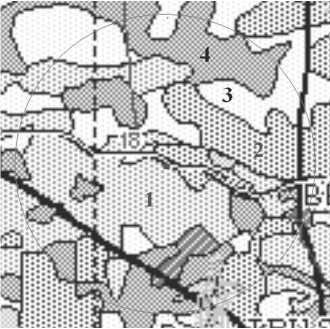
Fig. 1. Segment of forest inventory map of Cat Tien National Park (1999). The map shows the area within two km radius around the eddy covariance tower. 1 – naturally regenerating mixed forests;
2 – mature forests, including Lagerstroemia forests; 3 – sparse forest; 4 – disturbed forest areas
Biomass studies were conducted using a technique based on allometric equations that allows above-ground tree biomass and carbon stock to be estimated on the basis of tree diameter at breast height (DBH) [13]. Test plot locations were selected randomly within the study area. In the study, the nested plot technique was used. Quadrates (size 35 x 35 m for trees greater than 20 cm DBH, 10 x 10 m for trees with a diameter of 5–20 cm DBH and 1,5 x 1,5 m for trees and herbs smaller than 5 cm DBH) were laid at each plot in forests of all types. The biomass of each sample tree was calculated using allometric equation for estimating the above-ground biomass in tropical forests [13]. Litter biomass was measured on five litter plots (size 0,3 x 0,3 m) randomly placed in each plot. The calculation of liana biomass was based on the assumption that the average total aboveground dry weight of lianas is 4,5 % of the estimated above-ground forest according to the method developed for the equatorial forest of Venezuela [14]. Root biomass was determined indirectly by using allometric equations for tropical forests [13].
RESULTS AND DISCUSSION
Forest communities with the upper canopy layer dominated by Lagerstroemia calyculata are rather widespread in the study area. The other species (e. g. Afzelia xylocarpa, Tetrameles nudiflora) rarely occur in the upper canopy layer of such a forest. The upper open canopy is formed by Lagerstroemia trees that reach a height of 30–40 m with no crown below 15 m. The second canopy layer in this community is closed and consists of such dominant species as Acronychia laurifolia , Dalbergia cf. mammosa , Peltophorum dasyrrachis , Markhamia stipulata , Pterocymbium tinctorium , Pterospermum sp. , Roth-mannia eucodon , Xylopia cf. vielana , Polyalthia sp. , Cinnamomum sp. , Phoebe sp. , Diospyros spp. , Kne-ma sp. [2] with a height of about 20 m or a bit higher. The undergrowth of the dominant species, Lager-stroemia calyculata, does not occur under the canopy of this forest type, but it occupies forest openings, roadsides, clearings and glades. The primary Lager-stroemia forest is characterized by the presence of numerous large trees of Lagerstroemia calyculata . Dominant trees are usually old with DBH greater than 70 cm (the largest measured tree had DBH of about 3 m) (Fig. 2, 3). These trees form a considerable part of the biomass in the forest of this type (Apparently, the biomass of Lagerstroemia calyculata is overestimated as a common allometric equation for tropical forests was used in calculations, which does not take into account that old Lagerstroemia trees have large (more than 10 m) hollows). The number of large trees is 55–65 trunks per hectare. The dead and fallen dominant trees result in the appearance of forest openings, where low vegetation develops, in particular, rattan palm ( Calamus spp. ) and numerous liana species. Young trees of Lagerstroemia calycu-lata may also occur there.
Lagerstroemia forest is regarded as a community with relatively stable temporal dynamics of biomass. The biomass of trees greater than 20 cm DBH (mainly dominant species) is 530,6 t ha-1 (74,6 % of the total community biomass); the biomass of trees with a diameter of 5–20 cm DBH is 39,2 t ha-1 (5,5 % of the total community biomass); the biomass of trees smaller than 5 cm DBH is 6,0 t ha-1 (0,8 % of the total community biomass), see table 1.
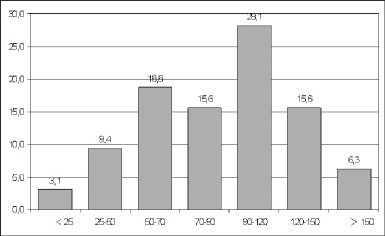
Fig. 2. DBH-class distribution of Lagerstroemia calyculata trees in mature Lagerstroemia forest. On the x-axis – tree diameter (cm), y-axis – number of trees (%). Only trees greater than 5 cm DBH were considered
Some problems related to biomass estimation have arisen during the study of this community. Large La-gerstroemia trees develop constantly increasing hollows that must be taken into account in the biomass studies. Measurements have shown that hollows may account for more than 40–50 % of the tree volume.
|
Table 1 Distribution of biomass (t ha-1) in Lagerstroemia forest |
||||
|
Fraction of biomass |
Plot 1 |
Plot 2 |
Plot 3 |
Average |
|
Trees greater than 20 cm DBH |
631,3 |
510 |
450,6 |
530,6 |
|
Trees with a diameter of 5–20 cm DBH |
53,1 |
21,5 |
42,9 |
39,2 |
|
Litter |
19,1 |
3,1 |
5,2 |
4,2 |
|
Undergrowth |
7,0 |
6,1 |
4,0 |
6,0 |
|
Lianas |
32,0 |
24,3 |
22,7 |
26,3 |
|
Dead wood |
4,5 |
3,3 |
5,1 |
4,3 |
|
Underground biomass |
112,1 |
89,7 |
83,9 |
95,2 |
|
Total |
859,0 |
658,0 |
615,3 |
710,8 |
In the naturally regenerating forest, just like in Lagerstroemia forest , 4–5 tree layers can be distinguished. The upper layer consists of flag trees of numerous species: Lagerstroemia calyculata , Afze-lia xylocarpa , Tetrameles nudiflora , Haldina (syn. Adina) cordifolia , Hopea odorata and others. These trees are generally quite thin, with the average diameter of large trees (greater than 20cm DBH) about 30 cm, unlike in Lagerstroemia forest where this index is greater than 100.
This type of forest is characterized by numerous glades and openings where rapid development of a dense vegetation cover dominated by rattan palm takes place. The glades often appear on the place of large old fallen trees. Newly formed forest openings overgrow with fast-growing, light-loving trees that for some time impede the growth of native species. Larger clearings are probably attributed to soil properties and to timber cutting that took place in the second half of the 20th century.
Naturally regenerating forest community produces considerably less total biomass. However, the share of large trees (with a diameter of more than
20 cm DBH) is also high amounting to 69 % of the total biomass. The share of medium-sized trees (with a diameter of 5–20 cm DBH) is greater than in Lagerstroemia forest, 14,8 % of the total biomass (56,1 t ha-1), see Table 2. The average canopy height there is nearly the same as in the mature forest (~ 30 m), but the average DBH is significantly smaller. Nevertheless, the canopy there is quite close and the incoming solar radiation under the canopy is similar to that in the mature forest. Figure 3 shows the DBH-class distribution of trees in naturally regenerating forest.
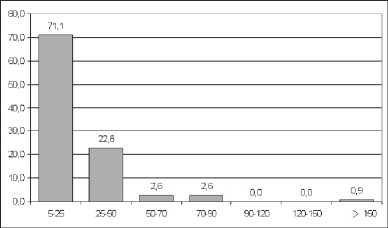
Fig. 3. DBH-class distribution of trees in naturally regenerating forest. On the x-axis – tree diameter (cm), y-axis – number of trees (%). Only trees greater than 5 cm DBH were considered
Table 2
Distribution of biomass (t ha-1) in naturally regenerating forest community
|
Fraction of biomass |
Plot 1 |
Plot 2 |
Plot 3 |
Plot 4 |
Plot 5 |
Average |
|
Trees greater than 20 cm DBH |
143,0 |
304,4 |
198 |
239,3 |
231,2 |
223,2 |
|
Trees with a diameter of 5–20 cm DBH |
135,2 |
74,7 |
106,2 |
101,1 |
56,1 |
94,7 |
|
Litter |
7,8 |
7,4 |
2,0 |
6,1 |
5,2 |
5,6 |
|
Undergrowth |
5,3 |
4,3 |
4,3 |
6,2 |
7,0 |
5,7 |
|
Lianas |
13,1 |
17,6 |
14,1 |
15,5 |
15,7 |
15,1 |
|
Dead wood |
2,5 |
4,3 |
3,5 |
3,2 |
2,9 |
3,3 |
|
Underground biomass |
51,0 |
66,5 |
55,2 |
59,6 |
54,0 |
57,3 |
|
Total |
357,9 |
479,2 |
385,2 |
422,7 |
380,2 |
405,0 |
Sparse forest is the most suppressed community, largely represented by the vegetation typical for exposed sites described above, and underdeveloped forest sites. Large solitary trees are represented by the species mentioned earlier in descriptions of other forest types. They make up only 27 % (47,7 t ha-1) of the total community biomass. Trees with a diameter of 5–20 cm DBH make up 35,1 % (62,0 t ha-1) of the total community biomass. However, the most developed in this community is undergrowth. Its contribution to the total biomass is 6,1 %, while in Lagerstroemia and naturally recovering forests it makes up 0,8 and 1,8 %, respectively (Table 3).
It is quite possible that considerable parts of this forest community were formed as a result of strong degradation in the past, but one of the important reasons refers to the properties of soil structure ( confined to wet, boggy areas). Thus, the development potential of sparse forest cannot be high and is unlikely to contribute significantly to carbon sequestration in the park forests.
Table 3
Distribution of biomass (t ha-1) in sparse forest community
|
Fraction of biomass |
Plot 1 |
Plot 2 |
Plot 3 |
|
Trees greater than 20 cm DBH |
54,9 |
46,3 |
47,7 |
|
Trees with a diameter of 5–20 cm DBH |
93,4 |
59,7 |
62 |
|
Litter |
2,9 |
3,2 |
3,1 |
|
Undergrowth |
9,5 |
12 |
10,8 |
|
Lianas |
7,2 |
5,5 |
6,3 |
|
Dead wood |
2,2 |
2,6 |
2,4 |
|
Underground biomass |
30,4 |
24,5 |
26,9 |
|
Total |
200,5 |
152,8 |
176,6 |
The contribution of litter to the total biomass was 4,2 t ha-1 (0,6 %), 5,6 t ha-1 (1,4 %) and 3,1 t ha-1 (1,8 %) in Lagerstroemia forest, naturally recovering forest community and sparse forest, respectively. It should be taken into account that litter biomass is minimal during the wet season and attains the peak values in the dry season. No significant differences were found in dead wood biomass on different sites as well. It was 4,3 t ha-1 (0,6 % of the total biomass), 3,3 t ha-1 (1 %) and 2,4 t ha-1 (1,4 %) in Lagerstro-emia forest community, naturally regenerating forest and sparse forest, respectively. The average total biomass of naturally regenerating forest has not reached its potential maximum yet, and the increase of biomass will be accompanied by the increase in carbon sequestration.
CONCLUSION
The study demonstrates the differences in plant biomass production between the forest areas in Cat Tien National Park with different levels of anthropogenic disturbance s . The inventory data obtained are important for the forthcoming large-scale eddy covariance flux research for quantifying CO2 exchange. The data on biomass production by different types of forest communities are in general agreement with literature data on similar communities in other tropical countries [14].
The analysis of cartographic material (Fig. 1) showed that the naturally recovering forest is the predominant forest type in the study area, but the other two studied communities also occupy large areas. Such distribution can be considered as typical for the north-eastern flat part of the park only, but not for the whole Cat Tien National Park, where bamboo and other community types largely dominate.
Based on forest inventory data, it was concluded that as the park forests biomass potential is not being realized today, these forests must be depositing carbon on a global scale. The greatest contribution to the sequestration of atmospheric carbon will be made by naturally regenerating forests, as forests of this type occupy the largest area in the park and are supposed to have the greatest potential to sequester carbon .
* Исследования выполнены при финансовой поддержке проекта РФФИ 12-04-31234 мол_а «Эколого-физиологические адаптации растений на нарушенных территориях» и при поддержке Программы стратегического развития (ПСР) ПетрГУ в рамках реализации комплекса мероприятий по развитию научно-исследовательской деятельности на 2012–2016 гг.
References Preliminary forest plant biomass inventory in monsoon tropical forest in Cat Tien national park (South Vietnam)
- Аничкин А. Е. Структура и функциональная роль животного населения почв муссонного тропического леса Вьетнама: Дис.. канд. биол. наук. М., 2008. 199 с.
- Структура и функции почвенного населения тропического муссонного леса (национальный парк Кат Тьен, Южный Вьетнам)/Под общ. ред. А. В. Тиунова. М.: Товарищество научных изданий КМК, 2011. 280 с.
- Blanc L., Maury-Lechon G., Pascal J.-P Structure, floristic composition and natural regeneration in the forests of Cat Tien National Park, Vietnam: an analysis of the successional trends//Journal of Biogeography. 2000. Vol. 27. P. 141-157.
- Boffey P. M. Herbicides in Vietnam//AAAS study finds widespread devastation. 1971. Science. Vol. 171. P 43-47.
- Brown S. Estimating biomass and biomass change oftropical forests: a primer//FAO Forestry Papers 134, 134, 55 pp. Rome, Italy. FAO [Electronic resource]. Access mode: http://www.fao.org/icatalog/search/dett.asp?aries_id=7736
- Brown S., Lugo A. E. Tropical secondary forests//Journal of Tropical Ecology. 1990. Vol. 6. P 1-32.
- Collins N. M., Sayer J. A., Whitmore T. C. Conservation atlas of tropical forests. Asia and the Pacific. London, 1991.
- Durand F. Les forêts en Asie du Sud-Est: recul et exploitation: le cas de l'Indonisie. Paris: L'Harmattan, 1994. 411 p.
- Mai To Dinh. Le Viêt-Nam forestier//Revue Forestière Française. 1983. Vol. 25. P. 227-243.
- Maurand P. L’Indochine forestière//Institut des recherches agronomiques et forestières de l’Indochine. Hanoi: Newbery, M. D., Campbell, E. J. F., Lee, Y. F., Ridsdale. 1943.
- Norman C. Academy reports on Vietnam herbicides damage//Nature. 1974. Vol. 248. P. 186-188.
- Orians G. H., Pfeiffer E. W. Ecological effects of the war in Vietnam//Science. 1970. Vol. 168. P 544-554.
- Pearson T., Brown S., Walker S. Sourcebook for land use, land-use change and forestry projects [Electronic resource]. Access mode: http://www.winrock.org/ecosystems/files/winrock-biocarbon_fund_sourcebook-compressed.pdf
- Putz F. E. Liana biomass and leaf area of a ‘Tierra Firme’ forest in the Rio Negro Basin, Venezuela//Biotropica. 1983. Vol. 15. P. 185-189.
- Rollet B. Note sur la végétation du Vietnam au sud du 17 éme parallèle Nord. Commentaire de la carte au 1/1,000,000. Saigon: Institut de Recherche Agronomique, 1960.
- Rollet B. La végétation du Cambodge (article in three parts)//Bois et Forêts des Tropiques. 1972. 144, 3-15, 145, 23-38, 146, 3-20.
- Schmid M. Végétation du Viet-Nâm. Paris: ORStOm, 1974.
- SRV State Committee for Sciences, U.N.D.P, SIDA, UNEP & IUCN (1991) Vietnam, national plan for environment and sustainable development. 1991-2000. Project VIE/89/021.
- Trung Thai Van Phytogénèse et classification de la végétation forestière au Vietnam//Acta scientiarum Vietnamicarum Section Biology Geography and Geology. 1966. Vol. 1. P. 88-100.
- Tschirley F. H. Defoliation in Vietnam//Science. 1969. Vol. 163. P. 779-786.
- Vandekerkhove K., De Wulf R., Chin N. N. Dendrological composition and forest structure in Nam Bai Cat Tien National Park, Vietnam. Silva Gandavensis. 1993. Vol. 58. P. 41-83.
