Preliminary Study of Step-Count Authentication using Wearable Device

Author: Sirapat Boonkrong, Wata Kanjanapruthipong
Journal: International Journal of Computer Network and Information Security @ijcnis
Article in issue: 3 vol.17, 2025.
Free access
Authentication, an identity verification and confirmation method, is a defense mechanism that reduces the risk of adversarial attacks, specifically to identity theft and impersonation in computer systems. Existing authentication methods exhibit vulnerabilities, such as password dictionary attack, credential stuffing, and identity spoofing. In this study, we examine the possibility of using a class of biometric data, namely step counts, to investigate their potential in person identification and verification. For this purpose, we collected step-count data from research volunteers over a period of 33 days or over 560 hours. Subsequently, we used these data to establish an appropriate threshold and tested their accuracy using a confusion matrix. Our evaluations showed that a suitable threshold range for step-count authentication is x ̅-1S.D.≤Range ≤ x ̅+1S.D., where S.D. represents standard deviation and x ̅ is the mean value of step counts of an individual. Moreover, we constructed a receiver operating characteristic curve and calculated the area under the curve, which showed that step counts have the potential to be used in behavioral biometric authentication methods. Thus, using the threshold range method, step counts can potentially become another behavioral biometric factor for authentication systems.
Access Control, Authentication, Biometrics, Computer Security, Wearable Device
Short address: https://sciup.org/15019796
IDR: 15019796 | DOI: 10.5815/ijcnis.2025.03.01
Text of the scientific article Preliminary Study of Step-Count Authentication using Wearable Device
The Internet and computer systems have become integral parts of our lives. Currently, we can access the Internet from anywhere and anytime, i.e., using a smartphone, a computer, or a wearable device. Although the availability of countless applications and services have made our lives easier, more productive, and enjoyable than ever before, there are security risks that an adversary can exploit, particularly during login or system access processes. Therefore, a mechanism capable of reducing these risks is essential. This mechanism is authentication.
Authentication [1] is a user identification method that is applied to computer systems and requests users attempting to access the system to verify their identity. A common authentication example is the password that users must type after typing their username to inform the system that they are the actual owners of the typed username.
Three well-known and commonly used authentication processes are something-you-know, something-you-have, and something-you-are. The something-you-know process requests users to use what they can remember to verify their identity. The username and password (something the user know) login procedure provides a good example of this type of authentication. The something-you-have process requests users to use an extra device to help them with the login procedure. For example, a user uses a smartphone (something the user has) to receive a set of digits and enter these digits into a computer system. A user can also use a smart card (also something the user has) to scan themselves in a computer system. The something-you-are process requests users to use a part of their body or their behavior, also known as biometric data, to verify their identity. A common example of this process is when a user uses their fingerprint (something the user is) to access his/her smartphone.
Currently, all the aforementioned three types of authentication processes are used; however, these processes exhibit security issues that need to be addressed. The something-you-know process involves risks of password dictionary attacks, brute force attacks, credential stuffing, and password sniffing. Furthermore, the something-you-have process involves a risk of simply losing the device used for authentication. Therefore, the something-you-are process, which is associated with user body parts and behavior, has become popular these days [2, 3].
Biometric authentication has emerged as an important technology for identity verification that uses unique physiological and behavioral characteristics to authenticate individuals. With the increasing number of digital transactions and the necessity for security measures, biometric authentication has become a solution to address the issues associated with the aforementioned authentication methods. Existing biometric authentication systems use various human traits, such as fingerprints, iris, voice, gait, typing pattern, and mouse movement. Advancements have occurred with respect to operability and security in case of the existing biometric authentication systems; however, these systems still suffer from few problems.
Examples of problems associated with different types of biometric data have been reported in [4] and are listed below. When fingers are wet and wrinkles are formed, the accuracy of the process involving the use of fingerprints to identify an individual decreases drastically. Regarding retina-based identification, variations in light intensity can also affect the ability to identify a person. Voice recognition is affected by changes in emotions or an illness. The effectiveness of face recognition, which is another popular form of biometrics, is reduced in the absence of properly controlled lighting. Signature recognition is currently unreliable owing to potential forgeries. Because of the aforementioned problems associated with the so-called traditional biometric data, research efforts have been made toward collecting new types of biometric data, particularly those that can be collected through smart devices [5-7] such as smartphones and smartwatches. Examples of such types of data include heart rate and blood pressure, all of which are still under rigorous investigation and need improvement in terms of their effectiveness for authentication.
Considering the ability of smart devices to perform many functions, including health monitoring [8], there are still other types of biometric data, such as step counts that have not been used for authentication. In this study, we perform a feasibility analysis to investigate whether step counts have the potential to be used as a behavioral biometric authentication method.
Our research approach starts with the collection of step-count data from 11 people, who recorded their number of steps using smart devices over a period of 33 days, which accounted for over 560 hours of data for each person. The data belonging to each person are then divided into two parts; the first is used to find a suitable threshold, and the second is used to test the accuracy of the threshold. To determine the threshold, we initially identify the mean value of step counts (x) of each individual to form a baseline. Using this baseline, we set different ranges, from narrow to wide, and use a confusion matrix to evaluate the accuracy of each range. The results indicate that a range between x + 1S.D. and x — 1S.D., where S.D. represents standard deviation, provides the best accuracy in terms of a high number of true positives (TPs) and true negatives (TNs) and a low number of false positives (FPs) and false negatives (FNs). The equal error rate (EER) is then computed to show the performance and accuracy of the selected threshold range. In addition, a receiver operating characteristic (ROC) curve is constructed, and the area under the ROC curve (AUC) is calculated to demonstrate the potential of step counts to be used as a behavioral biometric authentication method.
The introduction of a novel approach for behavioral biometric authentication marks a significant advancement in the field of identity verification. The proposed authentication system expands the current landscape of biometric authentication by leveraging step counts to establish another type of biometric data for reliable user identification. This new type of behavioral biometric is proposed because traditional biometric authentication systems are primarily physiological and susceptible to spoofing attacks. Conversely, behavioral biometrics offer another dimension of security that is less prone to forgeries. Additionally, the behavioral biometric authentication method proposed in this feasibility study aims to strengthen security measures and mitigate the risks of unauthorized access and adversarial activities. By applying step-count data, our novel approach should be able to provide defense against attacks such as impersonation and identity spoofing. That is, step-count authentication offers a dynamic biometric signature, which makes step counts more resistant to spoofing attacks. Notably, by introducing step-counts as a method for authentication, it will be possible to seamlessly integrate it into individuals’ daily activities without the need for explicit participation from these individuals. This implies that step-count authentication can offer the potential for continuous authentication. Continuous authentication has been a subject of studies over recent years. Jeong et al. [9] and Baig and Eskeland [10] have all studied and analyzed the current state of research in continuous authentication technologies on generic devices (or personal computers), Internet of things (IoT) devices, and smart devices. The biometric modalities mentioned in the aforementioned existing work include keystroke dynamics, motion dynamics, touch dynamics, eye movement, and gaitbased dynamics. Although [8] and [11] have explored the feasibility of various biometric modalities acquired from wearable device, including step counts, their method for finding the accuracy is different from our method proposed in this study. The existing method used by [8] and [11] applies feature selection techniques and classification models to analyze the performance and accuracy of biometric modalities. However, we propose a method that creates different threshold ranges, which are used to determine the performance and accuracy of step counts.
The rest of this paper is organized as follows. The background knowledge and related research work are presented in Section 2. The description of the testing setup and the evaluation of the authentication accuracy using step counts are presented in Section 3. The results are presented in Section 4, and a discussion on these results is presented in Section 5. Finally, the conclusion is presented in Section 6.
2. Background and Related Research Work
This section describes the theory and principles related to authentication. Moreover, biometric authentication, which is the focus of this study, is emphasized. Furthermore, existing research efforts on finding appropriate thresholds for biometric authentication and the evaluation of accuracy of these thresholds are described.
-
2.1. Biometric Authentication
Authentication is a part of a larger process known as access control [1,12] that comprises four subprocesses: identification, authentication, authorization, and accounting. Identification involves users attempting to identify themselves in a system. Authentication refers to confirming that a user is really the owner of the identity specified in the identification step. In other words, it involves users confirming that they are really themselves. Authorization refers to the rights and restrictions of users in a system. Accounting refers to recording the activities of each entity within the system. Our study focuses on biometric authentication, which is the process of confirming users’ identity based on their biometric data.
Biometrics literally means “to measure life.” and practically means verification of a person’s identity using measurable human biological data [1]. Biometrics can be divided into two categories, physiological biometrics and behavioral biometrics. The former refers to the physiological characteristics of a person and is related to the shape of body parts. Fingerprint, face, palm print, retina, and iris are included in this category. The latter refers to behavioral patterns or actions of a person. Voice, handwritten signature, typing pattern, and walking pattern are included in this category.
In more detail, behavioral biometrics [13, 14] refer to the analysis of unique human characteristics and patterns derived from actions or activities, as opposed to physical traits. In other words, these biometrics focus on the way individuals perform certain tasks or behaviors, rather than their inherent physical attributes. Additionally, behavioral biometrics focus on the way individuals perform specific tasks, capturing patterns that can evolve over time. Common examples include keystroke dynamics (or typing patterns), gait analysis, and voice patterns. This approach offers several advantages, including continuous authentication and a reduced risk of spoofing. In this study, we explore step-count data as a form of behavioral biometric, attempting to leverage the unique patterns of physical activity exhibited by individuals to establish a novel method of authentication through wearable devices. By investigating this type of biometric authentication, we aim to enhance the understanding and utility of behavioral biometrics in the context of secure identity verification.
Biometric data have some properties [15] that make them suitable for authentication. The first property of universality indicates that biometric data should be available to the general human population. The second property of uniqueness indicates that biometric data should be able to differentiate one person from another. The third property of collectability indicates that biometric data should be easy to obtain, extract, and evaluate. The fourth property of permanency indicates that biometric data should last for a long time, thus reducing the frequency of data collection. The final property of acceptability indicates that biometric data should not cause any discomfort to biometric users.
A biometric authentication process can be divided into two stages. The first is the enrolment stage, while the second is the authentication stage. During the enrolment stage, a person’s biometric data, such as a fingerprint or a walking pattern, are captured and processed to extract unique features to ensure that different people can be distinguished from one another. These features are then used to form a biometric template for a particular person.
During the authentication stage, a person’s biometric data is captured and processed in a way similar to that in the enrolment stage and their unique features are extracted. The extracted features are then compared with the existing biometric template, which is stored in the biometric database. If the captured and extracted data match those stored in the template, the person’s identity is successfully verified. Otherwise, the verification fails, and the person is refused entry into the system. A typical biometric authentication process is depicted in Fig. 1.
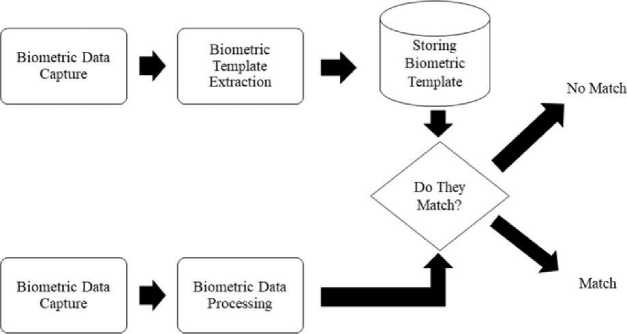
Fig.1. A typical biometric authentication process
The performance of a biometric authentication system is usually evaluated using a confusion matrix [16, 17], which comprises four metrics. These are TP, TN, FP, and FN. TP refers to a legitimate person being successfully verified using the biometric template. TN refers to an illegitimate person being successfully detected and denied access to the system. FP refers to a legitimate person being authenticated as illegitimate. FN refers to an illegitimate person being authenticated as legitimate by the biometric authentication system. The number of FNs is also known as the false acceptance rate (FAR), which indicates the percentage of unauthorized persons being accepted by the authentication system. The number of FPs is known as the false rejection rate (FRR), which indicates the percentage of authorized persons being rejected by the biometric authentication system [18, 19]. In addition, the percentage of authorized persons correctly identified as legitimate is known as the genuine acceptance rate, while the percentage of unauthorized persons correctly denied access is known as the genuine rejection rate.
Biometric authentication is rapidly evolving, driven by advancements in technology and increasing security needs across various sectors. Current trends indicate a significant shift towards multi-modal biometric systems, which integrate multiple biometric modalities, such as fingerprints, facial recognition, and voice patterns, to enhance accuracy and security. This approach not only improves the reliability of identity verification but also mitigates the risks associated with relying on a single biometric trait. Moreover, behavioral biometrics, which analyze user behavior patterns like typing speed and walking gait, are gaining interest. Today, these systems usually apply machine learning algorithms to detect anomalies in user behavior [20], thereby providing an additional layer of security against fraud and identity theft [21].
Recent technological innovations have further escalated the capabilities of biometric systems [22]. For example, three-dimensional (3D) face recognition technology utilizes structured lighting to create detailed facial maps, making it resistant to spoofing attempts using photographs or masks. This technology captures precise geometric data, allowing for identification even under varying lighting conditions and angles. Similarly, finger-vein recognition has emerged as a secure contactless method that is difficult to forge, addressing privacy concerns associated with traditional fingerprint systems. The integration of sensor interoperability is also notable [23, 24], enabling different biometric devices to work seamlessly together, which enhances the flexibility and scalability of biometric solutions in various applications, from banking to healthcare. The integration of biometric sensors in wearable devices has significantly inspired our research on step-count authentication. This advancement in technology not only highlights the potential for utilizing various biometric modalities but also emphasizes the importance of exploring innovative authentication methods that are in line with everyday activities, such as step counting. Consequently, our study aims to investigate the viability of step-count data as a behavioral biometric authentication method, contributing to the enhancement of security through wearable technology.
2.2. Biometric Threshold
3. Materials and Methods3.1. Data Collection
The data collection for our feasibility study on step-count authentication was conducted using a smartwatch, specifically designed to accurately record step counts. After obtaining verbal informed consent from each participant, a total of 11 individuals were recruited for the study. Each participant was provided with a GOGO G1 Pro CPU MTK6261A smartwatch configured to automatically log their daily step counts.
In Fig. 1, a match does not necessarily require the authenticated biometric data to be an exact match with the biometric template data because of the considerable difficulty or near impossibility of achieving an exact match between the biometric data being authenticated and the biometric template data [25]. Many factors, such as lighting in case of facial authentication, pen pressure in case of handwritten signature, and the pace and time of the day in case of walking, are attributable to the difficulty of achieving an exact match. Therefore, establishing a level of similarity between the authenticated and template data to determine whether an individual is accepted or rejected by the authentication system is imperative. This level is known as a threshold or a baseline value, which is an important factor in biometric authentication. In other words, when the level of similarity between the authenticated and template data is equal to or greater than the specified threshold, the person will be accepted by the system. Otherwise, the person will be rejected. Accordingly, the threshold value in an authentication system was defined in [26] as a prespecified score, which was used to distinguish real from fake users.
However, finding a suitable threshold value for biometric authentication has been proven to be difficult. If we set a low threshold or baseline value, legitimate individuals will easily pass the authentication process. However, many FNs may be obtained, i.e., illegitimate individuals will be able to pass the authentication process because of the low level of biometric data matching. Alternatively, if we set a high threshold value, legitimate individuals will experience inconvenience. In other words, a high baseline value indicates that the amount of biometric data to be matched with the template data is also high, making it difficult even for legitimate users to reach that value, resulting in many FPs. However, this makes it also difficult for illegitimate users to be authenticated, resulting in a low FN rate.
Although finding an appropriate threshold in biometric authentication systems is difficult, some research has been conducted on this topic. In 2014, Malik et al. [27] investigated a palm print authentication system and found that using an ∼78.3% threshold value, the value of FAR was 8.06% and the value of FRR was 8.81%, while the percentage of authenticated biometric data that needed to be matched with the existing biometric template data was 78.3%. Nimnual [28] designed a biometric authentication system using blood vessels in the arms. The author showed that using a 70% threshold value, the value of FAR was 1.11% and the value of FRR was 0%. In 2019, Wangkeeree and Boonkrong [29] found that an appropriate threshold value for an iris-based authentication system was ∼72%. Using this value, the TP rate was 77.50%. However, Cockell and Halak [30], whose research focused on keyboard typing patterns, found a considerably lower threshold value of ∼58% with a 10% FN rate for their biometric authentication system.
The following two observations can be made based on existing studies. First, no attempts have been made to study the possibility of step-count authentication and find a threshold. Second, the basic method used to find a biometric threshold is to evaluate the threshold value in terms of the matching biometric data percentage. Consequently, in this study, we perform a feasibility analysis of step-count biometric authentication and introduce another method to find a threshold value suitable for this type of authentication.
The objectives of this study are to examine whether step counts can potentially be used in biometric authentication and to find an appropriate threshold value for this type of authentication. In this section, we describe the study procedure, starting from the data collection process and proceeding to the threshold evaluation process.
Participants were instructed to wear the smartwatch consistently throughout the day, with specific emphasis on maintaining it during the active hours of 06:00 to 23:00. This time frame was selected to capture a representative sample of daily activities while excluding hours typically associated with sleep, thus ensuring that the data collected reflected periods of physical activity. To ensure adherence to the data collection protocol, participants received guidelines on how to wear the device properly and were encouraged to report any issues encountered during the study.
Data collection occurred over a 30-day period, during which participants were monitored for compliance with the wearing schedule. This data collection period was chosen to cover a full monthly cycle and to capture as many potential walking patterns as possible. This time frame also allowed for the inclusion of both weekday and weekend activities, which might differ significantly in terms of step-count and activity types. Moreover, we believe that a month-long period could provide sufficient data to estimate an individual’s mean step count and variability, which would be critical for establishing a baseline or threshold range for authentication. To ensure data quality, participants were asked to log any days when the smartwatch was not worn for which there were none during the data collection period. At the end of the data collection period, the recorded step counts were extracted and aggregated from the smartwatch, and several threshold ranges were established for analysis. We would like to further explain that the step-count data was collected over a 30-day period in a controlled environment, with participants instructed to wear the smartwatch consistently during the specified hours. As this study was conducted as a feasibility study, the controlled environment would allow us to establish suitable threshold ranges for step-count authentication and to assess the viability of this approach.
The chosen sample size of 11 participants for threshold range establishment was based on prior studies in the field of statistical analysis on pilot studies [31, 32], which indicated that this number would provide sufficient variability in step-count patterns while allowing for manageable data analysis. Additionally, this sample size facilitates the exploration of individual differences in step-count behavior, which is crucial for developing an effective authentication protocol. In more detail, the 11 participants in this study whose data were used for the establishment of threshold ranges included 7 females and 4 males aged between 18 and 25. These study volunteers were recruited from the population of students and first jobbers in Nakhon Ratchasima, Thailand. The reason for focusing on the population within this age group was because the young adult population are usually frequent users of wearable technology. Therefore, asking them to participate in our preliminary study of step-count authentication would not be considered intrusive.
Table 1 shows the step-count data collected by a participant between 06:00 and 23:00 over a period of 30 days.
Table 1. Example of Step-Count Data Collected Over a 30-Day Period
|
Day/Time |
1 |
2 |
3 |
... |
28 |
29 |
30 |
|
06:00 |
0 |
0 |
0 |
... |
0 |
0 |
0 |
|
07:00 |
224 |
198 |
230 |
... |
165 |
168 |
220 |
|
... |
... |
... |
... |
... |
... |
... |
... |
|
13:00 |
1233 |
1168 |
1290 |
... |
1103 |
1185 |
1254 |
|
14:00 |
1102 |
665 |
887 |
... |
824 |
1021 |
711 |
|
... |
... |
... |
... |
... |
... |
... |
... |
|
21:00 |
101 |
324 |
355 |
... |
136 |
115 |
108 |
|
22:00 |
0 |
119 |
104 |
... |
178 |
328 |
108 |
|
23:00 |
0 |
0 |
34 |
... |
42 |
0 |
0 |
Once the data were collected, several sets of threshold ranges were set. Subsequently, the obtained threshold values were compared to determine the value that provided the highest accuracy for step-count authentication. Notably, “highest accuracy” indicates high TP and TN values and low FP and FN values.
To control potential confounding variables that could influence the accuracy of step-count authentication, we identified several key factors, including age, fitness level, and daily activity patterns. Participants were randomly chosen to ensure a diverse representation across these variables. Additionally, we standardized the instructions provided to participants regarding the use of the smartwatch, emphasizing the importance of consistent wear during the specified data collection hours. To evaluate the performance of the step-count authentication model while accounting for these confounding variables, we employed Receiver Operating Characteristic (ROC) analysis and computed the Area Under the Curve (AUC). This approach allowed us to assess the model’s accuracy and distinguish between true positive and false positive rates. Hence, the validity of our findings would be improved.
-
3.2. Step-count Threshold Sets of Ranges
In this study, we propose a method for finding a suitable threshold, which is unlike the methods proposed by other existing studies. In our method, we initially calculated the mean value (x) and S.D. of each data collection period from 06:00, 07:00, and 08:00 until 23:00. These values were then used to calculate the threshold.
In this study, we first created an initial set of threshold ranges, which comprised six step-count threshold values. These threshold ranges are the actual mean values x of the step counts of each person at a given time, and the following rages:
x < Range < X+1S.D.(1)
x < Range < x + 1S.D.(2)
x + 1S.D.< Range < x + 2S.D.(3)
x — 2S.D.< Range < x — 1S.D.(4)
The final ranges in this initial set of threshold ranges included anything beyond x ± 2S. D. In the Equations 1 to 4, nS.D. means n * S.D. The reason for setting these ranges was the high degree of difficulty to exactly match an authenticated step count with the mean value (or the step-count template value). The plausibility for an authenticated step count to fall into one of these ranges or areas increases by setting these ranges. An example of the initial set of step-count threshold ranges is depicted in Fig. 2.

Fig.2. An example of initial set of step-count threshold ranges
This figure shows the mean value (x) of step counts of an individual. It also shows different ranges and areas into which an authenticated step count could fall. In our initial step-count threshold ranges, we set the ranges so that they were one standard deviation above and below one another, i.e., the borders of ranges or step-count threshold areas were one-standard-deviation wide.
In the previous section, we explained that each participant collected their step-count data over a period of 30 days. This means that using this method, each participant determines their own step-count threshold ranges.
Once the initial step-count threshold ranges had been set for each individual, they were tested and evaluated for their ability to identify authorized and unauthorized individuals. After obtaining the results, a secondary set of step-count threshold ranges was established to check whether it could yield better or a worse accuracy.
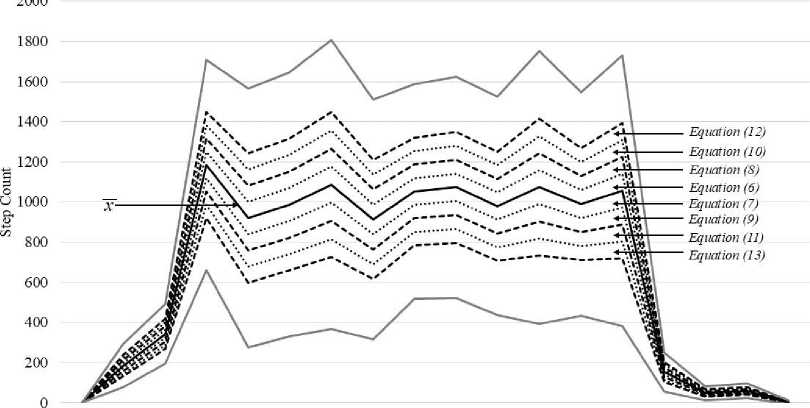
In the secondary set of step-count threshold ranges, instead of having ranges one-standard-deviation wide, we narrowed the threshold areas, i.e., we divided the initial threshold areas into smaller areas that were only 0.25-standard- deviation wide. The secondary set of threshold ranges that was used to evaluate the accuracy of step-count authentication could, for example, include the following ranges:
Range = x(5)
x < Range < x+ 0.25S.D.(6)
x — 0.25S.D.< Range < x(7)
x+ 0.25S.D.< Range < x + 0.50S.D.(8)
x —0.50S.D.< Range < x — 0.25S.D.(9)
x + 0.50S.D.< Range < x + 0.75S.D.(10)
x — 0.75S.D.< Range < x — 0.50S.D.(11)
x+ 0.75S.D.< Range < x + 1S.D.(12)
x — 1S.D.< Range < x — 0.75S.D.(13)
The secondary step count threshold areas were similar to those in Fig. 2 but narrower. This is illustrated in Fig. 3. Again, notably, each participant has their own threshold ranges because the ranges are dependent on the number of step counts of each individual. These ranges were then evaluated for their ability to detect legitimate and illegitimate individuals.
6:00 7:00 8:00 9:00 10:00 11:00 12:00 13:00 14:00 15:00 16:00 17:00 18:00 19:00 20:00 21:00 22:00 23:00
Time
Fig 3. An example of secondary set of step-count threshold ranges
Next, to make our study more complete, we established a tertiary set of widened step-count threshold ranges to enlarge the step-count threshold areas so that each threshold range could cover areas both above and below the mean value of the step counts of an individual. The step-count threshold ranges used in this tertiary set included the followings:
Range = x(14)
x — 0.25S.D.< Range < x + 0.25S.D.(15)
x — 0.50S.D.< Range < x + 0.50S.D.(16)
x —0.75S.D.< Range < x + 0.75S.D.(17)
x — 1S.D.< Range < x + 1S.D.(18)
x — 2S.D.< Range < x + 2S.D.
The threshold ranges for an individual represented in Equation 14 to Equation 19 are shown in Fig. 4.
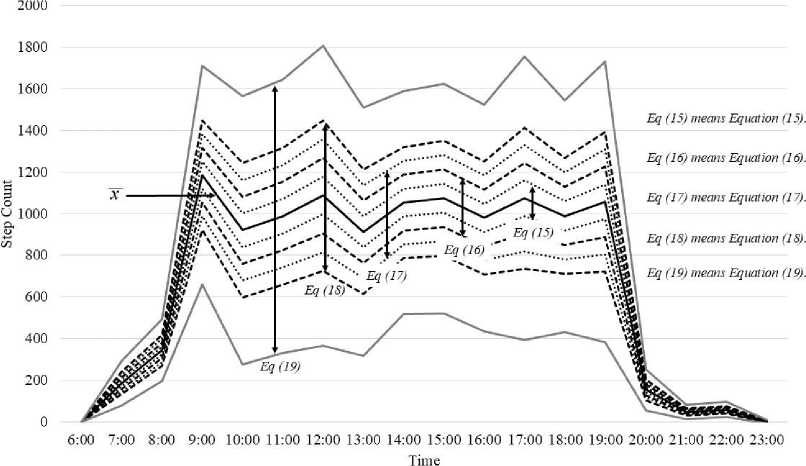
Fig 4. An example of tertiary set step-count threshold ranges
Next, we examine the implications of setting narrow and wide threshold ranges. If we set a narrow threshold range, the probability of an illegitimate individual being detected will be increased. However, it will be difficult for a legitimate individual to be successfully authenticated. Alternatively, if we set a wide threshold range, the probability of a legitimate individual being successfully authenticated will be increased. However, it will be easy for an illegitimate individual to be successfully authenticated. In other words, it will be difficult to detect an illegitimate individual.
The next step for finding a suitable step-count threshold value was to extend the step-count data collection period of each individual by 3 days. These step-count data were then compared with established threshold ranges to determine the range that produces the most accurate authentication threshold. Starting with the initial set of threshold ranges, once a more accurate range was found, it was divided into smaller ranges to check whether a small range could provide increased accuracy for step-count authentication. For example, if the range from X to X + 1S.D. had been found to provide increased accuracy, it was then divided into narrower ranges, as stated in the example of the secondary set of threshold ranges. Once the new and narrower threshold ranges had been specified, another accuracy test was performed. In addition, a tertiary set of widened step-count threshold ranges was used and evaluated for its ability to detect legitimate and illegitimate individuals. Evaluations and tests were performed for all three sets of step-count threshold ranges to determine and establish a suitable and accurate step-count threshold range for the step-count authentication of each individual.
3.3. Step-count Threshold Evaluation
4. Results4.1. Initial Set of Threshold Ranges
Based on the threshold ranges set in the previous section, we employed a confusion matrix as the main evaluation metric.
To determine the threshold for biometric authentication, we used the step-count data of all 11 participants. Notably, apart from the 30-day step-count data that were used to specify the threshold ranges, all participants collected their stepcount-data for 3 additional days during the threshold evaluation phase. During each additional day, each person collected their data 18 times a day (hourly; between 06:00 and 23:00), thus providing 54 additional data values for testing.
Because the confusion matrix comprises four evaluation metrics (TP, TN, FP, and FN), we performed our threshold evaluation as follows. Initially, we used the step-count data of each person and tested them against the person’s own threshold ranges to obtain the TP and FP values. Thus, each person, had 54 values of step-count data tested against their own threshold ranges. Next, we used the step-count data of ten other participants and tested them against one another’s data. Thus, 540 step-count values were tested to obtain the TN and FN values. Overall, 594 step-count data values were used to test the accuracy of the threshold ranges of each individual.
Our evaluation method could be better explained by based on the following example. To evaluate the accuracy of threshold ranges of participant A1, participant A1’s own step-count data were tested for TP and FP values. Furthermore, the data of 10 other participants, namely, participant A2 to participant A11, were compared with participant A1’s threshold ranges for TN and FN values.
To determine the most suitable step-count threshold range for authentication, we selected the range that produced the highest TP and lowest FN values.
This section presents the results obtained based on the Materials and Methods Section. A confusion matrix was employed. Initially, we present the results obtained from the initial set of threshold ranges. Next, we present the matrix values obtained from the secondary set of threshold ranges, followed by the results obtained from the tertiary set of threshold ranges. Our objective is to determine the threshold range that yielded the most accurate step-count authentication results.
The first set of threshold ranges comprises six separate step-count threshold values that were evaluated for accuracy using the confusion matrix. These are the actual mean values (x) of the step counts of each person, the ranges shown in Equations 1 to 4, and the ranges beyond x ± 2S. D. Again, we tested the step-count data of all 11 participants against their own data and other individuals’ data to obtain all the confusion matrix metrics, i.e., TP, TN, FP, and FN.
Table 2 shows the evaluation results in the form of actual data values and in the form of percentages that fall into each confusion matrix category. It also shows that the step-count threshold ranges from x to x + 1S. D. produced the highest TP and lowest FP values of 62.29% and 37.71%, respectively, compared with all other threshold ranges. This indicates that this particular range has the highest ability to identify a legitimate individual using the step-count approach. The TN and FN values obtained using this range were 78.42% and 21.58%, respectively. Table 2 also shows that the FN values were significantly higher than those obtained using other threshold ranges, except for the ranges from x — 1S. D. to x — 2S. D. and beyond x ± 2S. D. Other threshold ranges produced low TP values between 1.85% and 13.80%, and FP values between 86.20% and 98.15%.
Table 2. Confusion matrix of initial step count threshold ranges
|
Threshold Range |
TP |
FP |
TN |
FN |
|
Range= x |
64 10.77% |
530 89.23% |
5753 96.85% |
187 3.15% |
|
x < Range < x + 1S.D. |
370 62.29% |
224 37.71% |
4658 78.42% |
1282 21.58% |
|
x — 1S.D.< Range < x |
82 13.80% |
512 86.20% |
5480 92.26% |
460 7.74% |
|
x + 1S.D.< Range < x + 2S.D. |
63 10.61% |
531 89.39% |
5657 95.24% |
283 4.76% |
|
x — 2S.D.< Range < x — 1S.D. |
11 1.85% |
583 98.15% |
4156 69.97% |
1784 30.03% |
|
Beyond x + 2S.D. |
12 2.02% |
582 97.98% |
4026 67.78% |
1914 32.22% |
As shown in Table 2, three threshold ranges produced the highest TN values; thus, they exhibit the highest possibility of correctly identifying illegitimate individuals. These ranges are the mean value (x), the range from x to x — 1S.D., and the range from x + 1S.D. to x + 2S.D., which resulted in TN values of 96.85%, 92.26%, and 95.24%, respectively. Moreover, these ranges produced the lowest FN values. In particular, x produced an FN value of 3.15%, the range from x to x — 1S.D. produced an FN value of 7.74%, and the range from x + 1S. D. to x + 2S. D. produced an FN value of 4.76%. Although a low FN value is desirable in the context of security because it indicates that few illegitimate individuals can be successfully authenticated, these three threshold ranges provided considerably low TP and considerably high FP rates. This would cause inconvenience to legitimate individuals because they would be prevented from being successfully authenticated.
We selected the range from x to x + 1S. D. because it produced the highest TP and the lowest FP values. Moreover, we selected the range from x to x — 1S.D. because it produced a low FN value and thus had the ability to identify illegitimate individuals. These two ranges were further studied by being divided into smaller threshold ranges to examine whether the confusion matrix would provide different values.
-
4.2. Secondary Set of Threshold Ranges
-
4.3. Tertiary Set of Threshold Ranges
In the secondary set of threshold ranges, we used the results obtained from the evaluation of the initial set of threshold ranges. In this section, we evaluate the confusion matrix of nine subranges obtained from Equations 5 to 13. Table 3 shows the evaluation results for all threshold ranges in the form of actual data values and in the form of percentages that fall into each confusion matrix category.
By narrowing the step-count threshold ranges, two noteworthy observations can be made. The first is that the ability to detect legitimate individuals is drastically decreased compared with that achieved using the best threshold range (i.e., from x to x + 1S. D. whose TP value was 62.29%. However, by narrowing the threshold range, the highest TP value obtained was only 10.61% with an average TP value of 7.65%, which is significantly lower than the value obtained using the initial set of threshold ranges. Additionally, a considerably low TP value means that the corresponding FP value becomes considerably high. Using small threshold ranges, the average FP value obtained was 92.35%. In other words, if we apply narrow threshold ranges to a step-count authentication system, it will be substantially difficult for the system to successfully detect legitimate individuals; hence, the considerably low TP and considerably high FP rates were obtained.
Table 3. Confusion matrix of secondary step count threshold ranges
|
Threshold Range |
TP |
FP |
TN |
FN |
|
Range = x |
49 8.25% |
545 91.75% |
5746 96.73% |
194 3.27% |
|
x < Range < x + 0.25S.D. |
48 8.08% |
546 91.92% |
5917 99.61% |
23 0.39% |
|
x — 0.25S. D.< Range < x |
48 8.08% |
546 91.92% |
5716 96.23% |
224 3.77% |
|
x + 0.25S.D.< Range < x + 0.50S.D. |
32 5.39% |
562 94.61% |
5779 97.29% |
161 2.71% |
|
x — 0.50S.D.< Range < x — 0.25S.D. |
61 10.27% |
533 89.73% |
5671 95.47% |
269 4.53% |
|
x + 0.50S.D.< Range < x + 0.75S.D. |
45 7.58% |
549 92.42% |
5785 97.39% |
155 2.61% |
|
x — 0.75S.D.< Range < x — 0.50S.D. |
61 10.27% |
533 89.73% |
5643 95.00% |
297 5.00% |
|
x + 0.75S.D.< Range < x + 1S.D. |
2 0.34% |
592 99.66% |
5923 99.71% |
17 0.29% |
|
x — 1S.D.< Range < x — 0.75S.D. |
63 10.61% |
531 89.39% |
5642 94.98% |
298 5.02% |
The second and somewhat opposite observation is about the TN and FN values. Table 3 shows that by narrowing the threshold ranges, the average TN value was increased from 83.42% (corresponding to the initial set of threshold ranges) to 96.94%. This means that by narrowing the threshold ranges, the ability of the authentication system to successfully detect illegitimate individuals is improved. Moreover, the average FN value of the narrow threshold ranges was decreased from 16.58% (corresponding to the initial set of threshold ranges) to 3.06%. This indicates that, on average, the number of wrongly authenticated illegitimate individuals is reduced by narrowing the threshold ranges. The results clearly show that by narrowing the threshold ranges, the ability to successfully detect illegitimate individuals is increased, as shown by the high TN rate. Additionally, the number of falsely authenticated illegitimate individuals is decreased, as demonstrated by the low FN rate.
Although using narrow threshold ranges increases the security of the authentication system due to the high TN and low FN values, these narrow threshold ranges create a critical problem for legitimate individuals owing to the low TP and high FP values. Therefore, we performed an additional evaluation using different threshold ranges in an attempt to obtain a more balanced result.
In this evaluation, we widened the threshold ranges to examine whether the FP values could be reduced, compared with those obtained using the secondary set of threshold ranges. The threshold ranges used were specified in Equations 14 to 19. We did not widen the widest range (from x — 2S. D. to x + 2S. D.) because the results in Table 2 show that anything beyond the x — 1S. D. and x + 1S. D. boundary did not really produce desirable high TP values and low FP values.
A method similar to that used in the previous evaluation was used here. The step-count data of each individual, comprising 594 data values belonging to 11 participants, were evaluated against their own threshold ranges for TP and FP values, while the data of 10 other individuals, comprising 5940 data values, were tested against all others for TP and FN values. Table 4 shows the evaluation results for all threshold ranges in the form of actual data values and in the form of percentages that fall into each confusion matrix.
Table 4. Confusion matrix of tertiary step count threshold ranges
|
Threshold Range |
TP |
FP |
TN |
FN |
|
Range= x |
49 8.25% |
545 91.75% |
5748 96.77% |
192 3.23% |
|
x — 0.25S.D.< Range < x + 0.25S.D. |
96 16.16% |
498 83.84% |
5417 91.20% |
523 8.80% |
|
x — 0.50S.D.< Range < x + 0.50S.D. |
172 28.96% |
422 71.04% |
4974 83.74% |
966 16.26% |
|
x — 0.75S.D.< Range < x + 0.75S.D. |
299 50.34% |
295 49.66% |
4533 76.31% |
1407 23.69% |
|
x — 1S.D.< Range < x + 1S.D. |
397 66.84% |
197 33.16% |
4748 79.93% |
1192 20.07% |
|
x — 2S.D.< Range < x + 2S.D. |
521 87.71% |
73 12.29% |
3563 59.98% |
2377 40.02% |
By extending the step-count threshold boundaries to both above and below the mean value, several observations can be made. First, the narrowest threshold range produced the lowest TP values and the highest FP values among all ranges. This means that when the threshold area is small, the difficulty for a legitimate person to successfully authenticate themselves is increased. Conversely, the narrowest threshold range produced the highest TN and the lowest FN values among all ranges. This means that when the threshold range is small, it becomes easier to detect an illegitimate individual; hence, the number of illegitimate individuals that can successfully authenticate themselves is reduced.
In particular, the threshold area of the range x — 15. D. < Range < x + 15. D. produced a TP value of 66.84% and an FN value of20.07%. Moreover, the threshold area, which is the largest in the range x — 25. D. < Range < x + 25. D. produced the highest TP value of 87.71%. However, the major problem with this large threshold area was that it produced an FN value of 40.02%, indicating that almost half of the illegitimate users can be successfully authenticated by the stepcount authentication system. The relatively high FP rate of approximately 33% in the x — 15. D. < Range < x + 15. D. threshold range might create a concern. While this threshold suggested that legitimate users would be incorrectly rejected approximately one-third of the time, the particular threshold range held an advantage over other threshold ranges. That is, its FN rate is relatively lower, which means that fewer illegitimate users would be accepted. Saying that, we think several factors may contribute to this high FP rate for the x — 15. D. < Range < x + 15. D. threshold range, including variability in users’ daily activity levels and the limitations of the step-count sensor itself, which can introduce inaccuracies. Therefore, one suggestion is that in the future different devices, which could provide different levels of accuray, could be explored.
To gain deeper insights into the performance of our step-count authentication method across different threshold ranges, we applied Principal Component Analysis (PCA) to the confusion matrix results (TP, FP, TN, and FN rates) for all threshold ranges tested in Table 2 to Table 4. The reason for choosing to apply PCA was so that our study would be consistent with other biometric authentication studies such as those presented in [33, 34]. This analysis revealed that two principal components account for the entire variance in the data. The first variance was PC1, which explained 71.54%. This variance contrasted TP and FP rates, reflecting the method’s ability to correctly authenticate individuals while minimizing missed authentications. The second variance was PC2, which explained 28.46% of variance in the data. This variance contrasted TN and FN rates, indicating the method’s ability to reject illegitimate individuals while minimizing false authentications. The PCA scores are provided in Table 5.
Table 5. PCAScores for each threshold range
|
Threshold Range |
PC1 Score |
PC2 Score |
|
Range= x |
-0.6120 |
0.1175 |
|
x < Range < x + 15.D. |
0.7955 |
0.6973 |
|
x — 15. D.< Range < x |
-0.5235 |
0.1973 |
|
x + 15. D.< Range < x + 25.D. |
-0.5792 |
0.1435 |
|
x — 25. D.< Range < x — 15.D. |
-0.7361 |
0.3241 |
|
Beyond x ± 25. D. |
-0.7433 |
0.3571 |
|
x < Range < x+ 0.255. D. |
-0.6733 |
-0.1501 |
|
x — 0.255. D.< Range < x |
-0.6162 |
0.0986 |
|
x + 0.255. D. < Range < x +0.505. D. |
-0.6655 |
0.0380 |
|
x — 0.505.D.< Range < x —0.255. D. |
-0.5724 |
0.1673 |
|
x + 0.505.D.< Range < x +0.755. D. |
-0.6329 |
0.0703 |
|
x — 0.755. D.< Range < x —0.505. D. |
-0.5709 |
0.1617 |
|
x + 0.755.D.< Range < x + 15.D. |
-0.7352 |
-0.2159 |
|
x — 15. D.< Range < x —0.755. D. |
-0.5572 |
0.1714 |
|
x — 0.255. D.< Range < x + 0.255. D. |
-0.3000 |
0.3973 |
|
x — 0.505. D.< Range < x +0.505. D. |
0.0375 |
0.5910 |
|
x — 0.755. D.< Range < x +0.755.D. |
0.8249 |
0.3654 |
|
x — 15. D.< Range < x + 15.D. |
1.8037 |
-0.0285 |
|
x — 25. D.< Range < x + 25.D. |
2.9715 |
-0.7660 |
Table 5 presents the PCA scores for each of the threshold ranges tested in our step-count authentication study. From the table, the threshold range x — 25.D.< Range < x + 25. D. exhibits the highest PC1 scores (2.9715) with the threshold range x — 15.D.< Range < x + 15. D. having the second highest PC1 scores (1.8037), indicating more superior performance in maximizing true positives than other threshold ranges. The high PC1 score suggests that these particular threshold ranges offer a good balance between user authentication and security against unauthorized individuals. However, as seen in Table 4, the FN value of the threshold range x — 25. D. < Range < x + 25. D. is approximately twice higher than that of the threshold range x — 15. D. < Range < x + 15. D. By considering both the experimental results and PCA, it can be confirmed that the threshold range x — 15. D. < Range < x + 15. D. performs better than the other threshold ranges tested in this study. On the whole, by calculating the PCA scores of the threshold ranges, we found that step-count data has potential as a behavioral biometric for authentication. Moreover, they emphasize the importance of carefully selecting authentication threshold ranges based on the specific requirements of the application, balancing the need for security with user convenience.
5. Discussion
A method for evaluating the performance of a biometric authentication system, including a step-count authentication system, is to evaluate its accuracy. In the context of step-count authentication, we evaluated the accuracy using a confusion matrix. Based on this matrix, we evaluated the ability of the system to match the authenticated biometric data of an individual with the step-count template data. We also evaluated the ability of the system to avoid wrongly matching other types of data of an individual with the template data.
Although evaluating the four metrics of the confusion matrix, namely TP, TN, FP, and FN, provided some knowledge of the accuracy of the step-count authentication system, the system performance was still inadequate. Thus, we extended our analysis by employing an ROC curve, which is used to evaluate the performance of a classifier [35]. This curve is frequently used in medical [36] and machine-learning [37] fields to evaluate the ability of a model to distinguish different values from one another. Similarly, in our step count authentication system, an ROC graph was used to demonstrate the ability of the system to separate legitimate from illegitimate individuals using different threshold ranges.
After plotting the ROC curve, it is necessary to compute the AUC, which evaluates the entire area under the ROC curve [38, 39]. In other words, the ability of a system to distinguish legitimate from illegitimate individuals can be evaluated using the ROC curve. However, the AUC, whose value varies between 0 and 1, is a metric that is commonly used metric for comparing the performances of different classifiers. In general, an AUC value of 0.5 indicates that the ability of the authentication system to classify legitimate and illegitimate individuals is as good as a random guess [36]. When the AUC value increases, the ability of the system to distinguish between legitimate and illegitimate individuals also increases. Generally, an AUC value between 0.7 and 0.8 is considered acceptable, an AUC value between 0.8 and 0.9 is considered excellent, and an AUC value of greater than 0.9 is considered outstanding. An AUC value of 1.0 means that the system can perfectly distinguish legitimate from illegitimate individuals.
In this study, we employed three different sets of step-count threshold values, namely, initial, secondary, and tertiary sets of threshold ranges. Subsequently, we plotted three ROC curves for each set. Next, we calculated the AUC value for each ROC curve. The obtained ROC curves and AUC values are shown in Fig. 5.
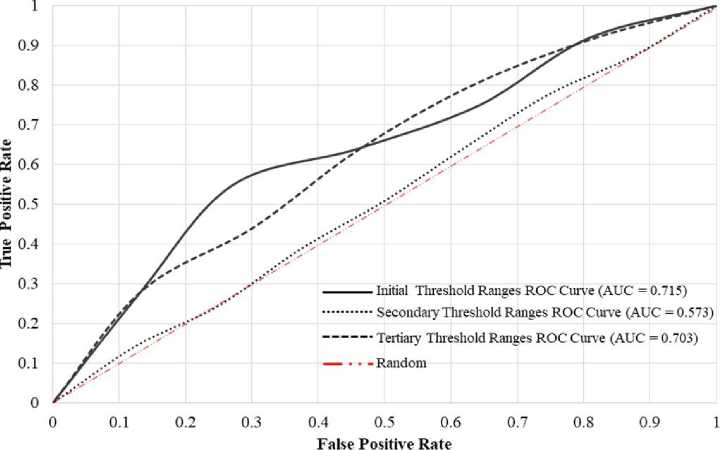
Fig.5. The receiver operating characteristic curves for the three sets of threshold ranges
Fig. 5 shows that the initial, secondary, and tertiary sets of threshold ranges provided AUC values of 0.715, 0.573, and 0.703, respectively. These results imply that the secondary set of threshold ranges, which included the narrowest ranges in our analysis, is not suitable for distinguishing legitimate from illegitimate individuals. This is because the AUC value of this set was slightly more than 0.50. In other words, the distinguishability of this set of threshold ranges is only slightly better than the random selection between legitimate and illegitimate individuals.
Next, we examined the initial and tertiary sets of threshold ranges. For these two sets, we obtained similar AUC values of 0.715 and 0.703, respectively, although with the initial set providing a slightly better value. Therefore, according to [36], these two sets of threshold ranges exhibit acceptable ability in differentiating legitimate from illegitimate individuals.
In addition to the abovementioned analysis, another performance metric that can measure the accuracy of biometric authentication is the equal error rate (EER). The EER is a commonly accepted overall performance and accuracy measure of biometric authentication systems [35, 37]. The lower the EER value, the higher the accuracy of biometric authentication systems. The EER value is determined by the point at which the FRR and FAR values are equal. In our study, to determine the EER value, we selected the data from the tertiary threshold ranges because it contained the range that exhibited the highest accuracy, namely the range x — 15. D. < Range < x + 1S. D. We then plotted a graph showing intersection of the FRR and FAR lines to determine the EER. Fig. 6 shows that the obtained EER value is approximately 27%, which corresponds to an EER of 0.27.
To make the analysis more complete, we also evaluated the performance by calculating the accuracy which is defined as:
accuracy =
TP+TN
TP+FP+TN+FN
Using this evaluation method, it was found that the threshold range x — 1S. D. < Range < x + 1S. D. exhibited the highest value of accuracy at 78.74%. The accuracy rate obtained by using our threshold range method is higher than that of [8] which obtained the accuracy rate of lower than 60% using feature selection techniques and classification models for distinguishing legitimate users from illegitimate ones.
To provide a more comprehensive evaluation of the chosen threshold range for step-count authentication, we calculated precision, recall, and F1-score based on the confusion matrix value of the x — 1S. D. < Range < x + 1S. D. threshold range, using Equations 21, 22, and 23, respectively.
precision =
TP
TP+FP
recall =
TP
TP+FN
л 2*(precision*recall)
1 — score = ------------- precision+recall
Using the above equations, we obtained the precision value of 66.8%, the recall value of 25.0%, and the F1-score of 36.4%. From these values, we can interpret the implications as follows. The relatively high precision and low recall suggests that the chosen threshold range is leaning towards identifying legitimate users. It implies that the chosen threshold range is less likely to accept illegitimate users. This is desirable in a high-security situation, but it comes with an inconvenience for legitimate users. The F1-score of 36.4% reflects this imbalance.
Although [36] suggests that an AUC value above 0.70 is considered acceptable, we still believe that it is necessary to compare our obtained AUC and EER values with other biometric AUC and EER baseline values to assess the feasibility of the step-count authentication. Table 6 provides AUC and EER baseline values [40-42] for some behavioral biometrics. Notably, only behavioral biometric authentication methods were selected for comparison because our step-count biometric method is also a behavioral biometric authentication method. The biometric authentication methods used for comparison include touch screen behavior (touch), typing pattern or keystroke dynamics (keystroke), mouse movement (mouse), walking pattern (gait), and voice.
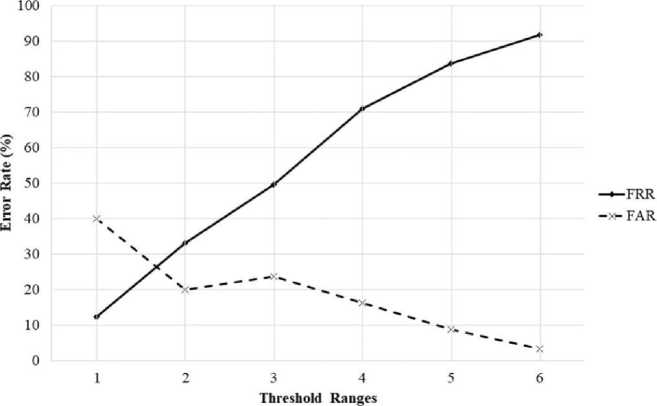
Fig.6. The equal error rate of the selected set of threshold ranges
Table 6 shows that existing and well-studied biometric authentication methods employ support vector machines (SVMs), K-nearest neighbors (KNNs), and deep learning (DL) techniques to improve the classifying ability to differentiate legitimate from illegitimate individuals. Conversely, our step-count authentication method applies only a modest threshold technique to distinguish legitimate from illegitimate users.
In addition, Table 6 summarizes the performance of various behavioral biometric authenticaiton methods, including touch, keystroke dynamics, mouse movement, gait analysis, voice recognition, and gaze analysis, together with our stepcount authentication. Studies have shown that gaze analysis achieved an AUC of approximately between 0.98 and 0.99 with an EER of around 10% and 13% when employing techniques such as SVM, KNN, and deep learning [42]. In contrast, mouse movement and touch analysis reported an AUC of between 0.72 and 0.86 with an EER of between 23% and 34%, even when applying SVM, KNN, and deep learning [40]. This highlighted their susceptibility. Our findings for step-count authentication indicated an AUC of between 0.70 and 0.72 with an EER of 27% when using a simpler threshold range method, demonstrating a competitive and comparable performance while having an advantage of passive data collection. Unlike methods requiring active user engagement, such as touch and keystroke dynamics, step-count authentication offers a non-intrusive approach that can operate seamlessly in the background.
Our results and discussion show that in the evaluation of step-count authentication using a confusion matrix, the ROC and the AUC provide lower values than those obtained from other types of behavioral biometrics. Although the EER value of the proposed step-count authentication is higher than the established keystroke dynamics, voice, and gaze, it is lower than that of the screen touching behavior and mouse movement.
Table 6. AUC baseline values for behavioral biometric authentication
|
Biometrics |
AUC Value |
Technique |
|
Touch [40] |
AUC: between 0.76 and 0.86 EER: between 0.23 and 0.29 |
SVM, KNN, DL |
|
Keystroke [40] |
AUC: between 0.93 and 0.97 EER: between 0.06 and 0.10 |
SVM, KNN, DL |
|
Mouse [40] |
AUC: between 0.72 and 0.77 EER: between 0.29 and 0.34 |
SVM, KNN, DL |
|
Gait [40, 41] |
AUC: between 0.88 and 0.98 EER: between 0.11 and 0.15 |
SVM, KNN, DL |
|
Voice [40] |
AUC: between 0.90 and 0.97 EER: between 0.03 and 0.08 |
SVM, KNN, DL |
|
Gaze [42] |
AUC: between 0.98 and 0.99 EER: between 0.11 and 0.13 |
SVM, KNN, DL |
|
Step Count |
AUC: between 0.70 and 0.72 EER: approximately 0.27 |
Threshold Ranges |
The aforementioned result can be explained by the technique used for identifying legitimate individuals. Consequently, we can admittedly claim that although the accuracy based on the confusion matrix and the classifying ability based on the AUC value are not as high and the EER value is not as low as those in other existing methods, the proposed step-count authentication method provides promising results and can be used as the starting point for further investigation and for applying more advanced techniques to improve its accuracy.
Further, compared to other biometric methods (Table 6), step-count data offers several advantages. First, step-count data is ubiquitous and readily available on most wearable devices and even smartphones. This makes it highly accessible for authentication purposes. Step-count data can be collected passively without requiring active user participation, which enhances user experience and minimizes intrusiveness. Finally, from the accuracy obtained from our study, individual step-count patterns illustrate sufficient uniqueness for authentication purposes.
The reliability of the proposed step-count authentication is next to be discussed. This study aims to investigate feasibility of using the number of steps during a specified interval for identity verification. For this type of authentication to be effective and reliable, one may argue that it requires a person to have regular step counts daily. Conversely, those with irregular walking routine will end up with fluctuating number of steps. This can be compared with other biometric modalities such as mouse movement and keystroke dynamics where regular routines are not necessary. The issue of reliability in this research has been addressed by collecting step count data over a period of time (33 days) to cover potential walking patterns of individuals over one whole month so that the mean number of steps for each interval can be determined. Thus, step counts should be able to capture an individual’s physical movement patterns, providing a new biometric modality. Saying that, we acknowledge that the chosen period of step-count data collection may not capture long-term variations in an individual’s activity patterns, such as seasonal changes, lifestyle changes, or even periods of illness. We think that future research should build upon our preliminary study to investigate the long-term stability of step-count authentication.
The threshold calculation method, involving the mean values and standard deviations, was chosen for its simplicity and ease of implementation as a basic approach in this preliminary study. We acknowledge that this method may not be the most robust for all users. Specifically, the mean and standard deviation are sensitive to outliers, and may not accurately reflect variations in step-count patterns. For example, those with highly variable daily activity levels may have larger standard deviations for certain periods of time, leading to wider threshold ranges. Nevertheless, we believe that our initial findings using the mean and standard deviation method still offer promising insights into the potential use of step-count data for biometric authentication.
Although the dependence on regular walking routines may appear as a disadvantage of the proposed authentication system, step-count authentication potentially has one major advantage over other existing behavioral biometric technologies, i.e., step-count can offer seamless and non-invasive authentication experience to users. This is particularly true when step counts are integrated into wearable devices, which would require minimal effort on the user’s part to interact with an authentication system. This is practically continuous authentication. Step-counts has the potential to enable continuous authentication which would allow for seamless identity verification throughout user’s activities. This is in contrast with traditional authentication methods which require discrete authentication events from the user. Continuous authentication, therefore, provides a more user-friendly experience by eliminating authentication prompts or devices.
To further explain the significance of our study, we explored the implications of our work more deeply, which can be described as follows. The findings of our study potentially have significant implications for the field of behavioral biometric authentication. By demonstrating the feasibility of step-count data as a reliable authentication method, our research contributes to the growing body of evidence supporting the use of behavioral biometrics in enhancing security measures [43]. This approach not only offers a novel alternative to traditional authentication methods but also aligns with the increasing integration of wearable technology in everyday life [8]. Furthermore, our results suggest that step-count authentication could be particularly beneficial in environments where continuous authentication is essential [9, 10], such as healthcare settings for patient identification or in fitness applications for user verification.
The use of behavioral biometrics for continuous authentication has been highlighted as a promising approach to improve security without compromising user experience [9, 10]. Our study builds upon this concept by exploring stepcount data as a unique behavioral modality that can be passively collected through wearable devices. This aligns with the notion that behavioral biometrics should work silently in the background, monitoring the distinct patterns or behaviors that users perform during their interactions with digital systems. When comparing our study to existing research, such as the work by [44], which examined the accuracy of various activity trackers, we find that while both studies focus on stepcount data, our research specifically addresses its application in biometric authentication rather than just activity tracking. Alinia et al. [44] highlighted the variability in step-count accuracy across different devices and contexts. The study indicated that while step-count data can be collected reliably, its application in authentication requires further validation, which has now been complemented by our study.
6. Conclusions
This paper presents a feasibility study on step-count authentication. The objective of this study was to investigate the potential of employing step counts as a behavioral biometric factor of authentication. Initially, 11 people collected step-count data. Subsequently, we tested different threshold ranges for accuracy using a confusion matrix. We found that the x — 15. D. < Range < x + 1S. D. threshold range produced the highest accuracy among the ranges tested with a TP value of 66.84% and an FN value of 20.07%. The results also showed an acceptable user classifying ability for an AUC value of over 0.70 with the EER value of 0.27.
Based on the aforementioned evaluation results, the proposed step-count authentication method does not achieve the accuracy and the AUC value of other existing and thoroughly studied behavioral biometric authentication systems. However, our method appears to be promising for step-count authentication, it also offers unique advantages in terms of passive data collection and user convenience. Given the increasing prevalence of wearable technology, our results indicate that step-count authentication could be effectively integrated into various applications, including healthcare and fitness, where continuous monitoring is essential. In addition, it is possible to consider applying new techniques that are similar to those of other existing behavioral biometric authentication systems for investigating whether an improved level of accuracy and user classifying ability can be achieved. Overall, we believe that our research contributes valuable insights into the potential of behavioral biometrics, specifically step-count authentication, paving the way for innovative authentication solutions in the digital age.
Although our research contributes to the field of behavioral biometric authentication, it is important to acknowledge several limitations. First, the small size of the step-count dataset used in this study may limit the generalization of our findings to diverse operational environments. A larger and more diverse sample would provide a more comprehensive assessment of the step-count authentication method’s performance and its applicability across different demographics and activity levels.
Second, the study was conducted in a controlled setting, with participants following specific instructions regarding the use of the smartwatch. Real-world scenarios may involve more variability in device usage, which could impact the reliability of the authentication system. Future research should explore the performance of step-count authentication in more naturalistic settings to better understand its practical implications.
To address the limitations of this study and further advance the field of behavioral biometric authentication using step-count data, several future research directions can be explored. Firstly, conducting a larger-scale study with a more diverse participant group, including individuals from different age groups, fitness levels, and cultural backgrounds, would enhance the generalizability of the findings. Secondly, investigating the long-term application of step-count authentication patterns over an extended period would provide valuable insights into the reliability of this method for continuous authentication. Additionally, another area for future research is the application of machine learning on the biometric dataset that will allow the evaluation to be directly comparable with the existing methods on which machine learning has already been applied. Moreover, while our study primarily focused on the technical aspects of step-count authentication, it is important to consider the user experience implications of real-world implementation and deployment, too. For example, if a step-count authentication system were implemented, a user could be notified when they were rejected by the system so that corrective actions could be performed. Finally, exploring the potential of step-count authentication as a component of multi-factor authentication systems, in combination with physiological biometrics or other authentication factors, could further improve the overall security and usability of the authentication process.
