Preparing Mammograms for Classification Task: Processing and Analysis of Mammograms

Автор: Aderonke A. Kayode, Babajide S.Afolabi, Bolanle O. Ibitoye
Журнал: International Journal of Information Engineering and Electronic Business(IJIEEB) @ijieeb
Статья в выпуске: 3 vol.8, 2016 года.
Бесплатный доступ
Breast cancer is the most common cancer found in women in the world. Mammography has become indispensable for early detection of breast cancer. Radiologists interpret patients' mammograms by looking for some significant visual features for decision making. These features could have different interpretations based on expert's opinion and experience. Therefore, to solve the problem of different interpretations among experts, the use of computer in facilitating the processing and analysis of mammograms has become necessary. This study enhanced and segmented suspicious areas on mammograms obtained from Radiology Department, Obafemi Awolowo University Teaching Hospital, Ile-Ife, Nigeria. Also, Features were extracted from the segmented region of interests in order to prepare them for classification task. The result of implementation of enhancement algorithm used on mammograms shows all the subtle and obscure regions thereby making suspicious regions well visible which in turn helps in isolating the regions for extraction of textural features from them. Also, the result of the feature extraction shows pattern that will enable a classifier to classify these mammograms to one of normal, benign and malignant classes.
Mammograms, Classification, Abnormalities, Enhancement, Segmentation, Feature extraction
Короткий адрес: https://sciup.org/15013423
IDR: 15013423
Текст научной статьи Preparing Mammograms for Classification Task: Processing and Analysis of Mammograms
Published Online May 2016 in MECS
Breast cancer remains a leading cause of deaths resulting from cancer among women in many parts of the world [1]. Early detection of breast cancer increases the treatment options and also increases the likelihood of cure.
Diagnosis and treatment of breast cancer are made possible by the use of images of the breast obtained through several imaging modalities. These imaging modalities are Mammography, Magnetic Resonance Imaging (MRI), ultrasound scan (USS), Positron Emission Tomography (PET) and Electrical Impedance Tomography (EIT).
Ref. [3] ascertained that mammography is considered the "gold standard" for early detection of breast cancer among these modalities. Mammography uses a low-dose x-ray system to examine breasts [2]. A mammography exam is called a mammogram or mammographic image.
Interpretation of mammograms is a cognitive task. The Radiologist’s experience plays a meaningful role in the diagnosis. Several studies ([4], [5], [6], [7], [8], [9], [10] and [11]) have reported that significant variability exists in the interpretation of the same mammogram when done independently by different Radiologists. Also, it has been gathered that despite the proven value of mammography in screening for breast cancer, its efficacy depends on Radiologists' interpretations. Ref. [10] ascertained that the cause of variability in the interpretations of mammograms by Radiologists is not well understood.
However, digital mammography allows the separation of image acquisition, processing, analysis and classification. It may therefore represent a solution to many of the inherent limitations of screen-film mammography. Through image processing, small differences in attenuation between normal and abnormal mammograms can be amplified and region of interest can be isolated rendering digital mammography most suitable for screening of dense breast.
With the increasing size and number of mammograms, implementation of computer algorithms for the enhancement, isolation and delineation of anatomical structures and other regions of interest are a key component in assisting and automating specific radiological tasks.
Digital image processing and analysis include the use of computer to convert an image into digital form and perform some operations on it in order to get an enhanced image or to extract some useful information from. It is a type of signal dispensation in which input is image and output may be image or characteristics (measurements) associated with the image which can be used for further tasks like classification.
Image processing and analysis allow a wider range of algorithms to be applied to input data and can avoid problems such as the building up of noise and signal distortion during processing. Image processing and analysis are among rapidly growing technologies today and they form core research area within biomedical engineering and computer science disciplines [1].
The remainder of this paper is organized as follows: The next section describes practical problems in classification of mammograms. Section III presents the aim and the specific objectives of the study. Section IV surveys the related works on processing and analysis of mammograms, section V describes the methods used in achieving the objectives previously set, while sections VI and VII discuss feature extraction generation of GLCM from an input image respectively. Experimental results and result discussion are presented in Section VIII and section IX respectively. Finally Section X concludes the paper and makes suggestions for future research.
-
II. Aim and Objectives
The aim of this study is to get mammograms ready for classification task by processing and analyzing them.
The specific objectives are to:
-
1. Obtain mammograms and examine the practical problems involved in detecting and differentiating abnormalities in mammography.
-
2. Enhancing the mammograms in (1)
-
3. Segment suspicious areas known as ROIs on the enhanced image in (2)
-
4. Extract Gray Level Co-occurrence Matrix (GLCM) features from segmented ROIs to aid in the classification of mammograms.
-
III. Practical Problems in Classification of Mammograms
Classification of mammographic images remains a complex and cognitive task which requires advanced levels of expertise and knowledge by trained Radiologists.
Investigation carried out through interviews with a participating Radiologist and facts gathered from literature revealed that there are practical problems involved in the classification of mammographic images to one of normal, benign, and malignant classes. These problems include:
-
• Noise: artifacts (unwanted data) introduced during the process of image acquisition which interfere with the relevant ROI. Therefore there is a need for denoising algorithm which can be implemented in MATLAB.
-
• Density: Some female breasts are extremely dense and obscure abnormalities in the breast [12]. This
means that high contrast is required, which can be achieved by implementing different enhancement algorithms in MATLAB.
-
• Low dynamic range: there is no exact border in biomedical images [13]). For this reason it is expedient to segment the whole image into regions of interest (ROIs) by implementing a segmentation algorithm which uses discontinuity and similarity properties of regions
-
• Visual features: Visual features’ interpretation is a function of experts’ opinion and experience, which results in substantial variability in the interpretation of the same image among experts; therefore extraction of features that are relevant to diagnostic problem and not necessarily visually extractable is advisable [14]. This can be done by implementing feature extraction algorithms available in MATLAB.
-
IV. Related Works
Several works have been done on mammogram processing and analysis. This section presents only recent and most related work in this area. Ref. [15] presented a survey of several enhancement techniques used in mammography and the authors concluded that CLAHE works very well for biomedical images such as mammograms.
Ref. [16] worked on computer aided detection of tumours in mammograms. In this paper, mammograms from mini-MIAS were used. Features were extracted from the mammograms through symlet wavelets and weighted histogram. Extracted features are reduced through singular value decomposition (SVD), with reduced feature set being classified by naïve bayes, random forest and neural network algorithms. The result showed that classification accuracy for Neural Network is the best when compare with other two methods.
Ref. [17] proposed an efficient ROI segmentation of digital mammogram images using Otsu’s n thresholding method. In this paper it was concluded that finding an accurate, robust and efficient ROIs help in making the classification task reliable. Also, [18] proposed a fully automatic mass segmentation scheme which includes automatic seed region growing technique. The difference in the mean of the manual markup by an expert and the proposed segmentation obtained is 0.356, the result showed that automatic segmentation is better than manual one.
Ref. [19] proposed a new method for feature extraction model using both human features and histogram. The experimental results are obtained from a data set of 410 images taken from Digital Database for Screening Mammography (DDSM). The result obtained in this paper is better when compared with the results of their previous work in [20], it was found that accuracy is enhanced by 2%.
Ref. [21] presented a review on feature extraction. In this paper several feature extraction methods in pattern classification were reviewed. This review provided a way for new innovative feature extraction method such as hybrid technique to improve the accuracy of pattern classification.
Ref. [1] worked on identification of abnormal masses in digital mammography images. The work addressed the fact that only three texture descriptors namely: contrast, homogeneity and energy are enough in differentiating normal from abnormal mammogram. The values of the features obtained at different orientations were directly used to classified mammograms into abnormal and normal. Contrast, homogeneity and energy obtained at different orientations were argued to be sufficient in differentiating normal from abnormal mammogram.
-
V. Methodology
The mammographic images used in this study were obtained from the Department of Radiology, Obafemi Awolowo University Teaching Hospital (OAUTH), Ile-Ife, Nigeria. The mammograms were acquired from patients treated at the Department of Radiology OAUTH, Ile-Ife, in collaboration with Faculty of Health Sciences, Obafemi Awolowo University, Ile-Ife. Most mammograms in OAUTH Ile-Ife were acquired using screen-film technique.
The films used for the mammograms are single emulsion, 30.48cm by 25.4cm and 25.4cm by 20.32cm, thereby making them easier to scan. So, they were scanned and saved into the computer in order to convert them to digital format for processing and analysis purposes.
The mammograms were scanned using a HP 300 flatbed digital scanner with its resolution held at 1600 dpi. All images were held as 8-bit gray level scale images with 256 different gray levels (0 -255) and physically in portable gray map (pgm) format. The patients’ information (names, x-ray identification, etc.) were blotted out to ensure confidentiality.
Fig. 1 presents samples of mammograms obtained from Radiology Department, OAUTH, Ile-Ife. Mammograms available from OAUTH for this study were limited, only 78 mammograms were available.
The mammograms were enhanced using CLAHE algorithm which performs two-in-one operation of noise reduction and contrast adjustment. CLAHE was originally implemented for biomedical images.
Segmentation (the isolation of ROIs from other detail in the images) was done using Otsu threshold technique, thereafter the segmented ROIs were analysed by extracting textural features from them using multiple GLCMs.
-
VI. Feature Extraction
Feature extraction is a special form of dimensionality reduction. It is the process of transforming the high dimensional input data like mammographic images into the set of relevant features called feature vector. When the input data to an algorithm is too large to be processed and it is suspected to be notoriously redundant then the input data will be transformed into a reduced representation set of features.
Transforming the input data into the set of features is called feature extraction, if a feature extraction algorithm is carefully chosen and implemented, it is expected that relevant information would be extracted from the input data in order to perform the desired task using the reduced representation instead of the full size input.
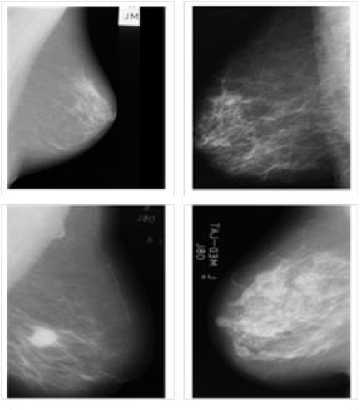
Fig.1. Samples of Mammograms Obtained from Department of Radiology, OAUTH, Ile-life
The extraction task transforms rich content of images into various content features. Feature extraction is the process of generating features to be used in the classification tasks.
Feature extraction simplifies the amount of resources required to describe a large set of data accurately. When performing analysis of complex data one of the major problems stems from the number of variables involved. Analysis with a large number of variables generally requires a large amount of memory and computation power. Feature extraction is a general term for methods of constructing combinations of the variables to get around these problems while still describing the data with sufficient accuracy. Features that can be extracted from mammographic images include: texture, shape, morphological features and so on.
Features are observable patterns in the image which gives some information about the image. Feature is used to denote a piece of information which is relevant for solving the computational task related to a certain application [22].
Textural features remain the best type of feature to be extracted from gray level images such as mammographic images [22], this is because these variables constitute texture which are: difference in gray level values; coarseness (scale of gray level differences); and directionality or regular pattern or lack of it.
In this study thirteen GLCM textural features proposed by Ref. [23] namely: Information measure of correlation 1(IMC1), Contrast, Correlation, Dissimilarity, Energy,
Entropy, Information measure of correlation 2 (IMC2), Difference Variance (DV), Variance, Sum Average (SA), Sum Variance (SV), Difference Entropy (DE), Homogeneity and two other features proposed by Ref. [24], named cluster shade and cluster prominence , which have been reported to have effective influence on classification accuracy were extracted in this study. Therefore, the features vector of each image in the datasets contains fifteen effective GLCM features. The mathematical expression used to compute these features are discussed in both literatures respectively.
-
VII. Generating GLCM from an Image
GLCM is a second order statistical textural feature extraction, method, unlike first order statistics, GLCM takes into consideration the spatial relationship between the pixel of interest and its neighbouring pixels thereby giving us texture features. It is a statistical method that considers the spatial relationship of pixels in the graylevel co-occurrence matrix. Each element (i, j) in the resultant GLCM is simply the sum of the number of times that the pixel with value i occurred in the specified spatial relationship to a pixel with value j in the input image [25].
In order to generate a GLCM, graycomatrix function in the image processing toolbox of MATLAB was used. The graycomatrix function generates a GLCM by calculating how often a pixel with the intensity (gray-level) value i occurs in a specific spatial relationship to a pixel with the value j .
The spatial relationship is defined in terms of distance d and angle 9 , this may be written more formally as P (i, ,j: d, 9).
In MATLAB, by default, the spatial relationship is defined as the pixel of interest and the pixel to its immediate right i.e. nearest horizontal right ( d=1, 9=0° ), though other spatial relationships between the two pixels may be specified. Each element (i, j ) in the resultant GLCM is simply the sum of the number of times that the pixel with value i occurred in the specified spatial relationship to a pixel with value j in the input image.
The number of gray levels in the image determines the size of the GLCM. By default, graycomatrix uses scaling to reduce the number of intensity values in an image to eight, but the NumLevels and the GrayLimits parameters can be used to control this scaling of gray levels.
For example, Fig. 2 shows how graycomatrix calculates the first three values in a GLCM. With 9 = 0 ° and d =1 .
In the output GLCM, element (1,1) contains the value 1 because there is only one instance of a pixel with value 1 having a pixel with 1 immediately to its right, element (1,2) contains the value 2 because there are two instances where a pixel value 1 has a pixel with value 2 immediately to its right.
Another example is the element (7, 1) where there are two occurrences because a pixel with a value of 7 has a pixel valued 1 immediately to its right. graycomatrix continues processing the input image, scanning the image for other pixel pairs (i, j) and recording the sums in the corresponding elements of the GLCM.
The GLCM can reveal certain properties about the spatial distribution of the gray levels in a grayscale image.
|
1 |
1 |
5 |
6 |
8 |
|
2 |
3 |
5 |
7 |
1 |
|
4 |
5 |
7 |
1 |
2 |
|
8 |
5 |
1 |
2 |
5 |
Input image I
|
1 |
2 |
3 |
4 |
5 |
6 |
7 |
8 |
|
|
1 |
1 |
2 |
0 |
0 |
1 |
0 |
0 |
0 |
|
2 |
0 |
0 |
1 |
0 |
1 |
0 |
0 |
0 |
|
3 |
0 |
0 |
0 |
0 |
1 |
0 |
0 |
0 |
|
4 |
0 |
0 |
0 |
0 |
1 |
0 |
0 |
0 |
|
5 |
1 |
0 |
0 |
0 |
0 |
1 |
2 |
0 |
|
6 |
0 |
0 |
0 |
0 |
0 |
0 |
0 |
1 |
|
7 |
2 |
0 |
0 |
0 |
0 |
0 |
0 |
0 |
|
8 |
0 |
0 |
0 |
0 |
1 |
0 |
0 |
0 |
Concurrent Matrix from Image I
Fig.2. Creating GLCM from Input Image
-
VIII. Experimental Result
The image loading, processing and feature extraction models in this study are implemented using MATLAB R2013a with image processing and statistics toolboxes. MATLAB is a technical computing language used mostly for high performance numerical calculations and visualization. It incorporates computing, programming, signal and image processing in an easy to use environment in which problems and solutions can be expressed using mathematical notation [26]. Also MATLAB supports developing applications with Graphical interface features; it includes GUIDE (GUI development environment) for graphically designing GUIs. Its supports for object-oriented programming include classes, inheritance, virtual dispatch, packages, pass-by-value semantics, and pass-by-reference semantics make it easy to build stand alone application [27].
Details of image loading, processing and feature extraction are presented in the following sections.
-
A. Image Loading
Fig. 3 is a snapshot of the loading process; the user finds and selects the particular image he/she wants to load from the folder where the images are stored. The user can process the selected image or load another image if he/she is not satisfied with the image.
The user can click on the “Process Image” button to enhance the image or click on “Load Image” again if he/she is not satisfied with the loaded image and wishes to load another image. This takes the user back to the folder where the images are stored and allow him/her to select another image for processing.
-
B. Mammogram Proccesing
Image processing includes enhancement and segmentation. The underlying principle of enhancement is to enlarge the intensity difference between objects and background and to produce reliable representations of breast tissue structures.
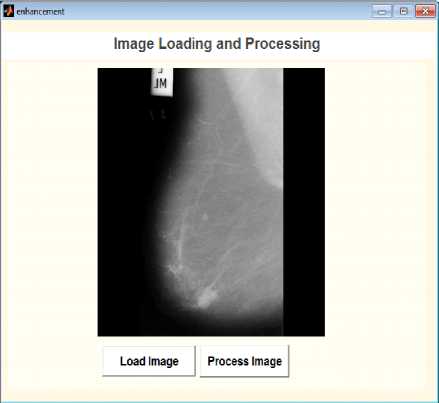
Fig.3. Loading Image for Processing
When visually interpreting a mammogram, a human expert often has to make use of a magnifying glass to obtain a better view of the image to locate and to magnify the suspicious area (ROI) which is a time consuming process. This process is exactly what image preprocessing (enhancement) is modeling. Image enhancement is the process of adjusting digital images so that the results are more suitable for display or further analysis. For example, you can remove noise or brighten an image, making it easier to identify key features.
Fig. 4 shows the result of image enhancement on the loaded mammogram, it can be seen that the suspicious region in the breast is well visible and can now be cropped out in order to isolate it – the process known as segmentation. Features need to be computed only from the suspicious region of the breast profile, excluding all other unimportant parts of the breast tissue. Fig. 5 shows the segmented region from where GLCM features were extracted.
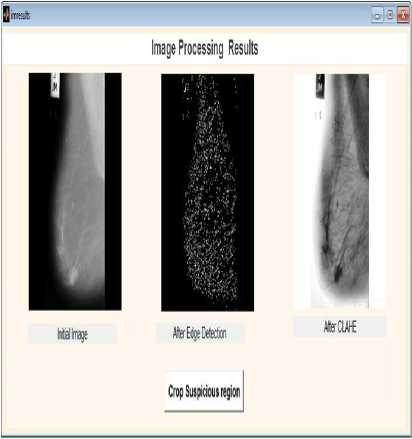
Fig.4. Result of Mammogram Enhancement
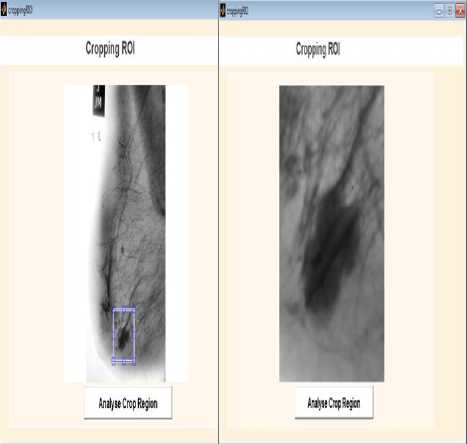
Fig.5. Segmented ROI
-
C. Mammogram Analysis
Image analysis is the process of extracting textural features from an image. These features help in the classification tasks. Several types of features can be extracted from digital mammograms which include: region-based features, shape-based features, texture based features and position based features. Textural features have been proven to be useful in differentiating abnormal from normal breast tissues in digital mammography [22].
The method employed for extracting features plays a very important role in detecting and classifying abnormalities in mammograms. In this paper GLCM features were extracted due to the fact that mammograms are gray scale images. GLCM characterizes the spatial distribution of gray levels in an image [23]. It is a way of extracting second order statistical textural features [28]. Features extracted from GLCMs provide information concerning image texture heterogeneity and coarseness, which is not necessarily visually perceived.
However, in this paper, it was imagined that a single GLCM would not be enough to describe the textural features of the input image. For example, a single horizontal offset might not be precise and accurate for textures with a vertical alignment and the two diagonals, for this reason, multiple GLCMs for a single input image were created.
The fifteen textural features listed section IV, at four different angles θ = 00, 450, 900 and 1350 and at two distances d = 1 and 2 were extracted from the segmented ROI as presented in Fig. 6 and Fig. 7, respectively. It can be seen from these Figures that multiple GLCMs were created for a single input image.
The average of the features at these two distances which was called weighted GLCM was calculated as presented in Fig. 8, while the overall average of each of the features were also calculated for greater accuracy as depicted in Fig. 9.
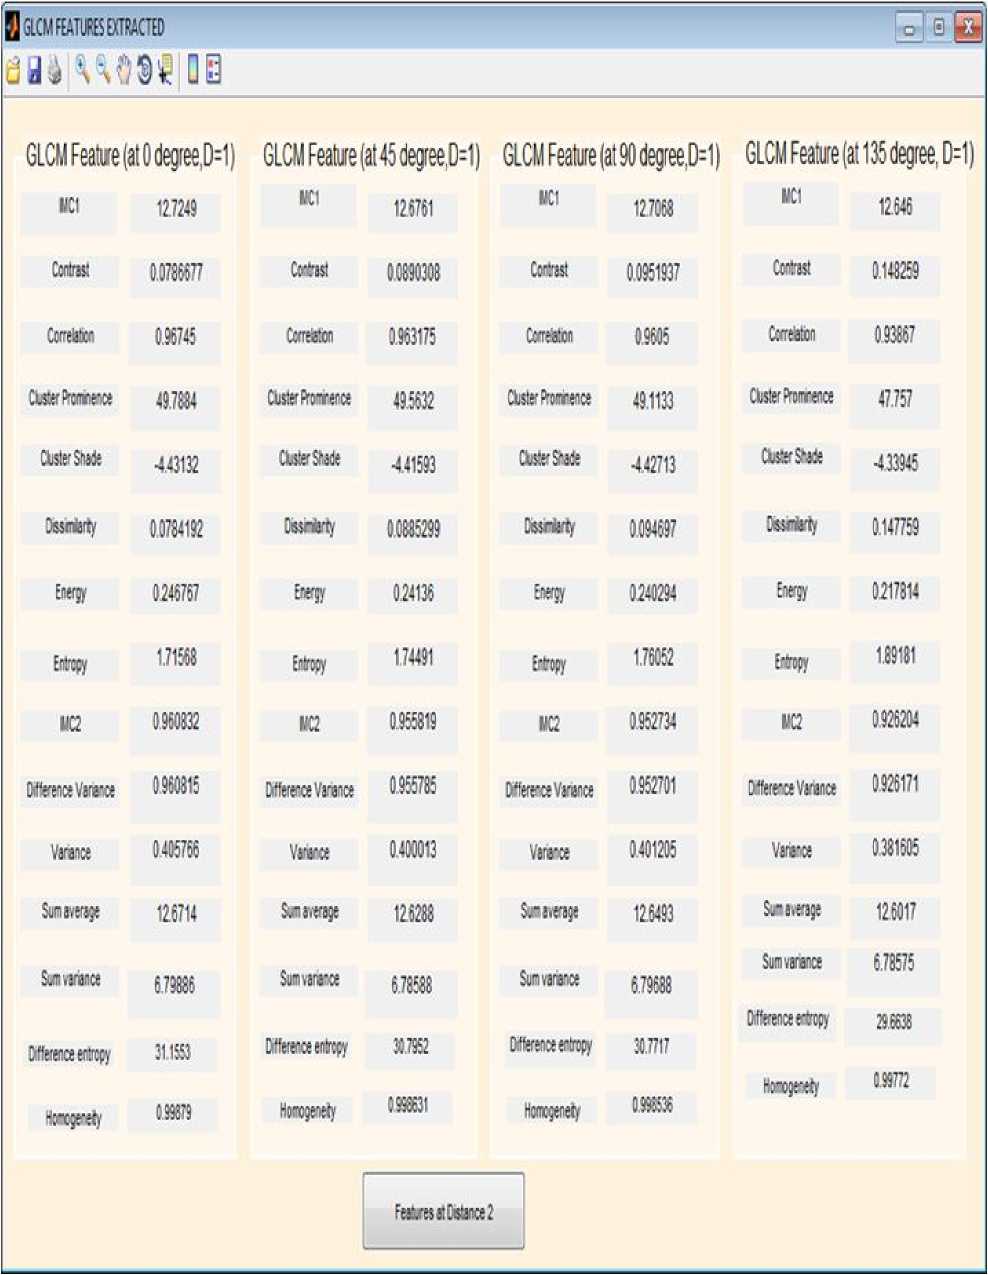
Fig.6. GLCM Features Extracted at Different Angles when Distance = 1
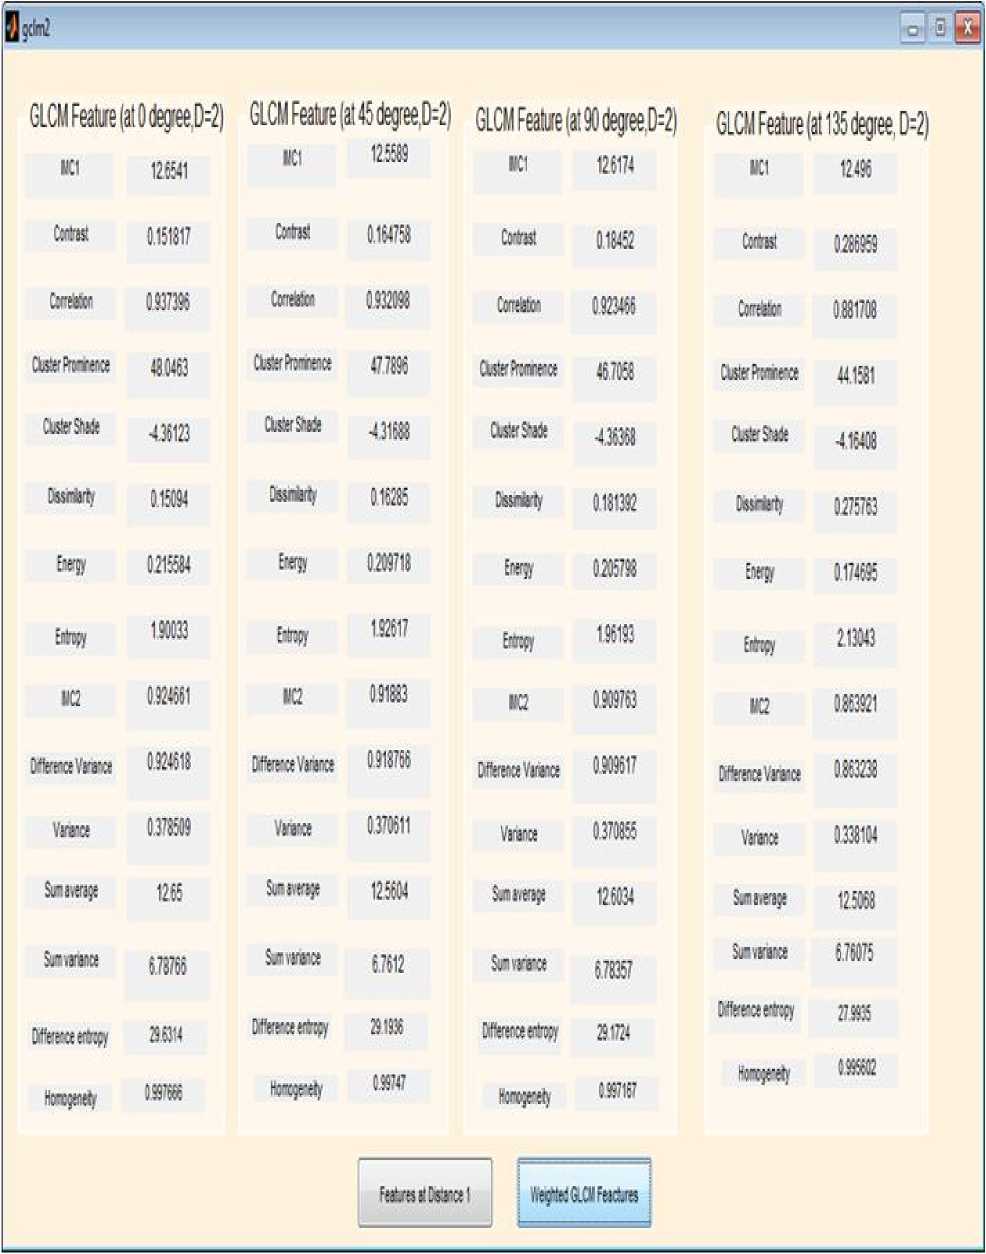
Fig.7. GLCM Features Extracted at Different Angles when Distance = 2
|
QyW |
||||||||
|
GLCMFeature(at0degee.D=2) Ki 126541 |
GLCM Feature (al 45 degree,0=2) IICI 12.5589 |
GLCM Feature (al 90 degree D=2) Ki 12.6174 |
GLCMFealure(al135degiee.D:2) K1 12496 |
|||||
|
Mas |
0.151817 |
■Mas |
0164758 |
Mas |
0.18452 |
Mis |
0286969 |
|
|
Мехе |
0 937395 |
Сут«№ |
0.932098 |
Mater |
0.923466 |
Corrtiatuf. |
0 881708 |
|
|
CMfWeoa |
48 0463 |
Clsiifkrroce |
47 7896 |
СМйжче |
467058 |
CWMf^yrre,a |
44.1581 |
|
|
CM M |
4.36123 |
dister Shade |
431688 |
CMS'to |
4.36368 |
CM Shade |
416408 |
|
|
Dssriarty |
015094 |
DtHiMy |
016285 |
Miterty |
0181392 |
0ea*ty |
0275763 |
|
|
H |
0.215564 |
tw |
0.209718 |
Ewa |
0 205798 |
■wa |
0.174695 |
|
|
EfliTty |
190033 |
EWy |
1.92617 |
Errrrfy |
1.96193 |
Enhp |
213043 |
|
|
K2 |
0.924661 |
wa |
091883 |
K2 |
0 909763 |
K2 |
0.853921 |
|
|
№inaVrr« |
0.924618 |
Dtlfevce Varuna |
0.918766 |
toeraVarra |
0909617 |
Defence Varra |
0 863238 |
|
|
Varra |
0.378509 |
Vrertt |
0.370611 |
Venana |
0 370856 |
Vawce |
0 338104 |
|
|
Sunaierage |
1265 |
Sunr/enge |
125604 |
бяа.егаре |
126034 |
Sjna.erage |
125И |
|
|
$№'.«№ |
678766 |
Sdsvnwoe |
67612 |
StP'wa |
6.78357 |
Sunwa |
6.76075 |
|
|
Orftataertrepy torrefy |
36314 03Ш |
Ditea ersay Mgwty |
31930 0.99747 |
tiMraertropy hw^efy |
291724 0997167 |
Ortseraenr^ ^ofitgrety |
27 9936 С.995Й2 |
|
|
FeaUMSDatral |
i'ieytolGlCyFei&r« |
|||||||
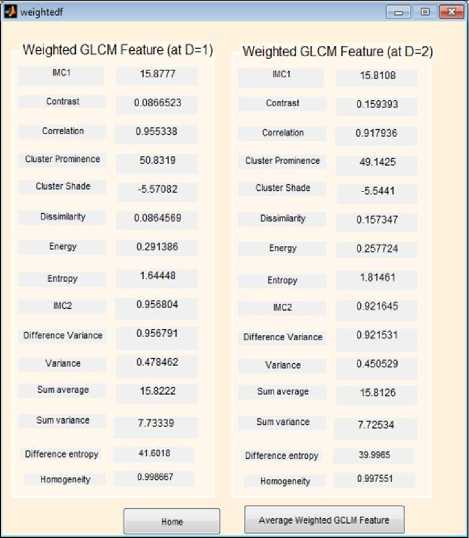
Fig.8. Average GLCM Features at Distances 1 and 2
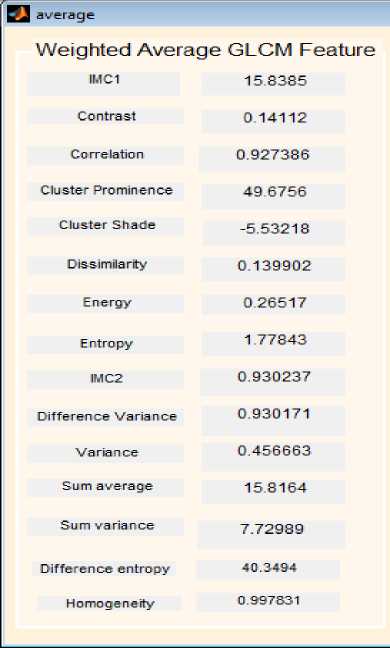
Fig.9. Overall Average of Each of the Features
confidentiality. So they were given research code (oauth001 – oauth078) for identification.
For each of the mammograms, a proforma was appropriately filled by the Consultant Radiologist and this served as the reference or gold standard classification for the mammograms. The Consultant Radiologist final recommendation for each mammogram was entered next to its research code in a Microsoft Excel Sheet version 2007 as shown in Fig. 10, this serve as manual classification.
According to the Radiologist’s interpretation, the mammograms were classified into 37 normal, 23 benign and 18 malignant mammograms.
The overall average computed for each of the fifteen GLCM features (these features were listed in section VI) at four different angles θ = 00, 450, 900 and 1350 and distances 1 and 2 rounded up to two decimal places follow the same pattern for each of the 37 normal mammograms, 18 benign and 23 malignant mammograms.
This means that the features extracted here can be used as input to a classifier that can classify the mammogram into normal, benign, and malignant pattern. Table 1 presents the comparison of four features out of fifteen features extracted for normal, benign and malignant mammograms.
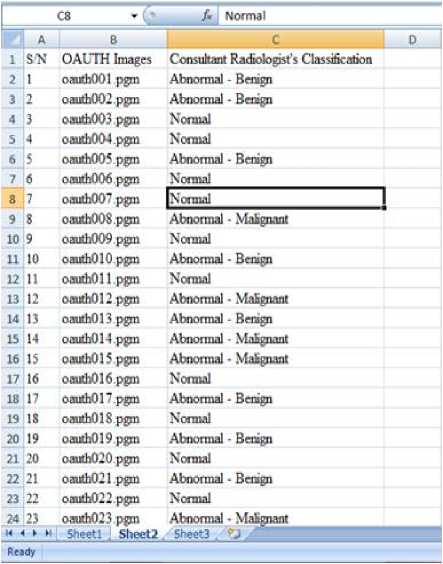
Fig.10. The Consultant Radiologist’s Manual Classification
-
IX. Result Discussion
The available 78 film screen mammograms obtained from OAUTH, Ile-Ife, were digitized, the patients’ names and Hospital numbers cropped out from them to ensure
-
X. Conclusion and Future Research
Processing and analysis of mammograms are very important when preparing them for classification. The enhancement algorithm used on mammograms in this study shows all the subtle and obscure regions thereby making suspicious regions well visible and in turn helps in the isolation of the regions from where features were extracted.
Table 1. Pattern Followed by Extracted Features
|
Extracted Feature |
Normal |
Benign |
Malignant |
|
Contrast |
0.01 – 0.07 |
0.07 – 0.09 |
0.10 – 0.20 |
|
Energy |
0.30 – 0.38 |
0.18 – 0.22 |
0.23 – 0.28 |
|
Correlation |
0.71 – 0.83 |
0.86– 0.91 |
0.91 – 0.98 |
|
Entropy |
1.56 – 1.64 |
1.65 – 1.72 |
1.71 – 2.36 |
The extracted features in this study show similar pattern for each of the normal, benign and malignant images which means that the extracted features can serve as input to a classifier that will classify these images to one of the three classes.
Future research will be towards using the extracted features as input to a classifier that will classify the mammograms to one of the three classes – “Normal”, “Benign” and “Malignant”.
Acknowledgment
The authors wish to thank the Ethics and Research Committee of Obafemi Awolowo University Teaching Hospital, Ile-Ife, Nigeria, for granting our request to make use of patients’ mammograms. We also thank the entire members of staff of Radiology Department of the same hospital for giving us the necessary assistance during the acquisition of the mammograms used in this study.
In addition, we thank the authors whose works are cited and referenced in this paper for providing us with the foundation with which we build our work upon.
Список литературы Preparing Mammograms for Classification Task: Processing and Analysis of Mammograms
- Maitra, I. K., Nag, S. and Bandyopadhyay, S. B. (2011). Identification of abnormal masses in digital mammography images. International Journal of Computer Graphics. 2(1):17-30.
- Choua, S. M., Leeb, T. S., Shaoc, Y. E., and Chenb, I. F. (2004). Mining the breast cancer pattern using artificial neural networks and multivariate adaptive regression splines. Expert Systems with Applications. 27:133–142.
- Andreea, G. I., Pegza, R., Lascu, L., Bondari, S., Zoia Stoica, Z. And Bondari, A. (2011). The Role of Imaging Techniques in Diagnosis of Breast Cancer. Journal of Current Health Sciences, 37(2):241-248.
- Ciccone, G., Vineis, P., Frigerio, A., Segnan, N. (1992). Inter-observer and intraobserver variability of mammographic examination interpretation: a field research. European Journal of Cancer. 28A:1054–1058.
- Elmore, J. G., Wells, C. K., Lee, C. H., Howard, D. H. and Feinstein A. R. (1994). Variability in radiologists' interpretations of mammograms. New England Journal of Medicine. 331:1493–1099.
- Beam, C. A., Layde, P. M., and Sullivan, D. C., (1996). Variability in the interpretation of screening mammograms by US radiologists. Arch Intern Med 156: 209–13.
- Kerlikowske, K., Grady, D., Barclay, J., Frankel, S. D., Ominsky, S. H., Sickles, E. A. and Ernster, V. (1998). Variability and Accuracy in Mammographic Interpretation Using the ACR's BIRADS. Journal of the National Cancer Institute, 90(23), pp 1801-1809.
- Elmore, J. G., Miglioretti, D. L., Reisch, L. M., Barton, M. B., Kreuter, W., Christiansen, C. L., and Fletcher, S. W. (2002). Screening Mammograms by Community Radiologists: Variability in False-Positive Rates. Journal of the National Cancer Institute, 94(18):1373-1380.
- Ooms, E. A., Zonderland, H. M., Eijkemans, M. J., Kriege, M., Delavary, B. M., Burger, C. W. and Ansink. A. C. (2007). Mammography: Interobserver variability in breast density assessment. The Breast 16(6):568-576.
- Duijm, L. E., Louwman, M. W., Groenewoud, J. H., Poll-Franse, L. V., Fracheboud, J., and Coebergh. J. W. (2009) Inter-observer variability in mammography screening and effect of type and number of readers on screening outcome. British Journal of Cancer 100(6): 901-907.
- Azar, A. T. (2014). Statistical Analysis for Radiologists' Interpretations Variability in Mammograms. International Journal of Systems Biology and Biomedical Technologies 1:4, 28-46
- Obenauer, S., Hermann, K. P. and Grabbe E. (2005). Applications and literature review of the BI-RADS classification. Eur Radiol; 15:1027–1036.
- Dougherty, G. (2010). Image analysis in medical imaging: recent advances in selected examples. Biomedical Imaging and Intervention Journal. 6(3):e32.
- Bovis, K., and Singh, S. (2000). Detection of masses in mammograms using texture feature, In: Proc. of the 15th Int. Conf. on Pattern Recognition (ICPR'00), pp 267-269.
- Kayode, A. A., Afolabi, B. S. and Ibitoye, B. O. (2015). An Explorative Survey of Image Enhancement Techniques Used in Mammography. International Journal of Computer Science Issues, 12(1):72-79.
- Ramani, R. and Vanitha, N. S. (2014). Computer Aided Detection of Tumours in Mammograms. I.J. Image, Graphics and Signal Processing. 4:54-59.
- Deepa, S. and Bharathi, V. S. (2013). Efficient ROI segmentation of Digital Mammogram images using Otsu's N thresholding method. Indian Journal of Automation and Artificial Intelligence, 1(2): 51-56.
- Yuvaraj, K. and Ragupathy, U.S. (2013). Automatic Mammographic Mass Segmentation based on Region Growing Technique. 3rd International Conference on Electronics, Biomedical Engineering and its Applications (ICEBEA'2013) Singapore. Pp 169-173.
- Elfarra, B. K. and Abuhaiba, I. S. I. (2013). New Feature Extraction Method for Mammogram Computer Aided Diagnosis. International Journal of Signal Processing, Image Processing and Pattern Recognition, 6(1): 13-36
- Elfarra, B. K. and Abuhaiba, I. S. I. (2012). Mammogram Computer Aided Diagnosis. International Journal of Signal Processing, Image Processing and Pattern Recognition, 5(4): 1-30.
- Akilandeswari, U., Nithya, R. and Santhi, B. (2012). Review on Feature Extraction Methods in Pattern Classification. European Journal of Scientific Research. 71(2):265-272.
- Pradeep, N., Girisha, H., Sreepathi, B. and Karibasappa K. (2012). Feature extraction of mammograms. International Journal of Bioinformatics Research; 4(1): pp. 241-244.
- Haralick, R. M., Shanmugan, K. and Dinstein, I. (1973). Textural Features for Image Classification. IEEE Transactions on Systems, Man, and Cybernetics, 3(6): 610-621.
- Soh, L. K. and Tsatsoulis, C. (1999). Texture Analysis of SAR Sea Ice Imagery Using Gray Level Co-Occurrence Matrices. IEEE Transactions on Geoscience and Remote Sensing, 37(2):780–795.
- Vasantha, M., Bharathi, V. S. and Dhamodharan, R. (2010). Medical Image Feature Extraction, Selection and Classification. International Journal of Engineering Science and Technology, 2(6):2071-2076
- MathWorks, Inc. (2013a). MATLAB® Creating Graphical User Interfaces, The MathWorks, Inc, Natick, MA 01760-2098, USA.
- Nasiruzzaman, A. B. M. (2010). Using MATLAB to Develop Standalone Graphical User Interface (GUI) Software Packages for Educational Purposes, Matlab - Modelling, Programming and Simulations, Emilson Pereira Leite, E. P. (Ed.), ISBN: 978-953-307-125-1, InTech.
- Haralick, R. M. (1979). Statistical and structural approach to texture. Proceeding of the IEEE, 67: 786-804.
