Priorities of budget financing of cities and regions of the Russian North

Author: Timushev Evgenii N.
Journal: Economic and Social Changes: Facts, Trends, Forecast @volnc-esc-en
Section: Public finance
Article in issue: 1 (61) т.12, 2019.
Free access
The paper analyzes the phenomenon of the flypaper effect - non-identical growth of inter-budget transfer and equivalent growth of private income for budget expenditures - in the relations between the budgets of the Northern entities of Russia and their local budgets for 2013-2016. We conduct comparative assessment of the budget response to changes in parameters of the private sector on the one hand; on the other hand, in parameters of relations with the budget of another level. The relevance of the proposed study of inter-budget relations lies in determining the effects of inter-budget redistribution and optimal expenditures at different levels of the budget system in the current system of distribution of expenditure obligations. The purpose of the present research is to reveal the consequences of allocation of non-target transfers from budgets of the entities in the Russian North from the point of view of fiscal incentives formed in the process of inter-budget relations and the models of behavior of local budgets created by these incentives...
Flypaper effect, north, russia's constituent entities, local budgets, grants
Short address: https://sciup.org/147224128
IDR: 147224128 | UDC: 332.14, | DOI: 10.15838/esc.2019.1.61.10
Text of the scientific article Priorities of budget financing of cities and regions of the Russian North
The research in inter-budgetary relations including the study of causes and consequences of budgetary funds redistribution lay emphasis on fiscal incentives of relations participants’ motivation that form a basic budgetary framework (composition and structure of revenue and expenditure). The analysis of fiscal incentives is intended to reflect the result of balancing positive (for example, equalization of territorial budgets’ revenues) and negative (discouragement of tax base growth) properties of transfers in terms of budget system efficiency.
We should mention one of the ways to analyze inter-budgetary relations, such as a comparative assessment of the budget’s reaction (in terms of its actual costs) to changes in the private sector parameters (private income1) and the parameters of relations with the budget of another level (inter-budgetary transfers). The phenomenon, when growth in transfers and equivalent growth in private income for budget expenditures are non-identical is called a flypaper effect (in another way it can be called the effect of high dependence of expenses on transfers).
From a conceptual point of view, the flypaper effect is a rise in budget expenditures after receiving an inter-budgetary transfer
(usually non-targeted2), exceeding the growth that could be caused by a similar increase in private income in a given territory, taking into account the marginal propensity to consume local public goods on the part of population (see, for example [1; 2; 3]). Resources “stick” to the budget system, in contrast to the neoclassical paradigm theory: the authorities defending the interests of a representative votertaxpayer would find it more profitable to reduce the tax burden by increasing population’s welfare [4].
However, there is no clear opinion about the flypaper effect in the literature. Thus, its existence is denied for a wide range of reasons, including:
-
1. Emergence of the incentive to reduce own income and consequently decrease total costs, which is identified clearly [5] or adjusted for endogeneity3 (adjusted for recipient’s ability to influence parameters) of a transfer [6]. In other words, there is a displacement of own budget revenues by an inter-budgetary transfer.
-
2. Nature of the budget restriction of a recipient in case of a targeted limited transfer [7].
-
3. Underestimation of spatial factors in the works, indicating the presence of the flypaper
effect – interconnection of the budget parameters of the adjacent territories [8].
As for analysis methods, in terms of possible flypaper effect existence, in empirical research the works proposing correct methods for quantitative estimation of the effect are of importance [9; 10; 11].
On the other hand, it is empirically shown that if the increase in expenditures of a recipient budget due to grown private income is estimated at about 0.1 units [12; 13; 14], the range of changes in expenses per a transfer can vary from 0.25 to 1.06 [3]. For non-targeted transfers, the stimulating effect on costs is less pronounced (0.25–0.43 [15] or 0.4–0.5 [14]) and, therefore, the analysis of their impact is of particular interest. Indeed, even the fact of (partial) displacement of own revenues by inter-budgetary transfers in the conditions of endogeneity does not guarantee the absence of the flypaper effect. The degree of displacement depends on characteristics of a study object, such as a type and conditions of the use of a transfer, preferences regarding co-financed expenditure items in case of a targeted transfer, the state of a budget and the socioeconomic situation of a municipality and other circumstances [16; 17].
Public finance is the main area of research and practical application of the flypaper effect phenomenon. However, it is also considered in the framework of the theory of public choice [18] and widely studied in the political economy of inter-budgetary relations – in the relations between levels of the budget system [19] and in the political process at the local level [20; 21]. It is believed that at the regional level, the flypaper effect is particularly vivid in the co-financing (including in the form of nontargeted transfers) of the most important powers of a local budget [22].
As for the Russian budget system, the flypaper effect method is also used, but with various modifications of the quantitative assessment method. P. Kadochnikov et al. [23] applies a system of simultaneous equations, where the growth in costs depends on the increase in a transfer. According to the 1996– 2000 data, the greater part of the increase in federal transfers financed the subjects’ budgets, a recipient acted in the interests of the donor budget, that is, the flypaper effect was identified. L. Freinkman and A. Plekhanov [24] use the aspect of this concept in relation to the degree of lower budgets decentralization. They confirm the hypothesis of a negative impact of inter-budgetary transfers in terms of reducing decentralization (growth of centralization) of the Russian budget system on the basis of the 1996–2001 data. The work [25] considers linear regression under the general scheme used in this work, with the GRP of Russian subjects as an income indicator. On the basis of the 1996– 2006 data the researchers prove the flypaper effect existence in the relations between the federal budget and the subjects’ budgets.
Thus, the attention of domestic researchers, interested in the behavior of a recipient budget after receiving an inter-budgetary transfer, is focused on the level of relations between a federal and region’s budget. In our work, the flypaper effect method is applied to the budget systems of ten Northern regions of Russia (a level of “a subject’s budget – a city/district’s budget”). The calculations are conducted for ten Northern subjects of Russia4.
General approach and relevance of the flypaper effect analysis
Methodologically, the flypaper effect is a tool (concept) to analyze the system of inter-budgetary relations by estimating applicability of the effect appearance causes proposed by the theory for the given system.
The basis for quantitative calculations of the flypaper effect is the assessment of parameters of the expenses dependence on income and transfer factors (1), formulated on the basis of the utility function of a recipient budget:
Expenditure^ =
= f (Private_Incomeit, Transfer^, X-t~),
where Expenditure – budgetary costs;
Private_Income – a private income variable;
Transfer – an inter-budgetary transfer variable;
X – a vector of auxiliary variables.
The values of partial derivatives of a costs variable are determined and compared:
dExpenditure dPrivate_Income
V
dExpenditure
dTransfer
The flypaper effect analysis is an aspect of the analysis of the problem of an optimal value of public goods supply in the economic system. The provision of an inter-budgetary transfer reduces the value of general territorial benefits (donor’s expenses) in order to expand the provision of local ones. It is believed that the “loss” of the former exceeds the production of the latter in value terms5 [26], but is more effective on the scale of economy as a whole (due to the arguments about the effectiveness of costs decentralization, distribution of tax powers and less distorting effect of general territorial taxes). Identification of the flypaper effect reveals “compensation” of this loss at the expense of the sector of private goods production and the satisfaction of budgetdonor’s interests. The absence of the effect indicates a more flexible (with the potential to reduce the burden) tax policy of a recipient budget and potentially its greater consideration of local taxpayers’ interests; still financial resources go back to the private sector at the amount exceeding the effective level. Thus, the research in inter-budgetary relations through tools of the flypaper effect concept is relevant, as it tries to understand optimality of the relative magnitude of costs of the budget system of different levels within a particular model of expenditure commitments distribution. Besides, application of the method can clarify effects of inter-budgetary redistribution in the context of sectors (private/public) and balance of actors’ interests (taxpayer and donor budget).
Theoretical factors (causes) of the flypaper effect can be summarized as follows:
-
• the theoretical message about impossibility of the flypaper effect is incorrect, nonidenticalness of the impact of income and transfer is devoid of research interest (the topic of the flypaper effect loses a significant degree of relevance);
-
• the incorrect method for assessing data leading to a false conclusion about existence of the effect that is not actually present;
-
• the lack of authority and independence of budgets – transfer recipients;
-
• the local tax policy is not able to provide an optimal level of tax burden;
-
• the need for increased financing of local public goods on the part of a group of actors;
-
• the phenomenon of incomplete information, causing fiscal illusion and action towards suboptimal results;
-
• features of the inter-budgetary transfer system – recipient’s inadequate assessment of their nature or subtle details in the distribution design.
Evaluation method, data sources
The purpose of the study is to determine the consequences arising in the process of allocation of non-targeted transfers at the level of budgets of cities and districts of Northern subjects of Russia, including fiscal incentives.
The system of inter-budgetary relations between budgets of Russian subjects and budgets of urban districts and districts is a study object.
The impact of remuneration parameters in a municipality and non-targeted inter-budgetary transfers (grants), received by a local budget, on budget expenditures is a study subject.
In this work in order to analyze inter-budgetary relations of northern budgets of the constituent entities of Russia and their cities and districts (local budgets), the traditional model to calculate the flypaper effect, is modified as follows:
|
п Ett = Ах Payroll^1 х Gen. Grcint^ x PRICE“t3 x j^C^)"7 x ett, j=* where E — expenses of a local budget of a RF subject; A — an intercept term; Payroll — annual accrued wages of organizations employees in a municipality; Glen.Grant — a total amount of grants received by a local budget; PRICE — a price of expenses co-financed by targeted transfers, perceived by a recipient (by analogy with the method used in [9]); X— a vector of auxiliary variables: X’ = {R(Publ. Empl.); R(Elderly)}. Interpretation of auxiliary variables: R(Publ.EmpL) — a share of the employed in state-owned organizations, R (Elderly) — a share of the population over the working age in the territory, The values of indicators are taken per capita at 2016 values (for the Komi Republic -2015) by indexing by the annual consumer price index. |
(3) |
A relative price factor was added to the main cost factors, which is an indicator of the willingness to bear costs that are co-financed through targeted transfers. For example, the higher the share of targeted transfers in local budget expenditures and the lower the preference for co-financed expenditure items, the higher the price of targeted local budget expenditures. Two supporting variables, such as a share of the public sector and a share of the older population, were also taken into account.
As an econometric technique, the least squares method (LSM) is used for panel data with fixed (a fixed effect model) or random effects (a random effect model). The fixed effects model shows the contribution of variables compared to its own reference base and fixes the interaction of variables with unexplained variation factors (errors); thus, the list of variables to be evaluated may not be exhaustive. Coefficients in the random effect model are considered to be more effective, but are more often biased, since they correlate with the error vector (whereas it is required that in this model the effects not explained by explicit variables are minimal). The choice of a particular model is based on the Hausman test results.
The calculations are carried out after logarithm. The factor contribution is calculated linearization (3) by means of taking the through partial derivatives:
ЭЕ dPayroll
= exp(a0) x Gen. Grant12 x PRICE13 x
n
П^7" )ai x aT x Income(11-1\ i=*
ЭЕ dGen. Grant
= exp(a0) x Payroll11 x PRICE13 x
n
^^(^i )a’ x a2 x Gen. Grant( “ 2 T), i=*
ЭЕ dPRICE
= exp(a0) x Payroll11 x Gen. Grant12 x
n
^(^i )ai x a3 i=*
x PRICE(13 - T\
The main analysis period includes 2013– 2016. The choice is determined by the presence/absence of information on average wages in municipalities. For the Komi Republic , due to the availability of data, the calculations are made for 2006–2015 and separately for 2013–2015 (the latter – to compare with the results for other Russian subjects). The lack of data for 2016 and the calculation conducted for earlier periods allow us to compare the importance of including a specific time period in the inter-regional comparison. In the Magadan and Murmansk oblasts , on the contrary, the analyzed period is narrowed (2013–2015 and 2013–2014, respectively) due to a lack of data on accrued wages.
The calculations for local budgets of the Republic of Karelia are carried out in two versions – in nominal values (according to the statistics) and recalculated ones with regard to a possible representation error – as the anomalous values of local budgets expenses in the Kalevalsky, Kondopozhsky and Medvezhyegorsky Municipal districts are found in the 2014 data (an order of magnitude higher than the average for 2006–2016).
The Federal State Statistics Service of the Russian Federation (database “Indicators of municipalities” (DB IM) is the main source of primary data. The data for the Komi Republic are based on the information of the Ministry of Finance of the Komi Republic (report on the budget performance of the Komi Republic) and the Statistical Yearbook issues.
For the Komi Republic the data on the amount of a grant are not actual, but calculated (instrumental variable) in order to reduce the risk of endogeneity (mutual influence of dependent and independent variables). The calculations for modeling the amount of a grant are carried out by means of with the time-specific fixed effect by factors of budgetary provision before the grant allocation for equalization and the proportion of population over the working age in the Komi Republic municipalities. All the values for districts and cities in the Republic are also indexed by values of the budget expenditure index published by the Ministry of Finance of the Komi Republic in order to neutralize inter-municipal differences and bring the values in a comparable form, taking into account differences in the level of prices (labor costs and utilities) in municipalities.
Preliminary analysis of the Northern Russian regions
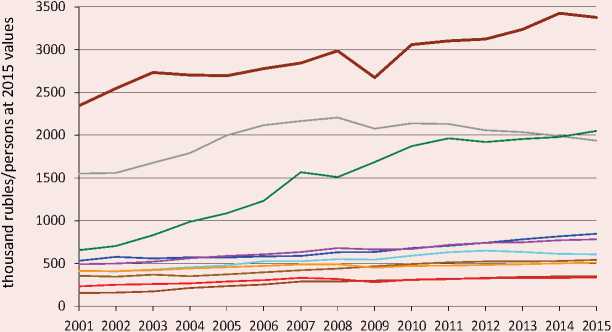
Both autonomous districts of the Ural Federal District and the Sakhalin Oblast ( Fig. 1 ) can be distinguished by the size of gross regional product (GRP). The rest seven entities
Figure 1. Gross regional product
^^^^^^^аYaNAO
KhMAO
Sakhalin Obl.
Magadan Obl.
Rep. of Sakha (Yakutia) Rep. of Komi Kamchatka Krai Murmansk Obl.
Arkhangelsk Obl. without NAO Rep. of Karelia
Note. Indexed by the index of physical volume of GRP.
Source: Federal State Statistics Service of the Russian Federation.
are relatively close to each other. Almost all the subjects are characterized by a weak upward trend, with the exception of Khanty-Mansi Autonomous Okrug (KhMAO) and the Komi Republic, where the specific GRP values began to decrease in 2011 and 2013, respectively.
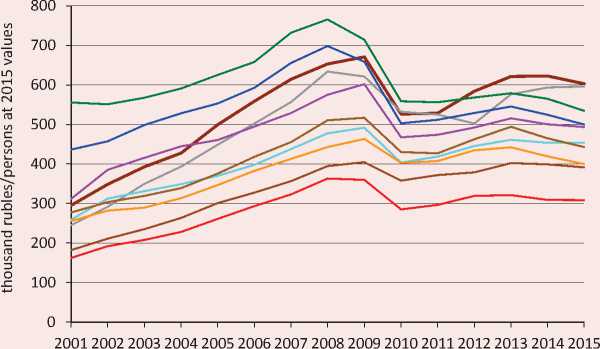
By the indicator of accrued wages, the differentiation between the subjects under consideration is much smaller than by GRP, while the dynamics is less unambiguous ( Fig. 2 ). The subjects of the Asian part of Russia and economically developed autonomous districts
Figure 2. Annual payroll
^^^^^^^^™ Magadan Obl.
Sakhalin Obl.
YaNAO
KhMAO
Kamchatka Krai
^^^^^^^^^^^^^^ Rep. of Sakha (Yakutia)
^^^^^^^^^^е Murmansk Oblast
Rep. of Komi
Arkhangelsk Oblast without NAO
Rep. of Karelia
Note. Indexed by the consumer price index.
Source: Federal State Statistics Service of the Russian Federation.
(KhMAO and Yamalo-Nenets Autonomous Okrug (YaNAO)) are significantly ahead of the subjects of the country’s European North.
Thus, the preliminary analysis of the Northern Russian subjects indicates the dominance of autonomous okrugs of the Ural Federal District and the Sakhalin Oblast by economic development in terms of gross regional product and the lagging nature of European regions in terms of specific wages.
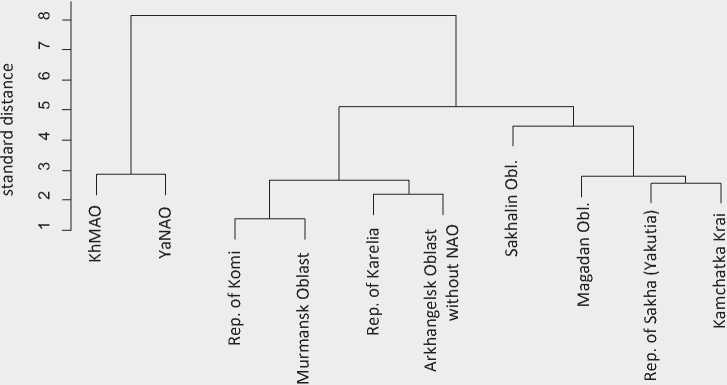
The analysis of a larger number of factors (see note to Fig. 3) allows us to make grouping (clustering) of the considered subjects of Russia. When approaching at the level of five standardized (indicators are normalized by the value of their standard deviation) units of distance between subjects (which is about half of the total standardized distance), three groups of budget systems are clearly distinguished (Fig. 3). They coincide with the group selected by a geographical basis. Economically developed KhMAO and YaNAO, subjects of the European North of Russia and Asian Northern regions are approximately homogeneous within the respective groups (clusters) in terms of public finance and regional economy.
With a deeper analysis (at the level of four standardized units of distance), the Sakhalin Oblast forms a separate (fourth) group.
The average value of a non-targeted inter-budgetary transfer from the regional budget in all RF subjects is above the median, with the exception of the Arkhangelsk Oblast ( Tab. 1 ). Thus, the spread of transfers in the upper part of the row is higher than in the lower one. This is also evidenced by the positive coefficient of asymmetry. The negative kurtosis coefficient, characteristic of most subjects, indicates a relatively high spread of the specific value of grants.
Figure 3. Grouping of the analyzed Northern subjects of the Russian Federation
Clustering of the RF Northern subjects
RF subjects hclust (*, "complete")
Note. Average distance by standardized indicators values. Analyzed indicators (2006–2015 data): parameters of public finances (expenditures, deficit and own budget revenues of a RF subject) and macroeconomics at the regional level (GRP per capita, average wage, unemployment rate, share of employment in state-owned organizations, share of population over working age, density of public roads paved). Primary indicators are presented in a comparable form, including with regard to the leveling of inter-regional differences through by the budget expenditure index (BEI).
|
No. |
Subject |
Min |
Max |
Mean |
Median |
Standard deviation |
Coefficient of variation |
25-quan-tiles * |
75-quan-tiles * |
Interquartile range |
Coefficient of kurtosis |
Coefficient of skewness |
|
1. |
Arkhangelsk Oblast |
0.0 |
5.6 |
2.0 |
2.1 |
1.5 |
0.73 |
0.6 |
2.9 |
2.3 |
-0.56 |
0.32 |
|
2. |
KhMAO |
0.0 |
44.1 |
11.4 |
8.1 |
10.6 |
0.93 |
2.5 |
16.5 |
14.0 |
0.75 |
1.10 |
|
3. |
YaNAO |
3.2 |
196.2 |
62.2 |
43.8 |
52.7 |
0.85 |
23.5 |
84.9 |
61.4 |
0.06 |
1.10 |
|
4. |
Kamchatka Krai |
1.0 |
137.3 |
46.4 |
36.0 |
35.3 |
0.76 |
23.9 |
57.9 |
34.0 |
-0.12 |
0.85 |
|
5. |
Republic of Karelia |
0.0 |
3.0 |
0.7 |
0.5 |
0.8 |
1.09 |
0.0 |
1.1 |
1.1 |
-0.08 |
0.99 |
|
6. |
Republic of Karelia (excluding the anomalously high data for 2014) |
0.0 |
3.0 |
0.7 |
0.5 |
0.8 |
1.08 |
0.0 |
1.1 |
1.1 |
-0.08 |
0.99 |
|
7. |
Komi Republic (2006–2015) |
1.2 |
14.9 |
7.2 |
6.9 |
3.1 |
0.44 |
5.0 |
8.9 |
3.9 |
-0.32 |
0.41 |
|
8. |
Komi Republic (2013-2015) |
1.2 |
14.9 |
6.9 |
6.3 |
3.4 |
0.50 |
4.8 |
8.1 |
3.3 |
-0.29 |
0.69 |
|
9. |
Magadan Oblast |
2.2 |
61.1 |
21.5 |
18.6 |
13.6 |
0.63 |
13.5 |
24.9 |
11.4 |
0.99 |
1.10 |
|
10. |
Murmansk Oblast |
0.4 |
46.8 |
11.4 |
4.8 |
15.2 |
1.33 |
0.6 |
13.8 |
13.2 |
0.34 |
1.35 |
|
11. |
Republic of Sakha-(Yakutia) |
0.0 |
87.7 |
36.7 |
35.6 |
20.0 |
0.54 |
26.9 |
47.0 |
20.1 |
-0.28 |
0.16 |
|
12. |
Sakhalin Oblast |
0.8 |
65.9 |
25.1 |
24.2 |
14.5 |
0.58 |
12.6 |
33.8 |
21.2 |
-0.14 |
0.50 |
|
Note. In comparable values (per capita at 2016 values (for the Komi Republic – 2015)), but without regard to inter-regional differences. * 25-quantiles and 75-quantiles – an indicator value, which limits 25% (75%) of ascending values of the total (an indicator value x, not exceeding the probability of 25% (75%)). ** Interquartile range – difference between 75-quantiles and 25-quantiles, characterizes the spread of the value around the median. Sources: Federal State Statistics Service of the Russian Federation (database “Indicators of municipalities”); author’s calculations. |
||||||||||||
In the Republic of Karelia and the Murmansk Oblast there is a high variation in the amount of transfers to local budgets. In the Murmansk Oblast this can be attributable to occasional cases of transfers with extremely high values (a large difference between the average and the median). These subjects, along with the Arkhangelsk Oblast, are generally characterized by relatively small amounts of grants allocated by the regional budget of a relevant RF subject (indicator 25-quantile). Among these subjects the smallest proportion of transfers is allocated to local budgets of the Republic of Karelia.
Results
A model for coefficient estimation according to (3) by panel data is chosen according to the previously estimated parameters of panel regressions by means of the Hausman test
( Tab. 2 ). The estimates based on the random effect model are more effective, but fraught with the appearance of shift coefficients.
The explanatory power of the constructed dependence equations is relatively high, with the exception of regressions in the republics of Karelia (according to nominal primary data), Komi (2013–2015) and Sakha (Yakutia) ( tab. 3 ).
All the results with a negative regression coefficient for the grant variable (Gen.Grant) turn out to be statistically insignificant. Otherwise, it might indicate a negative fiscal stimulus for the recipient, a negative effect of inter-budgetary relations between regional and local budgets and a general loss of welfare.
In a large number of cases the impact of a transfer on costs is insignificant: the Arkhangelsk Oblast, KhMAO, the Komi
Table 2. Hausman test results by panel data of Northern subjects
|
No. |
Subject |
Chi square* |
P-Value** |
Choice of a panel regression model |
|
1. |
Arkhangelsk Oblast |
37.502 |
0.000*** |
Fixed effect model |
|
2. |
Khanty-Mansi Autonomous Okrug |
74.276 |
0.000*** |
Fixed effect model |
|
3. |
Yamalo-Nenets Autonomous Okrug |
12.265 |
0.031** |
Fixed effect model |
|
4. |
Kamchatka Krai |
11.528 |
0.042** |
Fixed effect model |
|
5. |
Republic of Karelia |
3.262 |
0.660 |
Random effect model |
|
6. |
Republic of Karelia (excluding the anomalously high data for 2014) |
7.000 |
0.200 |
Random effect model |
|
7. |
Komi Republic (2006–2015) |
10.417 |
0.064* |
Fixed effect model |
|
8. |
Komi Republic (2013–2015) |
28.007 |
0.000*** |
Fixed effect model |
|
9. |
Magadan Oblast |
8.440 |
0.134 |
Random effect model |
|
10. |
Murmansk Oblast |
7.853 |
0.165 |
Random effect model |
|
11. |
Republic of Sakha (Yakutia) |
64.804 |
0.000*** |
Fixed effect model |
|
12. |
Sakhalin Oblast |
8.531 |
0.129 |
Random effect model |
* Statistics (tabulated distribution) used in testing.
** The probability that it is necessary to use a method with random effects, in units. Source: author’s calculations.
Table 3. Panel regression coefficients (method (3))
|
No. |
Subject |
Regression model |
Coefficient of Payroll |
Coefficient of Gen.Grant |
Coefficient of PRICE |
Intercept term |
R2(norm.) |
|
1 |
Arkhangelsk Oblast |
Fixed effect1 |
1.16 (0.24)*** |
0.04 (0.03) |
-1.03 (0.14)*** |
0 |
0.43 |
|
2 |
Khanty-Mansi Autonomous Okrug |
Fixed effect |
0.61 (0.32)* |
0.002 (0.02) |
-0.93 (0.27)*** |
0 |
0.66 |
|
3 |
Yamalo-Nenets Autonomous Okrug |
Fixed effect |
1.187 (0.50)** |
0.193 (0.08)** |
-2.61 (0.53)*** |
0 |
0.50 |
|
4 |
Kamchatka Krai |
Fixed effect |
0.75 (0.23)*** |
0.22 (0.06)*** |
-1.72 (0.23)*** |
0 |
0.57 |
|
5 |
Republic of Karelia |
Random effect2 |
1.05 (0.47)** |
0.16 (0.09)* |
-2.28 (1.29)* |
-1.29 (2.04) |
0.17 |
|
6 |
Republic of Karelia (excluding the anomalously high data for 2014) |
Random effect |
0.57 (0.13)*** |
0.06 (0.02)** |
-1.87 (0.27)*** |
1.33 (0.52)** |
0.93 |
|
7 |
Komi Republic (2006– 2015) |
Fixed effect |
0.87 (0.12)*** |
0.08 (0.04)** |
2.84 (1.01)*** |
0 |
0.52 |
|
8 |
Komi Republic (2013– 2015) |
Fixed effect |
1.15 (0.54)** |
-0.03 (0.11) |
-1.06 (3.62) |
0 |
0.30 |
|
9 |
Magadan Oblast |
Random effect |
-0.21 (0.26) |
-0.04 (0.06) |
-0.99 (0.35)** |
5.06 (1.14)*** |
0.72 |
|
10 |
Murmansk Oblast |
Random effect |
0.23 (0.25) |
0.04 (0.03) |
-0.64 (0.33)* |
6.73 (0.94)*** |
0.81 |
|
11 |
Republic of Sakha (Yakutia) |
Fixed effect |
0.37 (0.11)*** |
-0.01 (0.02) |
-1.12 (0.11)*** |
0 |
0.33 |
|
12 |
Sakhalin Oblast |
Random effect |
0.255 (0.14)* |
0.15 (0.04)*** |
-0.76 (0.17)*** |
5.11 (0.77)*** |
0.77 |
In parentheses under the coefficient – a standard error. * Probability of error of rejection of the hypothesis that the regression coefficient is equal to zero less than 10%; **less than 5%; *** less than 1%. Source: author’s calculations. |
|||||||
Table 4. Estimation of changes in expenditure due to changes in a factor unit: application (4) for the method (3)
|
No. |
Subject |
d E /d Payroll |
d E /d Gen.Grant |
d E /d PRICE |
(d E /d Payroll ) minus (d E /d Gen.Grant ) |
Note |
|
1. |
Arkhangelsk Oblast |
2.64 |
0.00 |
-113.49 |
2.64 |
Insignificant impact of a transfer on expenses |
|
2. |
Khanty-Mansi Autonomous Okrug |
0.14 |
0.00 |
-17.33 |
0.14 |
Insignificant impact of a transfer on expenses |
|
3. |
Yamalo-Nenets Autonomous Okrug |
8.16 |
1.72 |
-1627.25 |
6.45 |
Impact of income on expenses is greater than impact of the transfer |
|
4. |
Kamchatka Krai |
0.95 |
0.41 |
-191.14 |
0.55 |
Impact of income on expenses is greater than impact of the transfer |
|
5. |
Republic of Karelia |
1.52 |
11.04 |
-126.31 |
-9.52 |
FLYPAPER EFFECT |
|
6. |
Republic of Karelia (excluding anomal data) |
0.57 |
2.66 |
-71.37 |
-2.09 |
FLYPAPER EFFECT |
|
7. |
Komi Republic (2006–2015) |
0.57 |
0.21 |
56.21 |
0.36 |
Impact of income on expenses is greater than impact of the transfer |
|
8. |
Komi Republic (2013–2015) |
1.90 |
0.00 |
0.00 |
1.90 |
Insignificant impact of a transfer on expenses |
|
9. |
Magadan region |
0.00 |
0.00 |
-241.87 |
0.00 |
Insignificant impact of a transfer on expenses |
|
10. |
Murmansk Oblast |
0.00 |
0.00 |
-704.49 |
0.00 |
Insignificant impact of a transfer on expenses |
|
11. |
Republic of Sakha (Yakutia) |
0.04 |
0.00 |
-6.49 |
0.04 |
Insignificant impact of a transfer on expenses |
|
12. |
Sakhalin Oblast |
5.09 |
7.05 |
-1598.73 |
-1.95 |
FLYPAPER EFFECT |
|
Source: author’s calculations. |
||||||
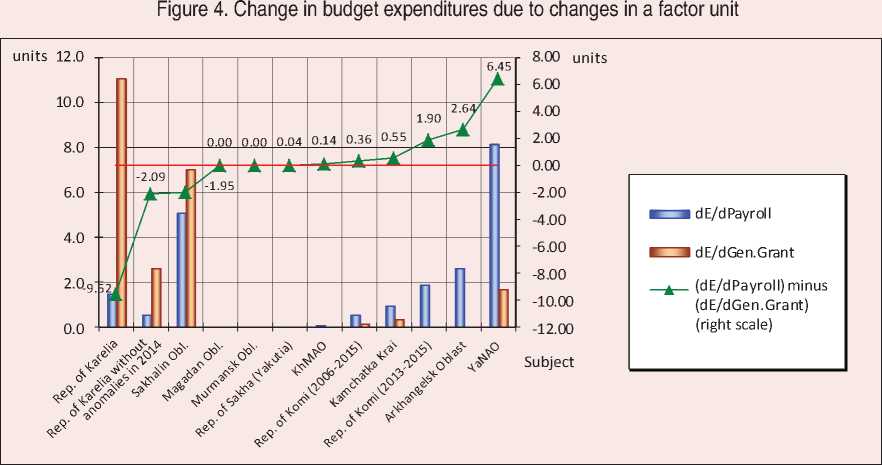
Republic (2013–2015), the Magadan and Murmansk oblasts and the Republic of Sakha (Yakutia); tab. 4 ). Accordingly, the flypaper effect is not observed here. As for the Magadan and Murmansk oblasts, it can be concluded that with a high degree of probability the forced narrowing of the observation period leads to the results close to insignificant in terms of their reliability.
The contribution of grants to the formation of local budget expenditures (considerable, but smaller in size compared to the contribution of a variable that acts as a private income indicator) is recorded in the YaNAO, Kamchatka Krai and the Komi Republic (2006–2015). Here, the flypaper effect is also not fixed.
For the Republic of Karelia (according to nominal initial and recalculated data) and the Sakhalin Oblast, the calculations reveal the presence of the flypaper effect in the relationship between the relevant budget of a constituent entity and local budgets.
The results for the Republic of Karelia allow us to conclude that taking the logarithm in the method to assess the flypaper effect decreases the error that may occur when working with initial data. So, the difference between the contributions of private income and a transfer, according to the calculations based on the adjusted initial data, is much smaller in modulus, than the result of the calculations based on the nominal data, obviously containing a specification error. The final index of the flypaper effect for the Republic of Karelia is comparable with that for the Sakhalin Oblast.
Source: author’s calculations.
Inter-budgetary relations in the Arkhangelsk Oblast, Yamalo-Nenets Autonomous Okrug and the Komi Republic (in the latter case for both periods) are characterized by the prevalence of the contribution of revenues to local budgets’ expenditure over the contribution of grants from the budget of a relevant RF subject to expenses ( Fig. 4 ). For these subjects the prerequisites for the flypaper effect do not seem to be fulfilled.
Conclusion
The conducted analysis of inter-budgetary relations between the budgets of Northern regions of the Russian Federation and the corresponding local budgets of cities and districts allows us to formulate the following conclusions.
Fiscal incentives resulting from the relationship between the budgets of subjects and the budgets of cities and regions of the North, and behavior models, they form in the sphere of local budget expenditures, are different in various budget systems. The analysis of allocated regional non-targeted transfers, according to the indicator of flypaper effect presence/absence and the theory statements, indicate the presence of two groups of regional budget systems in the North of Russia:
-
1. Local budgets in the Republic of Karelia and the Sakhalin Oblast – the RF subjects with the identified flypaper effect in 2013–2016: participating in inter-budgetary relations with the relevant regional budget, they try to meet interests of this budget, are more ready to expand the production of local goods. The lack of authority and independence of local budgets is more pronounced here, local tax policy does not provide a tax burden level adequate to needs. Local demand is likely to be resilient: it increases in response to the growth of transfers, but at the same time, local budget expenditures are particularly inelastic due to the standardization of spending and limited tax powers. In this regard, the structure of inter-
- budgetary transfers of the subject’s budget in the Republic of Karelia and the Sakhalin Oblast deserves a separate analysis.
-
2. Local budgets without the flypaper effect in their inter-budgetary relations with the subject’s budget – the Arkhangelsk Oblast, Khanty-Mansi and Yamalo-Nenets Autonomous okrugs, Kamchatka Krai, the Republic of Komi, the Republic of Sakha (Yakutia): they conduct a relatively more flexible fiscal policy, act in the interests of a local taxpayer to a relatively greater extent, but potentially at the expense of reduced production of regional goods. Perhaps, the structure of the transfers used provides for a certain degree of autonomy of local budgets, and local tax policy is relatively more effective.
The study significance is expressed in formulation of the following hypothesis, which requires confirmation in further studies. In the subjects with the identified flypaper effect there is a low (relative to other subjects) differentiation of local and regional costs, which prevents the realization of advantages of the division of powers and responsibilities in a decentralized system. There is a relatively high dissatisfaction with the current value of basic public sector services, which reduces the demand for local differentiation of budget expenditures.
The obtained results give an opportunity to conduct inter-regional research in several areas:
-
• a proportion of the importance of regional and local expenditures in a certain structure of regional political and tax systems;
-
• a decentralization degree of the budget system of a subject as a whole and in the context of expenditure items;
-
• a structure of budgetary expenditure;
-
• a structure of inter-budgetary transfers used.
The study significance is that we have found out that the reasons for the effect lie in the features of inter-budgetary relations, not fixed by traditional indicators of finance and regional economy. Thus, the presence of the flypaper effect in the inter-budgetary relations between a subject’s budget and a local one is not affected by the proximity of RF subjects in terms of general indicators of public finance and regional macroeconomics and/or geographical proximity of territories.
The results of the analysis also allow us to formulate conclusions of a methodical nature:
-
1. The observation period and the availability of initial data play an important role in the analysis of inter-budgetary relations, since the conclusions for the Magadan and Murmansk oblasts cannot be formulated with an adequate degree of reliability.
-
2. Taking a logarithm in the method to assess the flypaper effect decreases the magnitude of a potential error made in the processing of primary data (case study of the Republic of Karelia). Thus, the evaluation method plays an important role in this kind of research.
-
3. The duration of the observation period plays a certain role in the calculations (case study of the Komi Republic), but does not significantly affect the overall conclusion.
-
4. The calculated nature of a grant size for the Komi Republic (use of an instrumental variable) and the leveling of inter-municipal differences might have played a role in the fact that the flypaper effect is not recorded. Thus, these techniques are important and relevant in the flypaper effect analysis and, especially, in the application of the method to analyze empirical data on the Republic of Karelia and the Sakhalin Oblast.
References Priorities of budget financing of cities and regions of the Russian North
- Filimon R., Romer T., Rosenthal H. Asymmetric information and agenda control: the bases of monopoly power in public spending. Journal of Public Economics, 1982, vol. 17, no. 1, pp. 51-70.
- Wyckoff G. The elusive flypaper effect. Journal of Urban Economics, 1991, vol. 30, no. 3, pp. 310-328.
- Hines J.R., Thaler R.H. The flypaper effect. Journal of Economic Perspectives, 1995, vol. 9, no. 4, pp. 217-226.
- Bailey S.J., Connolly S. The flypaper effect: identifying areas for further research. Public Choice, 1998, vol. 95, no. 3/4, pp. 335-361.
- Gordon N. Do federal grants boost school spending? Evidence from Title I. Journal of Public Economics, 2004, vol. 88 (9-10), pp. 1771-1792. Available at: https://doi.org/10.1016/j.jpubeco.2003.09.002
- Knight B. Endogenous federal grants and crowd-out of state government spending: theory and evidence from the federal highway aid program. American Economic Review, 2002, vol. 92 (1), pp. 71-92. Available at: https://doi.org/10.1257/000282802760015612
- Moffitt R.A. The effects of grants-in-aid on state and local expenditures: the case of AFDC. Journal of Public Economics, 1984, vol. 23 (3), pp. 279-305. Available at: https://doi.org/https://doi.org/10.1016/0047-2727(84)90032-X
- Yu Y., Wang J., Tian X. Identifying the flypaper effect in the presence of spatial dependence: evidence from education in China’s counties. Growth and Change, 2016, vol. 47 (1), pp. 93-110. Available at: https://doi.org/10.1111/grow.12113
- Becker E. The illusion of fiscal illusion: unsticking the flypaper effect. Public Choice, 1996, vol. 86 (1-2), pp. 85-102. Available at: https://doi.org/10.1007/BF00114876
- Megdal S.B. The flypaper effect revisited: an econometric explanation. The Review of Economics and Statistics, 1987, vol. 69 (2), pp. 347-351. Available at: https://doi.org/10.2307/1927243
- Worthington A.C., Dollery B.E. Fiscal illusion and the Australian local government grants process: how sticky is the flypaper effect? Public Choice, 1999, vol. 99 (1-2), pp. 1-13 DOI: 10.1023/a:1018329802757
- Gamkhar S., Shah A. The impact of intergovernmental transfers: a synthesis of the conceptual and empirical literature. In: Boadway R., Shah A. (Eds.). Intergovernmental Fiscal Transfers: Principles and Practice. Public Sector Governance and Accountability. Washington, DC: World Bank, 2007. Pp. 225-258.
- Zampelli E. Resource fungibility, the flypaper effect, and the expenditure impact of grants-in-aid. The Review of Economics and Statistics, 1986, vol. 68, no. 1, pp. 33-40.
- Oates W.E. On the nature and measurement of fiscal illusion: a survey. In: Brennan G. et al. (Eds.). Taxation and Fiscal Federalism: Essays in Honour of Russell Mathews. Sydney: Australian National University Press, 1988. Pp. 65-82.
- Gramlich E.M., Galper H., Goldfeld S., Mcguire M. State and local fiscal federal behavior and federal grant policy. Brookings Papers on Economic Activity, 1973, vol. 1, pp. 15-65. Available at: https://doi. org/10.2307/2534084
- Khilji N.M., Zampelli E.M. The fungibility of US assistance to developing countries and the impact on recipient expenditures: a case study of Pakistan. World Development, 1991, vol. 19 (8), pp. 1095-1105 DOI: 10.1016/0305-750X(91)90127-4
- Van de Walle D., Mu R. Fungibility and the flypaper effect of project aid: micro-evidence for Vietnam. Journal of Development Economics, 2007, vol. 84 (2), pp. 667-685 DOI: 10.1016/j.jdeveco.2006.12.005
- Oulasvirta L. Real and perceived effects of changing the grant system from specific to general grants. Public Choice, 1997, vol. 91 (3), pp. 397-416. Available at: https://doi.org/10.1023/A:1004987824891
- Bracco E., Lockwood B., Porcelli F., Redoano M. Intergovernmental grants as signals and the alignment effect: theory and evidence. Journal of Public Economics, 2015, vol. 123 (Supplement C), pp. 78-91. Available at: https://doi.org/https://doi.org/10.1016/j.jpubeco.2014.11.007
- Witterblad M. Income heterogeneity and the flypaper effect. Umeå Economic Studies, 2007, no. 718. Available at: http://ideas.repec.org/p/hhs/umnees/0718.html
- Singhal M. Special interest groups and the allocation of public funds. Journal of Public Economics, 2008, vol. 92 (3-4), pp. 548-564 DOI: 10.1016/j.jpubeco.2007.05.005
- Deller S.C., Maher C.S. Categorical municipal expenditures with a focus on the flypaper effect. Public Budgeting & Finance, 2005, vol. 25 (3), pp. 73-90. Available at: https://doi.org/10.1111/j.1540-5850.2005.00368
- Kadochnikov P., Sinel’nikov-Murylev S., Trunin I. Sistema federal’noi finansovoi podderzhki regionov v Rossii i ee vliyanie na nalogovuyu i byudzhetnuyu politiku sub"ektov Federatsii . Мoscow: Institut Gaidara, 2002.
- Freinkman L., Plekhanov A. Fiscal decentralization in rentier regions. Ekonomicheskaya politika=Economic Policy, 2008, no. 1, pp. 103-123..
- Idrisova V., Freinkman L. Influence of Federal transfers on fiscal behavior of regional authorities. Nauchnye Trudy=Scientific Works, no. 137Р. Мoscow: Izd-vo Instituta ekonomiki perekhodnogo perioda, 2010..
- Logan R. Fiscal illusion and the grantor government. Journal of Political Economy, 1986, vol. 94, no. 6, pp. 1304-1318.
