Private expediters on the social services in the Northern regions of Russia

Author: Styrov M.M.
Journal: Arctic and North @arctic-and-north
Section: Sociological sciences
Article in issue: 11, 2013.
Free access
The article describes the main features and trends in private financing of the social expenditures in the Russian North. The estimation of the perspectives for the change in the structure of financing.
Health policy, culture, education, paid services, weather, prediction, region, North, social policy, social spending, finance
Short address: https://sciup.org/148320354
IDR: 148320354 | UDC: 332.14+336.53
Text of the scientific article Private expediters on the social services in the Northern regions of Russia
An essential element of the modern human being is social systems – education, health, social protection, culture. Familiar is their apparent free character, however the quality of the highest requirements. Over two decades of market reforms, most people have realized that the state cannot and should not bear the sole burden of responsibility for the well-being of every person must be concerned that private participation in the formation of required social benefits and, therefore, full or partial payment of their value from their own funds.
Recognizing the positive consequences of the changes have taken place – the growth of the quality of services, increase cost efficiency, greater development of forms and types of services and the level of service can not be allowed to over-commercialization of the social sphere, the loss of important achievements as universal education, the minimum necessary health care, and centralized security augmentation of cultural heritage. At present, there are still ongoing search for the best model of financing social spending, it turns out the possibility and desirability of a broader engagement private sources for modernizing the social sphere.
Equally important questions have raised in the Russian Arctic and the northern parts of the country due to such features of their socio-economic development, as increased natural-climatic load on the human body, a significant rise in the cost of social services, pronounced differential dissociation of income and a strong dependence of the latter on raw material export conditions, often more intense demographic situation. Therefore, it is topical to parse the private financing of the social expenditures in the northern regions of Russia in order to clarify their main characteristics and trends and future perspectives for the forecasting changes.
Methodological Basement of the research
The main source of information about the object of the research is the official statistics on the provision of various types of paid services: education, health (includes medical, spa and gym facilities and sports) and culture. Data on the volume of paid services in the field of the social protection and social services in the open statistics is the only part of the services rendered by senior citizens and the disabled, and only since 2011, so this category of services, the study was not considered.
Paid services provided in the statistics on the regional level and in two dimensions, in absolute terms and as a volume index. The first indicator reflects the amount of money paid by the consumer or the organization in which he works for the services rendered to him or his family services. Service providers are the only residents of the Russian economy, and consumers - as the citizens of the region, as well as citizens of other countries. Figure includes an assessment of hidden and informal activities in the market [2].
In connection with the use of this indicator is subject to certain technical difficulties. First, as noted, it includes services rendered by non-residents, so it cannot be correlated quite correct, for example, income and expenditure, or GRP. However, given the known fraction of residents in the consumption of services, as well as a counter misreporting in connection with a partial acquisition Russians services abroad, this inaccuracy possible neglect.
Second, this figure includes some of the costs of utilities for the social services, which complicates a comprehensive assessment of the costs of legal persons in the field. In this regard, and given the inaccessibility and odd bits of information on the costs of enterprises, this paper will limit the analysis to only the paid services.
Thirdly, we have to keep an eye on the fact that the volume of paid services, of course, is fixed at the place of delivery, and therefore, the estimate on the regional level will be distorted to the cases where a person receives income in one region, and uses the services of another, for example, when a child in high school or from out of town for treatment or spa and resort in the southern regions of the country. This problem appears to be an insoluble, and therefore there is inaccuracy will be ignored. When comparing private spending with budget error will be partly offset by the fact that the budget services in almost the same extent as private costs, are trans-regional in nature, especially in the higher education and health care.
Education
The total volume of paid services in the field of education for the 2000–2011 years. increased in the North, in nominal terms of 9.2 times to 19.8 billion rubles in Russia – by 8.4 times, and 347.3 billion rubles, respectively. Volume index confirms the rapid growth of the social services in the North relative to the national average: 2.5 vs 2.1 times. Most rapidly in the period of paid educational services grew in rich resource-exporting regions of the North: in Yakutia – in 3,3 times, in the Yamal-Nenets Autonomous District – 2.9 times, in the Magadan and Sakhalin regions – 2.7 times, in the Komi Republic – 2.5 times, in the Khanty-Mansi Autonomous District – 2.4 times (table 1). In other regions, the growth rate of spending was below average. The rapid growth in this period, most likely due to the sharp increase in popularity of higher education and the emergence of the economic opportunities for most families to pay for the services for their children [1]. On a per capita amount of paid education services in the northern regions of slightly higher than the national average: in 2011 it was 2.6 and 2.4 thousand, respectively, and in 2000 it was below 5 %. Typically, even in oil-producing regions it has no significant deviation in a big way, only in Sakhalin and Yakutia can state a significant increase over the average per capita expenditure – in 1,3-
1,8 times (see table 1).
Table1
Dynamics of the paid services in the Northern regions in the Russia in 2000–20111
The volume of sevices per capita, at current prices, The share of services in GRP, % thousand rubles
Regions Volume index, %
|
о о о CM |
о о CM |
00 о о CM |
о CM |
о о о см |
st о о см |
00 о о см |
о о см |
||
|
Russia, totally |
210,8 |
0,28 |
0,85 |
2,03 |
2,43 |
0,72 |
0,87 |
0,85 |
0,87 |
|
Northern regions, totally |
245,4 |
0,27 |
0,96 |
2,03 |
2,60 |
0,25 |
0,37 |
0,36 |
0,40 |
|
including: |
|||||||||
|
Republic Karelia |
206,9 |
0,19 |
0,66 |
1,40 |
2,01 |
0,48 |
0,87 |
0,84 |
0,91 |
|
Republic Komi |
249,2 |
0,17 |
0,80 |
1,56 |
2,15 |
0,30 |
0,61 |
0,52 |
0,49 |
|
Arkhangelsk region |
228,3 |
0,20 |
0,72 |
1,54 |
1,83 |
0,53 |
0,88 |
0,95 |
1,09 |
|
Nenezkiy AO |
181,2 |
0,12 |
0,27 |
0,91 |
1,17 |
0,04 |
0,03 |
0,04 |
0,03 |
|
Murmansk region |
162,9 |
0,31 |
1,07 |
2,32 |
2,79 |
0,52 |
0,75 |
0,92 |
0,93 |
|
Hanta-Mansiyskiy АО |
242,7 |
0,37 |
1,17 |
2,20 |
2,58 |
0,12 |
0,18 |
0,17 |
0,21 |
|
Yamalo Nenezkiy АО |
293,9 |
0,17 |
0,94 |
1,81 |
2,30 |
0,07 |
0,14 |
0,14 |
0,17 |
|
Yakutia Republic |
325,0 |
0,35 |
1,22 |
2,48 |
3,31 |
0,41 |
0,75 |
0,76 |
0,74 |
|
Kamchatskiy Region |
141,6 |
0,46 |
1,10 |
2,40 |
2,95 |
0,93 |
1,10 |
1,06 |
0,96 |
|
Magadanskiy region |
272,7 |
0,29 |
1,23 |
2,23 |
3,02 |
0,44 |
0,88 |
0,87 |
0,79 |
|
Sakhalinsky region |
268,0 |
0,24 |
1,03 |
3,20 |
4,72 |
0,39 |
0,60 |
0,50 |
0,45 |
|
Chykotskiy АО |
178,0 |
0,09 |
0,25 |
0,60 |
0,83 |
0,14 |
0,10 |
0,10 |
0,10 |
For the comparison, at the same time, per capita budget expenditure on education in the North have been above the national average by almost 2 times. Discrepancy appears to be due to the fact that most of the paid services of education have a higher education and a significant amount of services is outside the northern regions in connection with the training of children in metropolitan universities. The cost is low in regions of core focused on providing pre-school and secondary education, and in these areas the northern appreciation expressed most strongly in connection with a considerable share of utilities in the cost structure and finding the many educational institutions in remote outback areas.
As a percentage of the gross regional product for the period recorded a significant increase in private spending: in the North for 2000–2010 – from 0.25 to 0.4 %, in Russia – from 0.72 to 0.87 % (see table 1). These figures reflect explained above trend growth in private spending on education, but it is noteworthy that even in the face of this growth relationship with government funding does not move in a big way, which indicates a harmonious building of public spending. The relatively low share in GRP private expenditure on education in the North compared to the nationwide primarily due to a much higher level of the per capita gross regional product, especially in oilproducing regions. More rapid increase in the in the North relative to the average for Russia confirms already noted rapid increase in the volume of paid services.
In relation to the government funding is now not observed any significant increase in the share of paid services. If in 2000-2004 this figure rises to the North from 7.4 to 11.8 %, in Russia – from 24 to 25.9 %, in recent years it has stabilized, and after 2009 it is celebrated even decline – in the northern region with 11.4 to 9.5 % in Russia as a whole – from 23 to 20.1 %, due to the advanced increase budgetary allocations in education (figure 1).
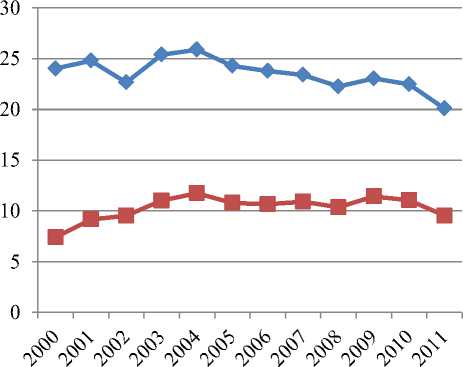
Fig. 1. The ratio of private expenditure on education to the budget in the northern regions of Russia for 2000–2011 years, %
Россия
Регионы Севера
Thus, there is no reason to talk about a substantial increase in the importance of private investment in the financing of the education system in the country.
Public Health
Paid services in the health sector in the northern regions of Russia in 2011 amounted to 22.5 billion rubles. In per capita terms their value reached nearly three thousand. As in the case of services of education, during the period in the North was accelerated relative to the average development of the private health sector, with the result that instead of the previous lag capita amount of private spending was higher than the national average. This is normal and indicates the alignment of imbalances in the regional development.
In 2000, the average per capita amount of paid medical services in non-resource areas was a quarter below average, in 2011 it exceeded the latter by 32 % (table 2). From this we can judge as the rapid growth in living standards of the northern regions and the development of a service infrastructure in the outlying areas.
Table 2
The Dynamics of the paid services in the northern regions of Russ ia i n 2000–2011 гг.2
The volume of services per capita, at current The share of services in GRP, % prices, thousand rubles
Regions Volume index, %
|
о о о CM |
о о CM |
00 о о CM |
о CM |
о о о см |
st о о см |
00 о о см |
о о см |
||
|
Russia, totally |
180,1 |
0,32 |
0,88 |
1,97 |
2,72 |
0,81 |
0,91 |
0,82 |
0,91 |
|
Northern regions, totally |
266,2 |
0,26 |
0,98 |
2,29 |
2,96 |
0,24 |
0,37 |
0,41 |
0,42 |
|
including: Republic Karelia |
251,7 |
0,22 |
0,71 |
1,81 |
3,01 |
0,56 |
0,93 |
1,08 |
1,26 |
|
Republic Komi |
213,3 |
0,24 |
1,18 |
2,30 |
3,07 |
0,42 |
0,90 |
0,76 |
0,75 |
|
Arkhangelsk region |
254,3 |
0,16 |
0,84 |
2,01 |
3,03 |
0,44 |
1,03 |
1,24 |
1,51 |
|
Nenezkiy AO |
567,1 |
0,07 |
0,23 |
1,43 |
2,39 |
0,02 |
0,02 |
0,07 |
0,06 |
|
Murmansk region |
126,6 |
0,24 |
0,92 |
2,40 |
3,09 |
0,41 |
0,64 |
0,95 |
1,05 |
|
Hanta-Mansiyskiy АО |
287,2 |
0,43 |
1,17 |
2,27 |
2,57 |
0,15 |
0,18 |
0,18 |
0,18 |
|
Yamalo Nenezkiy АО |
216,2 |
0,26 |
0,84 |
1,76 |
2,01 |
0,11 |
0,12 |
0,13 |
0,12 |
|
Yakutia Republic |
332,5 |
0,17 |
0,62 |
1,36 |
1,60 |
0,20 |
0,38 |
0,42 |
0,36 |
|
Kamchatskiy Region |
97,9 |
0,43 |
0,72 |
1,46 |
2,52 |
0,88 |
0,73 |
0,65 |
0,77 |
|
Magadanskiy region |
176,0 |
0,25 |
0,89 |
1,72 |
2,68 |
0,38 |
0,64 |
0,67 |
0,63 |
|
Sakhalinsky region |
441,3 |
0,31 |
1,87 |
6,67 |
7,72 |
0,51 |
1,09 |
1,03 |
0,72 |
|
Chykotskiy АО |
406,1 |
0,14 |
0,80 |
1,34 |
1,37 |
0,21 |
0,33 |
0,22 |
0,17 |
The share of the health services in the total amount of health care services has increased over the study period in the North with 70 to 81 %, in Russia – from 59 to 74 %, the specific weight of the same services to physical education and sports and spa accordingly reduced. A higher proportion of health services in the North due to naturally lower importance here of spa services (10 versus 17 %), while the services of Sport proportion saved (about 9 %).
The physical volume of paid services in the Nordic region for 2001-2011 years increased 2.7 times, most notably in the Nenets Autonomous Area - by 5.6 times, in the Sakhalin area - 4.6 times, in Yakutia - 3.2 times, in the Khanty-Mansi Autonomous District - 3 times in the Arkhangelsk area - 2.7 times. On average, the growth of the country during this period was much smaller and was about 2 times.
An even higher dynamics observed in the paid services of Sport: on average in the North of the physical volume increased in 12 years by 3.5 times, while in Russia only 2 times. The highest rates were recorded in Karelia - 11.5 times, in the Nenets Autonomous District and Yakutia - 6.4 times, in the Sakhalin area - 4.5 times, in the Yamal-Nenets Autonomous District - 4 times in the Khanty-Mansi Autonomous District - 3.5 times.
The volume of health and health services also increased faster rate - 1.4 times (in Russia decreased by 20 %), including the most important in the Magadan region - 6,5 times, in Karelia -2.3 times, in the Arkhangelsk region - by 1.5 times.
As a percentage of budgets funding dynamics of the paid health services was mixed. In the northern region there is much smaller proportion than the national average, due to sharply pronounced increase in per capita expenditures of the budget compared to private. Capita budget expenditures on health care here, as in education, more than twice the national average.
But if the whole country the ratio of private spending on education to state fluctuated for 2000-2011 years. in the range of 20-25 %, the regions of the North, it first increased from 7 to 15 %, due to, firstly, the faster growth of private spending amid all-Russian speakers, and secondly, a significant difference in the level of anti-aliasing of budget financing of the North and the rest of Russia, from 2.9 to 2 times3 (fig. 2).
However, in 2010-2011 due to the significantly increased public expenditure in the health sector in the whole country and its northern territories again decrease the proportion of private spending. Therefore, to speak of the exhaustion of the last building in financing health care is inappropriate.
The share of the private expenditure on health in GRP for 2000-2011 years increased in the Northern regions from 0.24 to 0.42 %, in Russia - from 0.81 to 0.91 % (see table 2). Smaller proportion in the first case due to the corresponding values in the resource regions with extremely high values of per capita GRP in other regions it is close to the average, or even exceeds it. The growth rate is associated with rapid increase in disposable income and positively assessed.
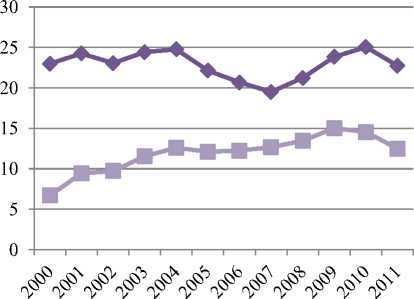
Fig. 2. The ratio of private health expenditure of the budget in the northern regions of Russia for 2000–2011 years, %
Россия
Регионы Севера
Culture
Paid services in the field of culture – the lowest specific weight component in the private financing of social systems, they account for only about 10 % of the total. In per capita terms, these services have achieved in 2011, by region of the North – 0.46 thousand rubles, Russia – 0.63 rubles. Thus, in the North of the costs in terms of money per capita were about a quarter below average, although government funding here was higher by 2.1 times. Thus, in contrast to other social systems discussed above, during the study period there were any significant changes in this ratio. However, surprisingly, in real terms, the services of cultural institutions in the North has increased in 12 years, almost half, and in the whole country, only 36 % (table 3).
This contradiction, in all probability, may be due to a significant reduction in the cost of these services in the northern regions, for example in connection with their partial government subsidies. This assumption is confirmed by the fact that most of the identified growth came in the Khanty-Mansi and Yamal-Nenets Autonomous District, which received very serious attention to the preservation of local cultures of indigenous peoples and the bet on it as an important element in the development of the region. Relatively high indices of services culture can also be seen in Yakutia (2.4 times), the Kamchatka region (1.8 times) and the Arkhangelsk region (1.6 times).
The amount of private investment in culture in the northern regions was 13 % of the budget, and in comparison with 2000, this share increased by 5 %. On average, the ratio is much higher and reaches 38 %, which is associated with a lower per capita funding of the culture of the budgets (see figure 3).
Тable 3
Dynamics of the paid services of culture in the northern regions of Russia in 2000–2011 г.4
The volume of services per capita, at current The share of services in GRP, % prices, thousand rubles
Regions Volume index, %
|
о о о CM |
о о CM |
00 о о CM |
о CM |
о о о см |
st о о см |
00 о о см |
о о см |
||
|
Russia, totally |
135,7 |
0,07 |
0,31 |
0,47 |
0,63 |
0,17 |
0,32 |
0,20 |
0,22 |
|
Northern regions, totally |
193,0 |
0,05 |
0,17 |
0,29 |
0,46 |
0,05 |
0,07 |
0,05 |
0,06 |
|
including: Republic Karelia |
69,8 |
0,06 |
0,19 |
0,27 |
0,42 |
0,15 |
0,25 |
0,16 |
0,19 |
|
Republic Komi |
83,7 |
0,03 |
0,13 |
0,21 |
0,35 |
0,05 |
0,10 |
0,07 |
0,07 |
|
Arkhangelsk region |
163,1 |
0,04 |
0,12 |
0,27 |
0,44 |
0,12 |
0,14 |
0,17 |
0,25 |
|
Nenezkiy AO |
33,2 |
0,03 |
0,09 |
0,45 |
0,22 |
0,01 |
0,01 |
0,02 |
0,00 |
|
Murmansk region |
102,5 |
0,05 |
0,19 |
0,36 |
0,40 |
0,08 |
0,14 |
0,14 |
0,13 |
|
Hanta-Mansiyskiy АО |
294,8 |
0,09 |
0,17 |
0,25 |
0,43 |
0,03 |
0,03 |
0,02 |
0,02 |
|
Yamalo Nenezkiy АО |
485,0 |
0,07 |
0,25 |
0,23 |
0,35 |
0,03 |
0,04 |
0,02 |
0,02 |
|
Yakutia Republic |
241,9 |
0,03 |
0,18 |
0,36 |
0,60 |
0,04 |
0,11 |
0,11 |
0,12 |
|
Kamchatskiy Region |
175,6 |
0,05 |
0,11 |
0,13 |
0,84 |
0,09 |
0,11 |
0,06 |
0,23 |
|
Magadanskiy region |
129,5 |
0,04 |
0,19 |
0,34 |
0,63 |
0,07 |
0,13 |
0,13 |
0,15 |
|
Sakhalinsky region |
113,4 |
0,04 |
0,31 |
0,57 |
0,61 |
0,07 |
0,18 |
0,09 |
0,06 |
|
Chykotskiy АО |
122,8 |
0,02 |
0,12 |
0,28 |
0,37 |
0,03 |
0,05 |
0,05 |
0,04 |
We note an interesting trend: up to 2004 in Russia there is a very strong increase in the proportion of private and public spending on culture - from 35 to 64%, the reason why it was obviously drastically insufficient central funding of this sphere (as a residual). Beginning in 2005, government funding of culture was significantly increased in relation to the realization of the importance of this sector in the development of society, leading to equalization proportion of public and private spending.
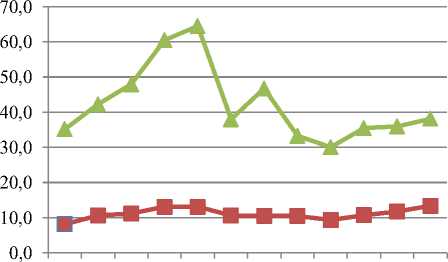
Россия
Север
Fig. 3. The ratio of private spending in the cultural sphere of the budget in the northern regions of Russia for 2000–2011 years, %
Now again there is a moderate increase in the importance of paid services, but this is less to do with the ‘failure’ of public support, and to the citizens to pay more attention to their spiritual and moral state.
Conclusions
Thus, the main features and trends in private financing of the social systems of the northern regions of Russia for the last decade are:
-
> rapid increase in the volume of services, significantly ahead of the average Russian: Health -2.7 times (in Russia – 1.8 times), education – in 2.5 times (in Russia – 2.1 times), culture – 1.9 times (in Russia – 1.4 times);
-
> rapid growth of per capita education and health services in terms of value, which allowed the northern regions lagging partly align its position from a national average of indicators;
-
> much less pronounced increase in per capita in the north of paid social services than government funding by only 7–8 %, and in the cultural sector – 25 % lower compared to more than twice higher budget spending, reflecting the less developed service infrastructure, on greater state role in the livelihood of the people in the North, as well as a significant difference between the places of income and use of services;
-
> the preservation of the basic proportions of private and public funding of social systems in education – about 10 % in the North and 25 % in Russia for some growth in the culture of extra-budgetary funding to 10 and 40 % respectively. The relatively low share of private funding cited persistent state's leading role in the functioning of social systems and at the same time showing some improvements last reserve from extra budgetary sources.
References Private expediters on the social services in the Northern regions of Russia
- Sectoral and regional characteristics of the reform of public institutions in Russia. M.: IET, 2005. P. 51.
- Statistical Yearbook of the Republic of Komi. 2011: Stat. Sat / Komistat. Syktyvkar, 2011. P. 366.
