Problems and specific features of sub-federal budgets execution in 2015

Author: Povarova Anna Ivanovna
Journal: Economic and Social Changes: Facts, Trends, Forecast @volnc-esc-en
Section: Public finance
Article in issue: 4 (46) т.9, 2016.
Free access
Last year has been marked by worrying trends in the development of a budgetary crisis in Russian regions; the crisis became apparent in 2013, when regional authorities had to get into huge debts in order to provide finances for the social obligations in the framework of the presidential decrees of May 7, 2012. The budget process in 2015 was characterized by expanding negative trends in those regions that had previously been the engines of economic growth and budget donors, which contradicts the regional development strategy. The crisis response measures consist in a large-scale optimization of expenses. Despite an attempt undertaken by the Government to replace commercial borrowings with budget loans, there are still no prospects for solving the debt issue. On the contrary, expert forecasts predict a doubling of the debt stock in regions by the end of 2017. Cuts in the expenditures on human capital development should be considered as a new negative trend, naturally resulting in the deterioration of material well-being of Russians, which was expressed in the decline in their real incomes and raising poverty level...
Region, budget, deficit, loans, public debt, adjustment of fiscal policy
Short address: https://sciup.org/147223852
IDR: 147223852 | UDC: 336.146 | DOI: 10.15838/esc.2016.4.46.8
Text of the scientific article Problems and specific features of sub-federal budgets execution in 2015
Execution of territorial budgets in 2015 was carried out under the structural crisis of the Russian economy, which contributed to the negative dynamics of major macroeconomic indicators (Fig. 1) .
A radical drop, amounting to 8.4%, affected investments in fixed assets. The investments declined in two thirds of the regions, with a stronger downturn affecting the major industrial centers in the Volga, Siberian and Ural federal districts. In 40% of the regions, the decrease in investment activity is observed for two consecutive years, which indicates the long-term nature of the investment crisis, complicating the solution of the problem of import substitution.
Figure 1. Growth rate dynamics of GDP, industrial production and investment in 2011–2015, % to the previous year in comparable prices
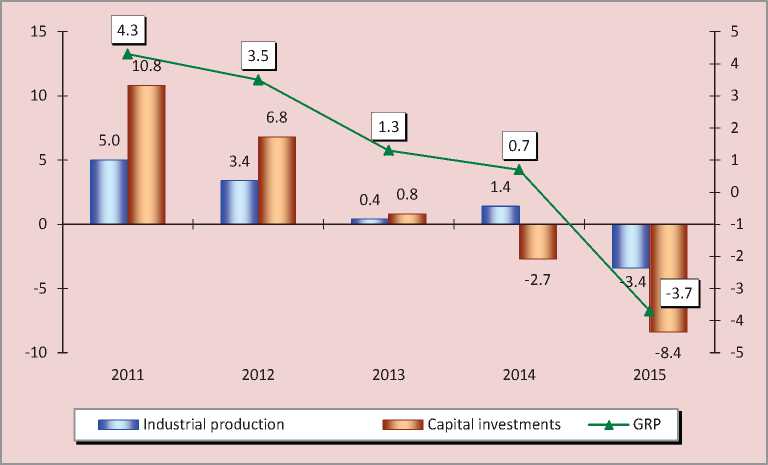
Source: Federal State Statistics Service (Rosstat).
Reduction in the level of Russians’ welfare and consumption is no less acute. Stagnation of people’s real incomes that began in 2013 was replaced by their 0.8% decrease in 2014, which accelerated in 2015 to 4.3% (Fig. 2) . Only seven Russian regions were not affected by this process. Simultaneously there was a decrease in retail turnover and increase in people’s savings in banks, which essentially meant the transition from the consumer to the savings behavior model, which in the future may serve as an additional deterrent to economic growth because it reduces demand further.
The budget process in 2015 was characterized by the following features.
1. Stagnation in the growth of Russia’s consolidated budget revenues and decline in growth of federal budget incomes – both caused by a shortfall of oil revenues as a result of the downfall in global oil prices (Tab. 1).
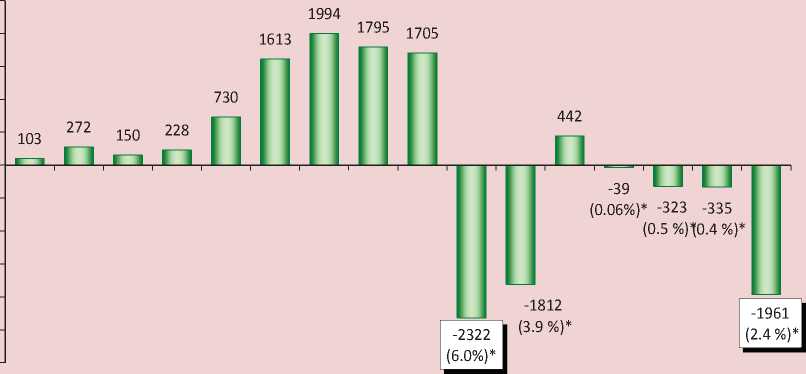
The Ministry of Finance estimates that the balance of the federal budget is reached at an oil price of 82 U.S. dollars per barrel; that is why the lack of structural adjustment of the Treasury to the new market realities resulted in rising deficit, which reached two trillion rubles or 2.4% relative to GDP. The federal budget was executed with a large volume of deficit only in 2009 (Fig. 3) .
A pronounced escalation of disbalancing processes at the highest level of the country’s budgetary system poses extremely high risks for territorial budgets, primarily from the
Figure 2. Dynamics of real money incomes of the population, retail turnover and bank deposits in 2011–2015, % to the previous year in comparable prices*
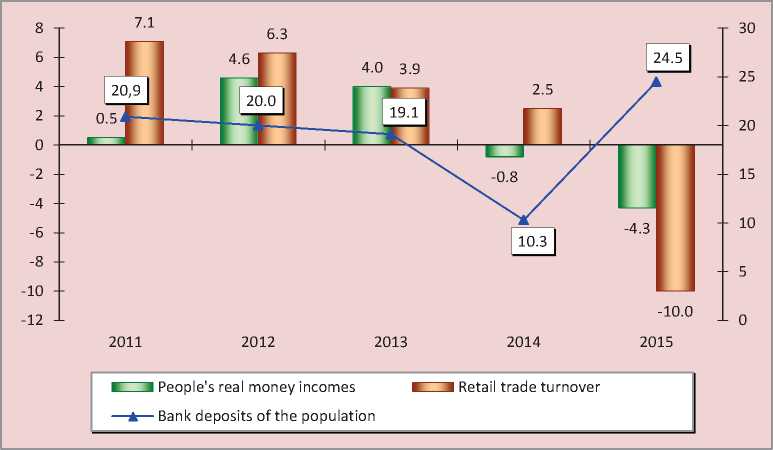
* Bank deposits are given in current prices.
Sources: Rosstat; the Bank of Russia; author’s calculations.
Table 1. Revenues of the consolidated and federal budget of the Russian Federation in 2011–2015, billion rubles
|
Revenues |
2011 |
2012 |
2013 |
2014 |
2015 |
|
World oil price, U.S. dollars/barrel |
109 |
110 |
108 |
98 |
53 |
|
Growth rate, % |
139.7 |
100.9 |
98.2 |
90.7 |
54.1 |
|
Consolidated budget revenues |
20855 |
23435 |
24443 |
26766 |
26922 |
|
Growth rate, % |
130.1 |
112.4 |
104.3 |
109.5 |
100.6 |
|
Federal budget revenues |
11368 |
12856 |
13020 |
14497 |
13659 |
|
Growth rate, % |
136.9 |
113.1 |
101.3 |
111.3 |
94.2 |
|
Including oil and gas revenues |
5642 |
6453 |
6534 |
7434 |
5892 |
|
Growth rate, % |
142.3 |
114.4 |
101.3 |
113.8 |
79.3 |
|
Sources: Federal Treasury data; author’s calculations. |
Figure 3. Dynamics of the surplus, deficit (-) of the federal budget in 2000–2015, billion rubles
-500
-1000
-1500
-2000
-2500
-3000
2000 2001 2002 2003 2004 2005 2006 2007 2008 2009 2010 2011 2012 2013 2014 2015
* The ratio of deficit to GDP is given in parentheses. Sources: Federal Treasury data; author’s calculations.
viewpoint of sufficient financial provision of the powers of the federal center that were transferred to the regions.
2. The decrease in the revenues of consolidated budgets of RF subjects by 5.7%
in real terms in all the main components (Tab. 2) . In addition to the slump in economic activity, revenue growth dynamics was inevitably affected by the maximum level of inflation since 2008 that amounted to 12.9%.
’Table 2. Revenues of consolidated budgets of subjects of the Russian Federation* in 2011–2015, billion rubles
|
Revenues |
2011 |
2012 |
2013 |
2014 |
2015 |
2015 to 2014, % |
|
Revenues, total |
7644 |
8064 |
8165 |
8747 |
9191 |
105.1 |
|
In real terms |
9983 |
10040 |
9626 |
9744 |
9191 |
94.3 |
|
Own revenues** |
5827 |
6385 |
6588 |
7143 |
7585.5 |
106.2 |
|
In real terms |
7610 |
7949 |
7767 |
7957 |
7585 |
95.3 |
|
- profit tax |
1928 |
1980 |
1720 |
1962 |
2099 |
107.0 |
|
In real terms |
2518 |
2465 |
2028 |
2185 |
2099 |
96.1 |
|
- individual income tax |
1996 |
2262 |
2499 |
2681 |
2788 |
104.0 |
|
In real terms |
2607 |
2816 |
2946 |
2986 |
2788 |
93.4 |
|
Inter-budget transfers |
1644 |
1680 |
1515 |
1546 |
1538 |
99.5 |
|
In real terms |
2147 |
2091 |
1786 |
1722 |
1538 |
89.3 |
* Hereinafter, to ensure the comparability of the dynamics, all the indicators for 2014–2015 are given excluding the entities of the Crimean Federal District.
** Tax and non-tax revenues of the budget.
Sources: Federal Treasury data; Rosstat data; author’s calculations.
Table 3. Own revenues in the consolidated budgets of the subjects of the Russian Federation in 2008–2015, million rubles (prices of 2015)
|
Subject |
2008 |
2009 |
2010 |
2011 |
2012 |
2013 |
2014 |
2015 |
2015 to 2008, % |
|
Novosibirsk oblast |
113.7 |
95.3 |
106.2 |
116.2 |
128.3 |
127.6 |
121.8 |
112.9 |
99.3 |
|
Republic of Bashkortostan |
156.6 |
130.9 |
132.6 |
139.1 |
146.9 |
148.0 |
147.9 |
143.9 |
91.9 |
|
Chelyabinsk Oblast |
143.4 |
88.0 |
119.1 |
124.4 |
128.9 |
126.4 |
128.9 |
127.8 |
89.1 |
|
Nizhny Novgorod Oblast |
145.6 |
112.8 |
124.5 |
132.6 |
135.9 |
140.7 |
138.1 |
129.2 |
88.7 |
|
Saint Petersburg |
477.5 |
373.0 |
403.6 |
432.3 |
420.1 |
447.4 |
455.2 |
423.3 |
88.6 |
|
Samara Oblast |
152.9 |
117.4 |
129.6 |
146.2 |
159.3 |
157.1 |
154.7 |
134.2 |
87.8 |
|
Sverdlovsk Oblast |
227.7 |
164.2 |
193.2 |
212.7 |
230.4 |
220.3 |
209.5 |
199.7 |
87.7 |
|
Moscow |
2034.3 |
1450.1 |
1527.9 |
1738.4 |
1762.7 |
1699.4 |
1696.2 |
1598.2 |
78.6 |
|
Perm Krai |
152.1 |
105.0 |
114.4 |
123.8 |
128.0 |
125.1 |
112.1 |
106.9 |
70.3 |
|
Kemerovo Oblast |
157.5 |
104.3 |
127.4 |
148.8 |
132.8 |
115.4 |
118.1 |
108.5 |
68.9 |
|
Tyumen Oblast |
236.5 |
167.2 |
140.3 |
184.9 |
181.6 |
130.2 |
166.9 |
143.7 |
60.8 |
|
Total |
3997.8 |
2908.2 |
3118.8 |
3499.4 |
3554.9 |
3437.6 |
3449.4 |
3228.3 |
80.8 |
|
Share, %* |
50.4 |
46.2 |
44.9 |
46.0 |
44.7 |
44.3 |
43.3 |
42.6 |
-7.8 p.p. |
|
Russian Federation |
7935.9 |
6290.9 |
6942.0 |
7610.5 |
7949.0 |
7767.4 |
7957.4 |
7585.5 |
95.6 |
|
* The share in the total volume of own revenues of consolidated budgets of RF subjects. Sources: Federal Treasury data; Rosstat data; author’s calculations. |
|||||||||
Figure 4. Dynamics of growth of profit tax received by the budgets of RF subjects in 2011–2015, % to the previous year
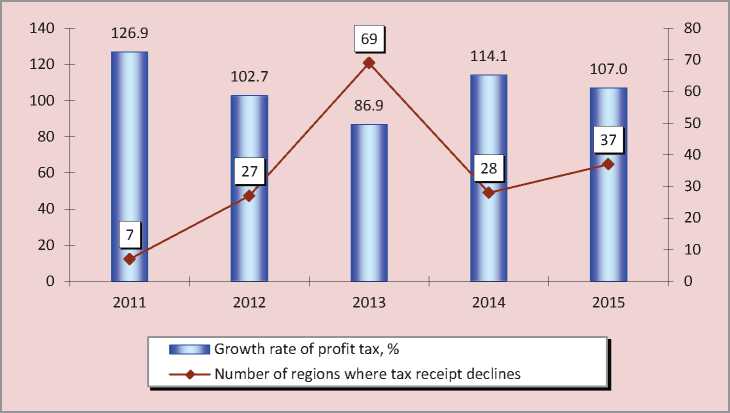
Sources: Federal Treasury data; author’s calculations.
Table 4. Receipts of profit tax to the budgets of Russian Federation subjects in 2011 and 2015, billion rubles
|
Subject |
2011 |
2015 |
2015 к 2011, % |
Received from CTG in 2015 |
|||
|
Billion rubles |
Share, %* |
Billion rubles |
Share, %* |
Billion rubles |
Share, %** |
||
|
Krasnoyarsk Krai |
69.0 |
44.5 |
66.5 |
36.5 |
96.4 |
26.0 |
39.1 |
|
Sverdlovsk Oblast |
47.3 |
29.2 |
45.6 |
22.8 |
96.4 |
9.1 |
19.9 |
|
Samara Oblast |
36.2 |
31.9 |
34.8 |
25.9 |
96.1 |
1.3 |
3.9 |
|
Perm Krai |
34.0 |
35.9 |
32.4 |
30.3 |
95.3 |
4.5 |
13.8 |
|
Irkutsk Oblast |
30.1 |
33.9 |
28.6 |
26.8 |
95.0 |
0.7 |
2.5 |
|
Moscow |
566.9 |
42.9 |
484.7 |
30.3 |
85.5 |
30.7 |
6.3 |
|
Tyumen Oblast |
108.6 |
73.4 |
89.3 |
62.1 |
82.2 |
38.6 |
43.2 |
|
Kemerovo Oblast |
35.9 |
32.0 |
23.1 |
21.3 |
64.3 |
1.7 |
7.5 |
|
Yamalo-Nenets Autonomous Okrug |
47.1 |
39.8 |
28.1 |
21.0 |
59.7 |
12.1 |
43.1 |
|
Vologda Oblast |
12.0 |
30.0 |
6.5 |
13.8 |
54.5 |
1.4 |
20.9 |
|
Belgorod Oblast |
25.6 |
42.6 |
11.5 |
19.0 |
44.9 |
2 |
17.8 |
|
Russian Federation |
1927.9 |
33.1 |
2099.3 |
27.7 |
108.9 |
381.8 |
18.2 |
* The share in the total volume of own revenues of consolidated budgets of RF subjects.
** The share in the total volume of profit tax.
Sources: Federal Tax Service data; Federal Treasury data; author’s calculations.
In 2015, there remained a downward trend in own revenues in the regions that have the largest budgets; as a result, these regions were unable to retain revenues from their own sources at the level of 2008 (Tab. 3) .
Due to the narrowing of the revenue base, the share of eleven budget-forming regions in the total volume of territorial budgets’ own revenues decreased from 50.4% in 2008 to 42.6% in 2015. This may not only entail threats to the stable replenishment of the budget, but also demobilize the sources of modernization of Russia’s economy.
3. The resumption of the trend of slowing down the growth of profit tax collection that was suspended in 2014 and reduction in the number of regions in which there was a decline in the receipts of payments (Fig. 4) . At the end of 2015, the growth of profit tax reduced on average
by half in 45% of Russian Federation subjects.
It is important to emphasize that the loss of profit tax affected most seriously the budgets of major industrial regions: in 2015 the receipts of the payments even at current prices did not reach the level of 2011 (Tab. 4) .
A procedure introduced in 2012 that allowed profit tax to be payed in the framework of the consolidated taxpayer group (CTG) became a significant factor that led to a pronounced reduction in the collection of this tax. This procedure allowed for the offset of profits and losses of the group members. In general, the share of CGT in the total amount of profit tax collected in 2015 was 20%. It is possible to distinguish only a few regions where CTG plays a significant role in the mobilization of tax payments: the Tyumen Oblast, Yamalo-Nenets Autonomous Okrug
and Krasnoyarsk Krai. However, even in these regions the overall profit tax receipts declined both in absolute and specific terms after the introduction of consolidated taxation.
We agree with the conclusion of Doctor of Economics L.N. Lykova who points out that the institution of CTG reduces the already low capacity of RF constituent entities to form their own tax policy [5].
-
4. A significant reduction in the rate of growth of the key revenue of regional budgets – individual income tax – that occurred simultaneously with the decline in real wages that was the most profound one after 1999 (Fig. 5) .
-
5. The tightening of intergovernmental policy of the federal center. Unlike the 2008–2009 crisis distinguished by a significant increase in the amount of financial assistance provided to territories, this amount remained unchanged in 2013–2015 (Fig. 6) .
Figure 5. Dynamics of growth rate of real wages and receipts of real individual income tax* to the budgets of Russian Federation subjects in 1999-2015, % to the previous year
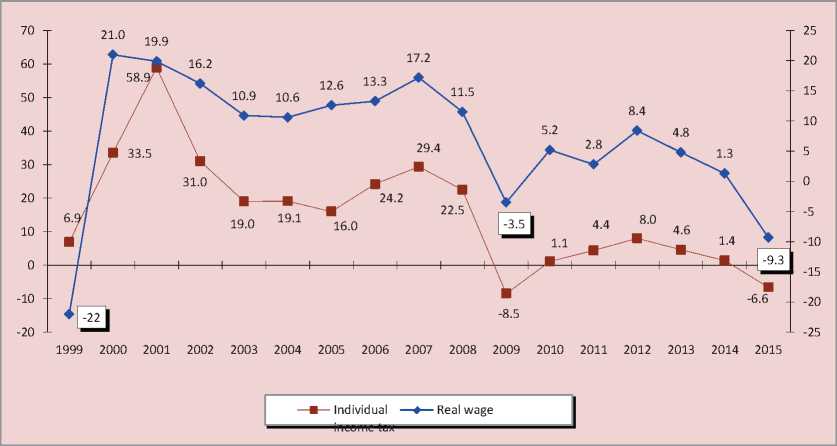
* In the prices of 2015
Sources: Federal Treasury; Rosstat; author’s calculations.
Figure 6. Dynamics of the inter-budget transfers received by the budgets of Russian Federation subjects in 2007–2015
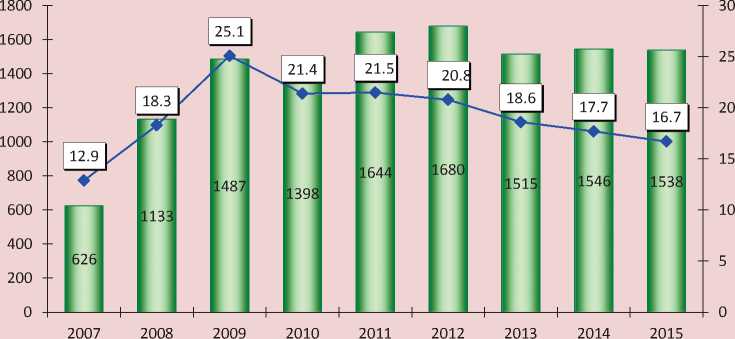
■ ■ Billion rubles — ♦ —Share in the budget revenues, %
Sources: Federal Treasury data; author’s calculations.
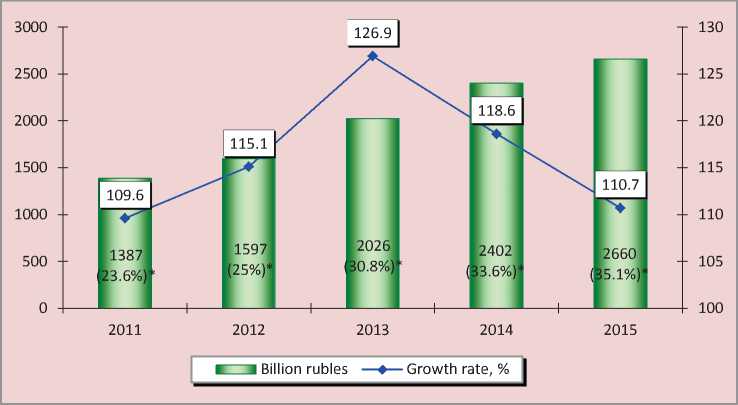
In 2015, the Ministry of Finance continued to pursue a policy of gradual replacement of non-repayable funding of regions with debt funding that it started a year earlier; the proportion of budget loans in the total amount of financial assistance reached almost 50% (Fig. 7) .
-
6. A slowdown in the growth rate of state and municipal debt along with increasing the absolute amount of debt and debt burden1 of territorial budgets ( Fig. 9) .
Figure 7. Composition of financial assistance received by Russian Federation subjects from the federal budget in 2011–2015, billion rubles
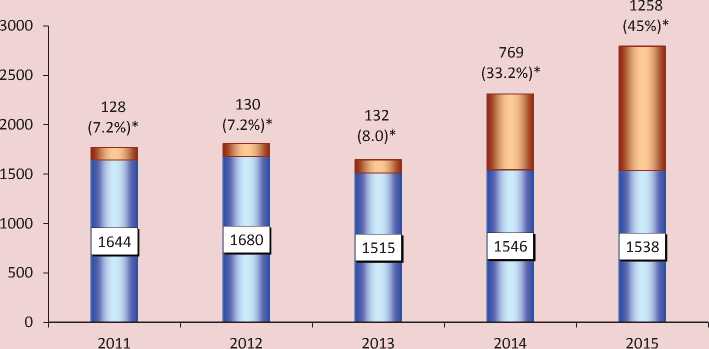
□ Interbudgetarytransfers О Loans
Deterioration of people’s financial situation resulted in a sharp increase in the number of Russian Federation constituent entities that had a negative trend of individual income tax in 2015: their number reached 23, while in 2014 there were only two of such regions.
Negative trends observed in the dynamics of mobilization of major taxes prove the aggravation of problems in the economy of regions and the presence of serious threats to the stable receipts of revenues from own sources.
Large-scale loans from the federal budget became an impetus that increased the overall debt load of regions. In 2015, the number of RF subjects in whose budgets the commercial and budget loans exceed own revenues increased to 18 (Fig. 8). Among federal districts, a high debt load was observed in the constituent entities of the North Caucasian (134.4%), Siberian (69.3%) and Volga (60.8%) federal districts.
In the conditions of insufficient own resources of regional budgets the focus of inter-budgetary policy on repayable funding is not justified. In addition, such a policy will increase the dependence of almost all the constituent entities on the federal center.
* The figure in parentheses is the share of loans in the amount of financial aid. Sources: Federal Treasury data; author’s calculations.
Figure 8. Dynamics of bank and budget loans obtained by Russian Federation subjects in 2014–2015, billion rubles
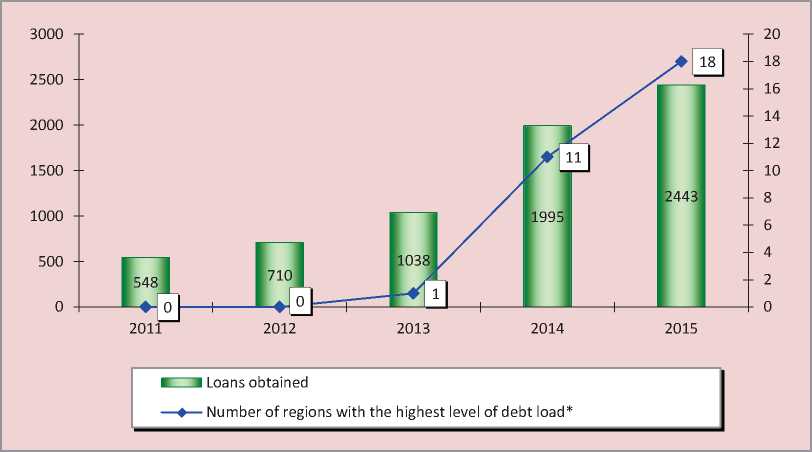
* The volume of loans is more than 100% of the budget’s own revenues. Sources: Federal Treasury; author’s calculations.
Figure 9. Dynamics of state and municipal debt of Russian Federation subjects in 2011–2015
* The figure in parentheses shows the debt burden of budgets.
Sources: Ministry of Finance of the Russian Federation; Federal Treasury; author’s calculations.
The number of regions with the level of debt burden exceeding 50% increased to 54 in 2015 vs. 15 in 2011. For the first time it affected federal budget donors such as the Samara, Novosibirsk and Tomsk oblasts, and Krasnoyarsk Krai. Consequently, the debt crisis is gradually affecting the areas that used to have a strong economy; this fact threatened to destabilize the entire budgetary system in the country.
The situation is particularly alarming with regard to the debt of regional budgets, which account for 90% of the consolidated sub-federal debt. At the beginning of 2016, fourteen regions had a critical level of debt burden that exceeded 100% of own revenues of the budget (Tab. 5).
It should be noted that the structure of debt obligations is substantially different in these subjects of the Russian Federation. The debt structure in half of the regions is mainly represented by debt to commercial banks, which further exacerbates debt burden from the viewpoint of the cost of loan servicing. The debt structure of the other half of the regions is dominated by publicly funded loans, which of course puts them in more favorable conditions2 and shows that the mechanism for the allocation of funds between the territories is non-transparent.
Table 5. Russian Federation subjects that had a critical level of debt burden in 2011, 2014, and 2015
|
Subject |
2011 |
2014 |
2015 |
Share of bank loans, % |
Share of budget loans, % |
|||
|
Billion rubles |
%* |
Billion rubles |
%* |
Billion rubles |
%* |
|||
|
Republic of Mordovia |
19.8 |
175.2 |
28.6 |
121.1 |
36.0 |
182.5 |
28.7 |
52.5 |
|
Kostroma Oblast |
9.0 |
96.9 |
15.9 |
121.1 |
17.7 |
136.7 |
42.1 |
42.6 |
|
Smolensk Oblast |
11.7 |
70.3 |
25.2 |
115.6 |
30.4 |
121.4 |
38.1 |
54.5 |
|
Republic of Karelia |
8.0 |
43.8 |
19.0 |
119.3 |
21.3 |
119.6 |
35.8 |
42.4 |
|
Republic of North Ossetia |
6.4 |
118.4 |
8.6 |
114.9 |
9.1 |
119.1 |
9.2 |
90.0 |
|
Republic of Khakassia |
3.9 |
38.3 |
10.9 |
85.7 |
16.7 |
116.8 |
34.3 |
19.9 |
|
Republic of Ingushetia |
0.06 |
2.6 |
2.7 |
113.0 |
3.2 |
113.3 |
0 |
100.0 |
|
Astrakhan Oblast |
14.8 |
98.7 |
24.6 |
100.8 |
26.1 |
111.4 |
57.3 |
42.7 |
|
Jewish Autonomous Oblast |
0.8 |
31.6 |
3.2 |
73.2 |
4.5 |
109.5 |
55.8 |
44.1 |
|
Zabaykalsky Krai |
6.3 |
30.6 |
20.0 |
87.9 |
26.5 |
107.2 |
59.4 |
39.4 |
|
Republic of Mari El |
5.9 |
69.2 |
10.8 |
95.0 |
13.1 |
106.1 |
63.9 |
26.5 |
|
Saratov Oblast |
30.5 |
78.1 |
47.7 |
99.7 |
50.4 |
101.5 |
52.1 |
47.9 |
|
Chukotka Autonomous Okrug |
2.3 |
21.7 |
13.1 |
144.5 |
14.1 |
100.9 |
0 |
85.3 |
|
Pskov Oblast |
4.7 |
43.5 |
11.9 |
88.2 |
13.3 |
100.7 |
56.9 |
38.5 |
|
Russian Federation |
1171.8 |
25.1 |
2089.5 |
35.4 |
2318.6 |
36.5 |
41.6 |
34.9 |
|
Number of regions with the level of debt load exceeding 100% |
2 |
10 |
14 |
|||||
* Debt load.
Sources: Finance Ministry data; Federal Treasury data; author’s calculations.
Figure 10. Structure of public debt of Russian Federation subjects in 2011–2015, %
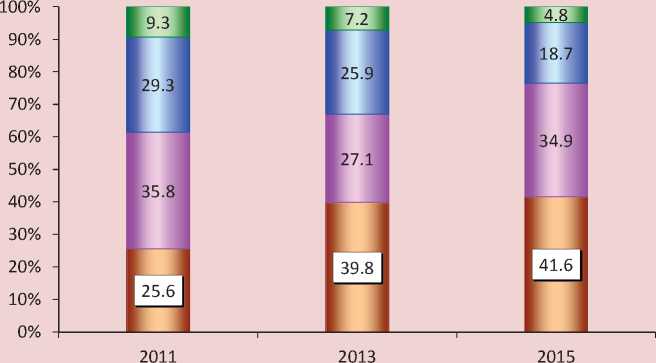
□ Bank loans □ Budget loans □ Securities □ State guarantees
Sources: Ministry of Finance data; author’s calculations.
Unfortunately, the allocation of federal loans has not helped solve the problem of extensive market borrowing, the share of which in the structure of public debt reached 42% (Fig. 10) .
Equally disturbing is the continuous rise in expenditures of territorial budgets allocated to the repayment and servicing of loans. These costs have exceeded the half of own revenues in 43% of the regions, and the entire volume of own revenues – in 22% of the regions3. It means that in order to implement expenditure obligations unconditionally regional authorities will be forced to undertake new borrowings to pay off the old ones, which will inevitably lead to an increase in the debt burden.
-
7. A more pronounced trend of slowdown in the growth rate of expenses of sub-federal budgets to 1.6% in 2015 vs. 4.6% in 2014 (Tab. 6) . The main factor was optimization of social costs and further cuts of budgetary investments and expenses on housing and utilities.
Accelerating optimization of the social sphere has become a characteristic feature of 2015. Earlier, when choosing capital investment and housing and utilities as balancing items, regional authorities did not consider the social sphere that concerned the interests of the majority of citizens. However, by 2015, sources of optimization have been almost exhausted, except for the
Table 6. Dynamics of expenses of budgets of Russian Federation subjects in 2011–2015, billion rubles
Speaking about the priorities of budget expenditures, it is appropriate to recall the warning of Academician Yevgeny Primakov, who said that “without financial breakthrough in the provision of healthcare, education and science, the country will have no modernization” [14].
A no less important issue in the eyes of Russians is the housing and utilities sector, because the state of many life-supporting systems depends on its funding. Meanwhile, from 2011 to 2015, cuts in budget funding of this industry were the most noticeable and amounted to 120 billion rubles, or more than 12%. For this period, two-thirds of the regions have reduced support for the housing and utilities sector, and this process was the most intensive in the major economic regions (Tab. 8).
The policy of optimization of sub-federal budgets’ expenses increases the risk of deterioration of the quality of life of Russians: the underfunding of the social sector reduces the availability of public services for the population and increases the level of poverty4; significant limitation of assistance to the housing and utilities sector can lead to an increase in the tariffs for housing and utilities services5.
Table 7. Education expenses of the budgets of Russian Federation subjects in 2014–2015, billion rubles
|
Subject |
2014 |
2014 to 2013, % |
2015 |
2015 to 2014, % |
Debt load, % |
|
Volgograd Oblast |
31.0 |
115.8 |
29.98 |
96.7 |
73.3 |
|
Moscow |
266.23 |
95.3 |
250.85 |
94.2 |
8.8 |
|
Khabarovsk Krai |
30.16 |
99.6 |
28.37 |
94.1 |
45.8 |
|
Republic of Dagestan |
33.86 |
96.7 |
31.83 |
93.8 |
65.4 |
|
Irkutsk Oblast |
46.97 |
102.0 |
43.85 |
93.4 |
23.2 |
|
Kemerovo Oblast |
45.29 |
108.4 |
42.2 |
93.2 |
61.2 |
|
Republic of Kalmykia |
3.84 |
99.3 |
3.56 |
92.8 |
63.9 |
|
Arkhangelsk Oblast |
26.92 |
105.5 |
24.93 |
92.6 |
69.4 |
|
Tyumen Oblast |
28.27 |
88.4 |
26.16 |
92.5 |
0.9 |
|
Altai Krai |
26.85 |
103.3 |
24.71 |
92.0 |
8.1 |
|
Omsk Oblast |
25.33 |
106.5 |
23.16 |
91.4 |
75.2 |
|
Vologda Oblast |
17.47 |
104.3 |
15.89 |
91.0 |
78.2 |
|
Republic of Tatarstan |
75.0 |
125.0 |
67.7 |
90.3 |
58.3 |
|
Sources: Federal Treasury data; aut |
hor’s calculations. |
Table 8. Housing and utilities expenses of the budgets of Russian Federation subjects in 2011–2015, billion rubles
|
Subject |
2011 |
2012 |
2013 |
2014 |
2015 |
2015 to 2011, % |
|
Kemerovo Oblast |
23.4 |
18.5 |
17.1 |
19.5 |
17.9 |
76.5 |
|
Rostov Oblast |
18.0 |
11.8 |
12.2 |
13.6 |
11.6 |
64.4 |
|
Perm Krai |
9.5 |
6.9 |
6.9 |
6.5 |
6.0 |
63.2 |
|
Novosibirsk Oblast |
15.5 |
10.7 |
14.0 |
11.8 |
9.7 |
62.6 |
|
Yamalo-Nenets Autonomous Okrug |
33.4 |
33.4 |
34.6 |
34.4 |
19.8 |
59.3 |
|
Nizhny Novgorod Oblast |
13.0 |
8.2 |
7.4 |
8.7 |
7.6 |
58.4 |
|
Vologda Oblast |
5.6 |
3.0 |
2.2 |
1.9 |
2.9 |
51.8 |
|
Primorsky Krai |
16.3 |
14.3 |
10.1 |
8.4 |
7.7 |
47.2 |
|
Stavropol Krai |
7.0 |
6.2 |
8.1 |
4.0 |
3.1 |
44.3 |
|
Tyumen Oblast |
18.9 |
14.1 |
10.7 |
10.4 |
8.1 |
42.8 |
|
Chelyabinsk Oblast |
17.4 |
8.6 |
8.8 |
8.4 |
7.4 |
42.5 |
|
Belgorod Oblast |
8.8 |
5.9 |
3.8 |
3.5 |
2.9 |
33.6 |
|
Krasnodar Krai |
45.5 |
32.0 |
28.1 |
20.3 |
14.5 |
31.9 |
|
Russian Federation |
968.7 |
881.2 |
901.9 |
900.6 |
849.4 |
87.7 |
|
Sources: Federal Treasury data; author’s calculations. |
||||||
-
8. An unprecedented reduction in public funding.
-
9. The number of regions that have budget imbalance is not reducing.
As already mentioned, after the social obligations under the “May decrees” were transferred to the regional level, the capital expenditure item has been the first to experience the blow of sequestration. Since 2012 there has been a continuing downward trend in public funding. In 2013–2015, the volume of capital investments of territorial budgets was below the level of 2007, and their share in the total expenditures decreased from 23 to 10% (Fig. 11).
Public investment in some regions reduced by 25–65% (Tab. 9) , which significantly exceeded the national average value; moreover, the geography of these regions deserves attention: all of them are large industrial or agricultural centers. At the same time, it is difficult to give objective reasons for the policy of curtailing capital investment by the authorities of federal cities and of the Tyumen Oblast, which have surplus budgets and minimal debt burden.
Of course, the reduction in budget investment will impede the creation of long- term prerequisites for the restoration of economic growth. It is quite natural that in 2014–2015, due to the lack of necessary public investment, the number of regions which experienced a decline in the growth rate of their manufacturing industry increased from 23 to 42. We add that the negative impact of savings on the development budget was acknowledged by the Minister of Finance, who made the following statement: “Switching from investment spending to current spending, the economy inevitably sacrifices its future growth” [1].
In 2015, seventy-six subjects of the Russian Federation executed their budgets
Figure 11. Dynamics of capital expenditures of the budgets of Russian Federation subjects in 2007–2015
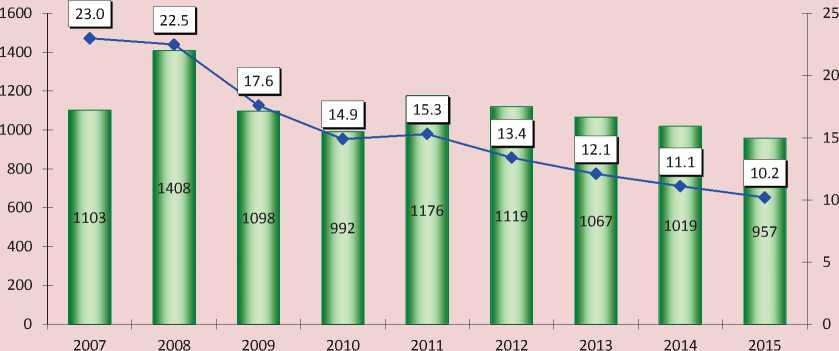
■ ■ Billion rubles — ♦ —Share in budget expenses, %
Sources: Federal Treasury data; author’s calculations.
Table 9. Capital investments expenses of the budgets of Russian Federation subjects in 2011 and 2015
The imbalance of economically strong regions was increasing faster than that of others due to the fact that in 2011 they had a minimum level of deficit77 (Tab. 10) . At the end of 2015, the deficit in these regions increased in 3–7 times, which is significantly higher than the national average.
The unprofitability of territorial budgets in recent years is commonly explained by the increased social burden after the adoption of the “May decrees”. In our opinion, the real causes of imbalance lie not so much in the need to implement the tasks set out by the President, but in the inadequacy of the fiscal policy pursued by the Government of the Russian Federation. In the course of the reform of intergovernmental relations in the beginning of the 2000s, 35% of the revenue sources were withdrawn from regional budgets and centralized in the federal budget with the simultaneous transfer of the main part of social infrastructure funding. As a result, unlike the federal budget, territorial budgets in 2000–2009 were deficit-ridden. During the years of reforms the share of revenues of RF subjects in the country’s consolidated budget decreased from 56 to 40% (Tab. 11).
Figure 12. Changes in the net deficit of the budgets of Russian Federation subjects in 2011–2015
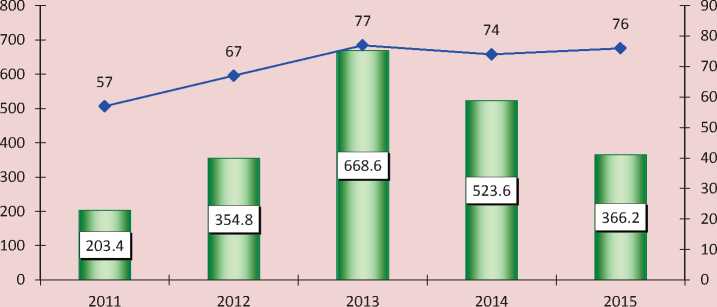
■ ■ Net deficit, billion rubles — ♦ — Number of regions with deficit
Source: author’s calculations based on Federal Treasury data.
Table 10. Deficit of the budgets of Russian Federation subjects in 2011 and 2015
|
Subject |
2011 |
2015 |
2015 to 2011, times |
||
|
Billion rubles |
To own revenues, % |
Billion rubles |
To own revenues, % |
||
|
Perm Krai |
0 |
0 |
-6,0 |
-5,6 |
х |
|
Irkutsk Oblast |
0 |
0 |
-9.9 |
-9.3 |
х |
|
Novosibirsk Oblast |
-1.9 |
-2.1 |
-13.2 |
-11.7 |
6.9 |
|
Republic of Komi |
-1.3 |
-2.6 |
-8.7 |
-14.3 |
6.7 |
|
Krasnoyarsk Krai |
-4.5 |
-2.9 |
-21.1 |
-11.6 |
4.7 |
|
Orenburg Oblast |
-1.0 |
-1.8 |
-4.5 |
-6.0 |
4.5 |
|
Rostov Oblast |
-3.3 |
-3.5 |
-14.6 |
-11.0 |
4.4 |
|
Kaluga Oblast |
-2.5 |
-7.2 |
-7.3 |
-15.9 |
2.9 |
|
Kemerovo Oblast |
-3.2 |
-2.9 |
-8.9 |
-8.2 |
2.8 |
|
Russian Federation |
-203.4 |
-6.5 |
-366.2 |
-7.7 |
1.8 |
|
Sources: Federal Treasury data; author’s calculations. |
|||||
Actual data confirm that the centralization of revenues that does not meet fundamental principles of budget federalism has become an obstacle to regional development, a decisive factor in the undue reduction in the number of self-sufficient regions and a high degree of their dependence on central government. However, the RF Government does not want to admit it and openly declares that “...the demarcation of tax sources between the federal center and regions generally corresponds to the modern stage
Table 11. Surplus and deficit of budgets of different levels in 1998–2015, billion rubles
The results of the analysis allow us to conclude that budget crisis has affected almost all Russian regions, except for the federal cities, oil and gas regions of the Ural Federal District, and the Sakhalin Oblast that receives enormous flows of profit tax due to the implementation of projects in the framework of agreements on production sharing, and, in varying degrees, several heavily subsidized constituent entities of the North Caucasian and Far Eastern federal districts. Nevertheless, these areas already experience negative trends in certain budget parameters.
The forecasts for 2016 do not contain any signs of recovery of regional finances. The reduction in rental income will limit the ability of the federal budget to increase the transfer assistance to Russian Federation subjects. According to the Finance Ministry, in January–May 2016, the deficit of the Federal Treasury increased by 42% compared to the same period of the previous year and amounted to 1.5 trillion rubles or 4.6% of GDP [13]. Thus, it is highly probable that the goal of limiting the deficit to 3% of GDP, which was set out by the President of the Russian Federation [16], will not be achieved. Federal loans will not solve the debt issue in regions. Expert estimates show that by 2018, the debt load of constituent entities of the Russian Federation may reach 50% in the volume of the budget’s own revenues [3], which will serve as the main factor constraining investment activity in the majority of areas, and ultimately can undermine the confidence of potential investors to the macroeconomic policy pursued by Russian authorities.
It is necessary to understand that technically simple adjustments to the budget in the form of sequestration or cheap budget loans are temporary measures that do not help overcome the crisis of regional finance. We need system-wide solutions, and making an inventory of revenue and expenditure powers of the federation and its subjects should be a priority among them. The ultimate result of this inventory will be redistribution of budget flows, which should aim to achieve financial sufficiency of RF subjects.
Are there specific reserves to increase replenishment of Russia’s budget, turning it into a real, rather than a declared, source of modernization of the Russian economy? The results of many years of research conducted by ISEDT RAS on the issues of formation and execution of budgets at all levels [4, 11, 12,] prove that such reserves do exist. The key ones relate to legislative adjustments to the Tax and Budget codes, in particular: revision of the procedure of administration of the profits of large corporations with the abolition of several unjustified tax privileges; introduction of progressive taxation of incomes of physical persons; restoration of governmental regulation of exchange activities with the introduction of cross-border transactions tax; abolition of large-scale benefits and exemptions on value added tax, and on oil and gas payments.
Our calculations show that with the implementation of these measures it would be possible to achieve additional annual receipts of revenues sources to the national treasury in the amount of more than 15 trillion rubles. This would redistribute a significant part of funds in the form of taxes or transfers in regions’ favor.
Budget issues could be solved with the help of impressive unused balances of the federal budget, which, according to the
Federal Treasury report, amounted to 10 trillion rubles at the beginning of 2016.
Due to the fact that budgetary funds managers have a low responsibility in effective expenditure management at the federal and regional level, it is impossible to stop negative processes of growing accounts receivable of budgets. According to our calculations, in 2015, the total volume of receivables increased by a third and reached almost eight trillion rubles, including one trillion rubles in territorial budgets. These funds should also be considered as additional sources of financing budget expenditures.
Despite numerous appeals of regional authorities, Russian Government still has not solved the issue of letting regional budgets retain the unused balances of subsidies and subventions that are not developed due to their untimely transfer from the federal budget and that are subject to refund under current legislation. For this reason, regions annually lose from 20 to 45 billion rubles of revenue.
The reserves stated above should be supplemented by the adoption of measures to eliminate arrears to the budget; taking into consideration its amount accumulated at the beginning of 2016, this would help replenish the revenues of territorial budgets by 420 billion rubles, or 6%. Regional and local payments account for about 60% of the total amount of overdue liabilities, which indicates an insufficient level of activity of regional authorities in their work with taxpayers.
It should be mentioned that when carrying out the optimization that affected almost all the vital areas of spending, regional officials do not hesitate to increase administrative costs every year. According to our estimates, in 2015, management costs increased in 50 regions; this indicates that there is potential for reducing these costs.
Due to a complicated situation with regard to the prospects of possible solutions to debt issues in constituent entities of the Russian Federation8, it is expedient, in our view, to consider the possibility of writing off part of regions’ debts. Otherwise, the federal center will be forced to issue new loans to repay those already taken.
The growing regional imbalance is a major challenge for Russia. The answer to this challenge requires reconsideration of approaches of the central government to regional policy, which must be focused not only on stabilization but also on the launch of mechanisms for sustainable economic growth, primarily through an adequate fiscal policy. The system of state regulation of territorial development should clearly define the competences of different levels of public authorities, the procedure for funding its commitments and control over execution of decisions of public administration bodies related to the field of regional policy.
References Problems and specific features of sub-federal budgets execution in 2015
- Vystuplenie A. G. Siluanova na parlamentskikh slushaniyakh 23.06.2015 g. . Available at: http://komitet-bn.km.duma.gov.ru/site.xp/050048. html..
- Vystuplenie T.A. Golikovoi na XV s”ezde partii “Edinaya Rossiya” 5 fevralya 2016 g. . Ofitsial'nyi sait Schetnoi palaty RF . Available at: http://www.ach.gov.ru/press_center/news/25747..
- Zubarevich N.V. Rost turbulentnosti v regionakh i gorodakh Rossii: otsenka perspektiv i riskov . Available at: http://politcom.ru/19260.html..
- Ilyin V.A., Povarova A.I. Problemy regional'nogo razvitiya kak otrazhenie effektivnosti gosudarstvennogo upravleniya . Ekonomika regiona , 2014, no. 3, pp. 48-63..
- Lykova L.N. Nalogovaya politika i vozmozhnosti ekonomicheskogo rosta: regional'nyi aspekt . Federalizm , 2016, no. 1, pp. 107-120..
- O vnesenii izmenenii v Zhilishchnyi kodeks Rossiiskoi Federatsii i otdel'nye zakonodatel'nye akty Rossiiskoi Federatsii: Federal'nyi zakon ot 25.12.2012 g. № 271-FZ . Konsul'tantPlyus: spravochno-poiskovaya sistema ..
- Ofitsial'nyi sait Ministerstva finansov RF . Available at: http://www.minfin.ru/ru/..
- Ofitsial'nyi sait Federal'nogo kaznacheistva Rossii . Available at: http://www.roskazna.ru/..
- Ofitsial'nyi sait Federal'noi nalogovoi sluzhby Rossii . Available at: http://www.nalog.ru/..
- Ofitsial'nyi sait Federal'noi sluzhby gosudarstvennoi statistiki . Available at: http://www.gks.ru/..
- Pechenskaya M.A. Regional'noe razvitie: tseli i vozmozhnosti . Finansy , 2014, no. 10, pp. 135-145..
- Povarova A.I. Passivnoe povedenie pravitel'stva. Byudzhetnye problemy regionov narastayut . Ekonomicheskie i sotsial'nye peremeny: fakty, tendentsii, prognoz , 2015, no. 3, pp. 39-55..
- Predvaritel'naya otsenka ispolneniya federal'nogo byudzheta za yanvar'-mai 2016 g. . Available at: http://minfin.ru/ru/press-center/..
- Primakov E.M. Chelovecheskii kapital vykhodit na pervyi plan . Rossiiskaya gazeta , 2013, no. 5981, 15 January..
- Programma povysheniya effektivnosti upravleniya obshchestvennymi (gosudarstvennymi i munitsipal'nymi) finansami: Rasporyazhenie Pravitel'stva RF ot 30.12.2013 g. № 2593-r . Konsul'tantPlyus: spravochno-poiskovaya sistema ..
- Putin V.V. Poslanie Federal'nomu Sobraniyu RF ot 03.12.2015 g. . Ofitsial'nyi sait Prezidenta RF . Available at: http://kremlin.ru/events/president/news/50864..
- Rossiiskoe obshchestvo: god v usloviyakh krizisa i sanktsii: informatsionno-analiticheskii material po itogam obshcherossiiskogo sotsiologicheskogo issledovaniya . Moscow, 2015. P. 48..
- Seninskii S. U regionov dolgi, a u tsentra lishnie den'gi . Available at: http://rpr.ur.ru/chtosgosu/2016/3/19/2872/..
