Problems of providing balanced development of the northern region: ecological and economic aspect

Author: Lebedeva Marina A., Kozhevnikov Sergei A.
Journal: Economic and Social Changes: Facts, Trends, Forecast @volnc-esc-en
Section: Environmental economics
Article in issue: 4 т.14, 2021.
Free access
Under current conditions, considering the national development goals of Russia through to 2030, one of the urgent tasks is to provide the development of country`s regions on the principles of ecological and economic balance, which is especially important for the Russian northern territories because of their greater vulnerability and lower rate of ecosystem restoration. In this regard, the purpose of the work is to study the features and problems of ecological and economic balance in the development of the northern region, as well as to justify the tools to solve them. The object of the study is the Russian North as a region which has enormous natural resource and geostrategic potential, and occupies an important place in the territory of the North. The basis of the methodology is the of P. Victor model, which makes it possible to assess the presence or absence of the decoupling effect in the regional development. Subsequently, we analyze the trends for compliance with the principles of ecological and economic balance. As a result, we have found that there is no decoupling effect for all types of anthropogenic impacts in 2007™2018. Moreover, the considered trends do not meet the key principles of ecological and economic balance including the reason of the low implementation rate of environmental innovations in economic activity due to their high cost. This necessitates the need to form a mechanism of ecological and economic balance of development; it`s most important element could be a regional fund to support the implementation of the best available technologies. The fund plays the role of a financial tool to stimulate the introduction of innovations in the enterprises that are greening their activities. The scientific novelty of the work is to improve the methodological tools for assessing and providing the ecological and economic balance of the regional development. The direction for further research will be a more detailed elaboration of the mechanism to provide ecological and economic balance in the development of the northern regions in the country.
Ecological and economic balance, sustainable development, Russia north, decoupling, natural recourse intensity, best available technologies
Short address: https://sciup.org/147235421
IDR: 147235421 | UDC: 332.122 | DOI: 10.15838/esc.2021.4.76.8
Text of the scientific article Problems of providing balanced development of the northern region: ecological and economic aspect
According to studies by leading scientists, one of the limiting factors of economic growth in Russia’s regions is the degradation of the natural environment and its resources – current and potential economic assets. Accordingly, one of the important problems is to ensure a certain balance between economic and natural reproduction. However, the balance of economic activity in the region and the reproduction of its natural systems is possible only if all the principles of ecological and economic balance of development are observed [1–3].
Currently, the problems of balanced ecological and economic development are among the priorities in the regional policy of most countries in the world [2]. Development problems of social, economic and ecological subsystems of regions cannot be considered separately, as they are in close interaction with each other, and transformations in one of the areas will inevitably affect the others.
The relevance of the work is also confirmed by the fact that in recent years a number of documents determining the direction of ecological and economic development of the country have been adopted. A special place among them is occupied by the Decree of the President of the Russian Federation no. 474, dated July 21, 2020
“On the national development goals of the Russian Federation for the period through to 2030”, which identifies such a strategic goal as the creation of a comfortable and safe environment for life including through the improvement of environmental conditions1.
It is important to note that mechanisms to ensure sustainable economic growth and reduce the anthropogenic impact on the environment are currently being created, but mechanisms for comprehensive, balanced ecological and economic development are lacking, and individual measures are still insufficient. For example, within the framework of the national project “Ecology” it is planned that in the sphere of processing and disposal of solid municipal waste (SMW) the proportion of imported equipment should not exceed 22%. This measure, apart from solving the “garbage” problem, is aimed at increasing the innovation activity (as only innovative technologies can provide effective processing of SMW). However, at present, mostly imported equipment is used for
SMW utilization, and Russian equipment is usually used as auxiliary (conveyor belts, containers for accumulation, etc.) [4].
The imbalance of ecological and economic development is particularly acute in the northern regions which are territories with significant mineral resource potential and developed industry that has a significant anthropogenic load, as well as a very small ecological carrying capacity2 due to natural and climatic conditions.
The imbalance of ecological and economic development in recent years has led to the fact that only in the territory of the European North of Russia (ENR) as of May 7, 2021 there were 18 objects of accumulated environmental damage3, concentrated mainly in the Far North (Murmansk Oblast and Nenets Autonomous Okrug). More than one million people are exposed to the negative impact of such objects (Tab. 1).
In addition, there is no reason to believe that all objects are included in the GRONVOS3; many of them simply have not been reported or the application may not meet the requirements, causing it to be rejected. The above-mentioned makes this study relevant.
The purpose of the work is to investigate the features and problems of ecological and economic balance in the development of the northern region, as well as to substantiate the tools for their solution.
The object of the study is the North of Russia as a region which occupies an important place in the territory of the North and has a huge natural resource and geostrategic potential.
The practical significance of the study consists in the possibility of using the results obtained to improve federal and regional policies aimed at ensuring a balanced ecological and economic development of the northern regions of Russia.
Theoretical aspects of the research
Ecological and economic balance (EEB) is an integral component of sustainable development. The implementation of its ideas should be carried out exactly at the regional level due to the fact that the regions are historically the most sustainable territorial entities, which are equidistant in the administrative space of the federation (center – federal okrugs – regions – municipalities (districts) – citizen) [5].
At present, not enough attention is paid directly to the problem of EEB. As a rule, it is an integral element of such concepts as sustainable development [5; 6], green economy [7] , blue economy [8; 9], circular economy [10; 11]. Due to the fact that the ecological and economic balance is considered only through the prism of the above-mentioned concepts, the formulation of its definitions is also extremely scarce. This is confirmed by the analysis of domestic and foreign studies. In our opinion,
Table 1. Objects of accumulated environmental damage in the ENR territory
Subject The number of objects of accumulated environmental damage, units The number of the population exposed to the negative impact of objects of accumulated environmental damage, thousand people Murmansk Oblast 16 1113.6 Nenets Autonomous Okrug 2 0.625 Source: Data of the State Register of Accumulated Environmental Damage Objects (as of May 07, 2021). Available at:
2 Ecological carrying capacity is an ability of the natural environment (atmosphere, water sources, soil) to perceive various anthropogenic influences (including harmful impurities) on a certain scale without changing its basic properties in an indefinitely long term.
3 Accumulated environmental damage is damage resulting from past activities, the obligations to eliminate which have not been fulfilled or have not been fully fulfilled. The State Register of Accumulated Environmental Damage (GRONVOS) was created to record the objects that have such environmental impact.
the most precise and capacious definition of EEB was proposed by Doctor of Sciences (Economics), Professor M.F. Zamyatina: “ a balance of resource and ecological opportunities of the territory with the needs of the regional socio-economic system, which provides the reproduction of natural, human, produced capital ” [2, p. 7].
The EEB is implemented through a number of principles (Tab. 2) .
By its nature, the ecological and economic balance of development is expressed through the decoupling effect, a phenomenon when economic growth and the reduction of anthropogenic load indicators are observed simultaneously [12; 13; 14]. In our opinion, the difference between the EEB development and decoupling is that decoupling practically does not take into account innovation activity in the economy, but only reflects the dynamics of changes in economic growth and environmental load without specifying the causeeffect relations.
There are several types of decoupling. The most common are absolute decoupling, in which economic growth is accompanied by a decrease in resource use or anthropogenic load, and relative decoupling, in which the rate of economic growth should exceed the growth rate of resource con- sumption or negative impact on the environment. In addition, decoupling is distinguished by geographic scale (local, regional, national, global), as well as by the scope of the economy (sectoral or overall economic system). As a result of the review of 179 publications, carried out by T. Vaden with coauthors [8], it was found that researchers most often consider the relative decoupling at the local, regional or national level with the coverage of the whole economic system.
A broader and at the same time closest concept to the ecological and economic balance is the green economy. “A green economy is an economy that promotes human well-being and social justice, as well as significantly reduces ecological risks and disadvantages” [15, с. 9]. In our opinion, the concept of green economy is somewhat broader than the ecological and economic balance, due to the fact that it should also take into account the social aspect, and be based on the EEB principles.
However, there is still some discussion about the relationship between the green economy, ecological and economic balance, and the decoupling effect. Thus, the American scientist, Professor D. Meadows argues that there are many studies confirming that the decoupling effect does not work4. Professor of Peter the Great St. Petersburg
Table 2. Principles of ecologi cal and economic balance
|
Princilpe |
Content |
|
Consistency |
It is important to take into account the properties not only of each individual element, but also of the system as a whole, as a result of the interaction of the elements that make it up. |
|
Consideration of the natural resource intensity |
When implementing economic activities, it is necessary to preserve the possibility of sustainable functioning of ecosystems as an environment for life |
|
Increasing the closure of material and energy cycles of production and consumption |
More integrated use of materials and energy reduces the removal of resources from the natural environment, thus reducing the cost of raw materials and preserving natural resource potential |
|
Innovativeness |
Reducing the environmental load should be achieved through the introduction of energy- and resourcesaving and efficient cleaning technologies, rather than by reducing the volume of production and closing polluting industries. |
|
Transition to the concept of risk management |
There is a need to take into account the possible adverse impact on the population and nature, not only in the short term, but also in the long-term perspective. |
|
Source: Ed. by Zamyatina M.F. Ecological and economic balance of regional development: methodological and methodical bases: monograph. Saint-Petersburg: GUAP, 2013. P. 143, p. 20 . |
|
4 Vavilov S. Science is to solve problems, not open up new horizons: interview. Available at: ru/science/2012/05/ (accessed: January 30, 2021).
Polytechnic University L.L. Kamenik [16] notes that most studies of green economy development are not related to the ecological and economic balance; according to the authors, such works do not analyze the resource factor.
In fact, in many works for the assessment is used mainly natural resource intensity as the pollution density [14; 17; 18; 19]. But there are also studies that use both types of this indicator (natural resource intensity as the pollution density and as the intensity of natural resources costs). They include, for example, the study of A.O. Akulov [13], concerning the natural resource intensity of the coal industry of the Kemerovo Oblast. In our opinion, the calculation of natural resource intensity by the resource factor is appropriate only in the study of a particular industry. In the case of calculating this indicator relative to the territory (region or federal okrug), the natural resource intensity will depend to a greater extent on the available natural capital, rather than on economic activity.
Recently, interest in this effect is not fading, there are studies on various sectors of activity (transport, energy, construction, agriculture), where the ratio of ecological and economic development is estimated precisely through decoupling [8; 17–21]. For example, F. Dong, J. Li, X. Zhang, J. Zhu combined the Tapio decoupling indicator (a decoupling indicator based on an elasticity indicator) and the Kuznets curve in order to analyze the possibility of decoupling in the long term and the costs necessary to achieve it [17]. C. Gao, H. Ge, Y. Lu, W. Wang, Y. Zhang combined the Tapio decoupling indicator, calculated relative to greenhouse gas emissions, and the Cobb-Douglas production function to study the economic factors that stimulate an increase in emissions [18]. S. Neves and A. C. Marques, having calculated the decoupling indicator, using autoregressive distributed lag model, analyzed the role of alternative energy sources in the decarbonization of the transport sector in the United States [19].
A review of the most recent scientific works has established that the effect of decoupling can be used to estimate the resource costs and the corresponding economic effect. We believe, however, that this indicator only is not enough to assess the ecological and economic balance. Without additional analysis, it is impossible to understand how it was achieved: due to the implementation of eco-innovations or a simple reduction in production volumes.
The issue of ecological and economic balance is actively discussed in the international political scene. For example, Europe adopted a “European Green Deal” in 2019, which implies achieving carbon neutrality by 2050. One of the tools of green development is a border carbon tax which is not only a method of climate change regulation, but also a way to protect economic interests for European countries. As model calculations of IEF RAS show, Europe’s net emissions will be 62 billion tons of CO2 by 2050, which implies an 85% reduction in emissions compared to 1990. According to the same calculations, the net emissions in Russia will not exceed the accumulated net emissions of 50 billion tons [22].
While Europe is fighting climate change by introducing a carbon tax, Russia is primarily concerned with the absorption of greenhouse gases by plants5. At the climate summit on April 22– 23, 2021, Russian President V.V. Putin said that development should not only be “green”, but also sustainable in its entirety, i.e., it should be linked to such goals of sustainable development as fighting poverty and reducing the gap between developed and developing countries. As a response, Russia developed the Long-term Development Strategy with Low Greenhouse Gas Emissions to 2050 which provides for reduction of greenhouse gas emissions to 64% of the 1990 level (the most optimistic scenario is up to 52%).
Thus, the EEB of regional development and mechanisms for its provision remain understudied and require further research.
Research methods
To assess the EEB, it is necessary to determine the presence (absence) of a decoupling effect, then analyze what causes this effect and to what extent. For this purpose, the model of ecological-economic “zones” will be used, the author of which, P. Victor, tested it in the case of greenhouse emissions in Canada [23]. Further, on its basis, Candidate of Sciences (Economics) T.V. Tikhonova assessed the quality of economic growth in the Komi Republic for the period 2007–2016 [24].
The basis of the model is the ratio of the growth rate of GRP and eco-intensity (natural resource intensity). P. Victor suggested using the monetary indicator of natural resource intensity, calculated as the value of the environmental load per unit of gross regional product (EIGRP, formula (1)), and natural, calculated as the size of the environmental load per capita (EIP, formula (2)):
EI GRP = EL⁄GRP , (1)
where EL is an environmental load (including removal of natural resources) and GRP is gross regional product;
EI P = EL⁄P, (2)
where EL is an environmental load, P is population.
The growth rate of cost and natural indicators of eco-intensity is calculated by formulas (3) and (4), respectively.
EIt+1
' ei grp = X100% , (3)
EIGRP where /Ej GRP — growth rate of the eco-intensity cost indicator;
EI grp — eco-intensity cost indicator of the current period;
EI grp — eco-intensity cost indicator of the previous period;
EI p +1
4i p = x^°% , (4)
EIp where /Ej p — the growth rate of the natural eco-intensity indicator;
EI p +1 — the growth rate of the natural ecointensity indicator of the current period;
EI p — the growth rate of the natural ecointensity indicator of the previous period.
We should also note that only such a decoupling effect, which fully corresponds to its principles (Tab. 1) , can be an indicator of ecological and economic balance [2].
Moreover, if we consider that the decoupling effect is a process of sustainable, long-term, forecastable and controllable misalignment of economic growth and pollution trends, then the eco-intensity growth rates should not only not exceed the annual growth rate of GRP, but also decrease (or at least not increase) relative to the previous year.
As environmental load indicators will be used the volume of total emissions of pollutants – the sum of air emissions from stationary and mobile sources taking into account their entrapping and clearing; the volume of polluted (untreated and insufficiently treated) wastewater discharge; volume of unrecycled and unused production and consumption waste – waste generation volume, adjusted to the value of their processing and use. In this work, the calculations were carried out in the period from 2007 to 2018. Subsequently, the results will be analyzed for compliance with the principles of ecological and economic balance.
Research results
The dynamics of eco-intensity changes in terms of emissions of pollutants into the atmospheric air and GRP in cost and natural are shown in Figure 1 .
Since 2014, there has been a decoupling effect with regard to the anthropogenic load on atmospheric air and economic growth, but at this stage it
Figure 1. Dynamics of environmental intensity growth rates in terms of emissions of pollutants into the atmospheric air and GRP of the ENR, %
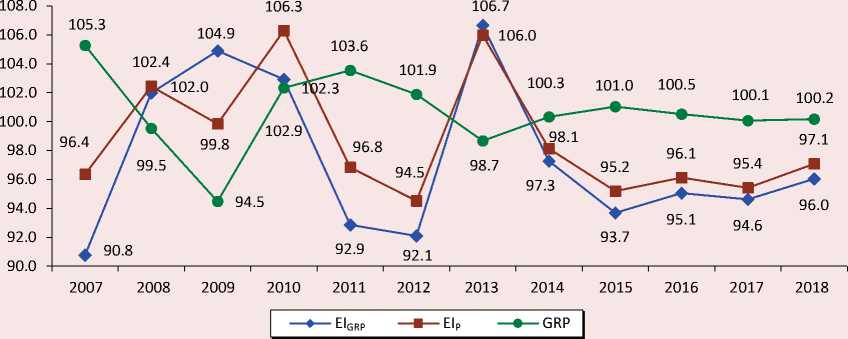
Source: Regions of Russia. Social and Economic indicators: stat. coll. 2006–2020
cannot be indicative of ecological and economic balance. The decoupling effect in the period from 2014 to 2018 is characteristic only of the Vologda and Arkhangelsk Oblasts (including Nenets Autonomous Okrug).
As noted earlier, the important principles of ecological and economic balance are innovation and closure of the material and energy cycles of production and consumption. Thus, regarding the introduction of innovative technologies for purification of waste pollutants it can be concluded that both innovation activity (on the introduction of the best available technologies) and closure of the material cycle are clearly insufficient (Tab. 3), since modern BAT allow capturing up to 97–99% of waste pollutants6.
Table 3. Percentage of captured pollutants from stationary sources, %
|
Territory |
2006 |
2008 |
2010 |
2012 |
2013 |
2014 |
2015 |
2016 |
2017 |
2018 |
2018 to 2006, p. p. |
|
European North of Russia |
72.9 |
73.7 |
72.1 |
70.6 |
67.2 |
67.6 |
70.1 |
71.6 |
75.9 |
71.1 |
-1.8 |
|
Republic of Karelia |
55.4 |
57.9 |
56.5 |
46.5 |
37.4 |
45.7 |
42.9 |
44.2 |
47.9 |
39.5 |
-15.9 |
|
Komi Republic |
32.5 |
31.4 |
37.9 |
37.5 |
33.1 |
34.9 |
37.3 |
38.4 |
59.6 |
31.7 |
-0.8 |
|
Arkhangelsk Oblast |
68.0 |
72.7 |
55.8 |
70.5 |
69.9 |
63.3 |
62.9 |
64.0 |
62.4 |
67.1 |
-0.9 |
|
incl. Nenets AO |
no data |
no data |
0.0 |
0.0 |
0.0 |
0.0 |
0.0 |
0.0 |
0.0 |
0.0 |
– |
|
Arkhangelsk Oblast (excl. Nenets AO) |
no data |
no data |
72.3 |
76.3 |
76.7 |
72.0 |
73.6 |
73.4 |
73.4 |
76.1 |
– |
|
Vologda Oblast |
80.4 |
81.7 |
78.9 |
76.8 |
71.4 |
69.4 |
74.2 |
75.1 |
83.3 |
85.4 |
5.0 |
|
Murmansk Oblast |
87.0 |
85.9 |
88.5 |
86.1 |
85.8 |
86.7 |
86.6 |
88.8 |
84.8 |
71.3 |
-15.7 |
|
Source: Regions of Russia. Social and Economic indicators: stat. coll. 2020. P. 475. |
|||||||||||
6 Purification of atmospheric discharge (pollutants) in manufacturing of products (goods), as well as performing works and providing services at large enterprises: Information and technical reference book 22-2016. Available at: document/1200143294
Figure 2. Dynamics of eco-intensity growth rates by discharges of polluted wastewater into water bodies and GRP of the ENR, %
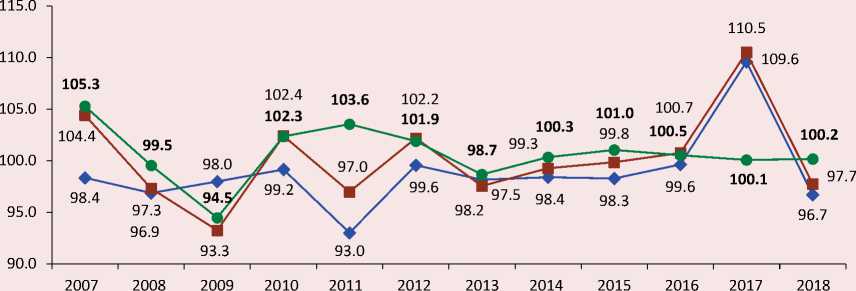
I —»— EIGRP — ■ — EIP —•— GRP
Source: Regions of Russia. Social and Economic indicators: stat. coll. 2007–2020.
As follows from Table 3, the capture of pollutants from stationary sources decreased, but at the same time the rate of eco-intensity reduction also decreased. This indicates that this effect was not achieved at the expense of innovative treatment technologies.
Looking at the dynamics of growth rates of GRP and natural resource intensity on the discharge of polluted wastewater (Fig. 2) , we can note the absence of the decoupling effect, as this ratio of indicators is neither stable nor manageable in the long term.
Such a ratio of GRP growth rate and ecointensity was influenced by a number of factors (closure water consumption cycles, polluted wastewater discharge). On the territory of the ENR, the closure of water consumption cycles is growing quite slowly and is still insufficient (Tab. 4, 5) , as the modern best available technologies (BAT) allow providing 99.9% of treatment [25]. Returning to the EEB principles (see Tab. 1), it is worth noting that the innovativeness and closure of material and energy cycles are insufficient, and their increase is not sustainable (and in the Komi Republic, a decrease is observed).
Table 4. Percentage of recycled water in the total volume of water used, %
|
Territory |
2006 |
2008 |
2010 |
2011 |
2012 |
2013 |
2014 |
2015 |
2016 |
2017 |
2018 |
2018 to 2006 p. p. |
|
European North of Russia |
66.5 |
68.1 |
64.8 |
68.8 |
69.7 |
68.9 |
69.2 |
71.4 |
71.6 |
70.9 |
71.2 |
4.7 |
|
Republic of Karelia |
81.3 |
81.9 |
87.1 |
87.9 |
86.9 |
85.3 |
85.5 |
85.5 |
85.7 |
77.2 |
76.6 |
-4.7 |
|
Komi Republic |
72.1 |
74.0 |
63.3 |
63.4 |
65.1 |
66.0 |
66.8 |
66.3 |
65.9 |
67.4 |
68.0 |
-4.1 |
|
Arkhangelsk Oblast |
56.9 |
57.5 |
0.0 |
56.2 |
56.7 |
56.6 |
57.1 |
56.9 |
55.6 |
57.7 |
58.1 |
1.2 |
|
incl. Nenets AO |
79.8 |
80.1 |
81.5 |
80.4 |
83.5 |
86.2 |
72.8 |
86.2 |
88.3 |
91.5 |
86.2 |
6.4 |
|
Arkhangelsk Oblast (excl. Nenets AO) |
56.8 |
57.4 |
55.2 |
56.0 |
56.5 |
56.3 |
57.0 |
56.6 |
55.1 |
57.2 |
57.8 |
1.0 |
|
Vologda Oblast |
84.7 |
84.8 |
86.1 |
87.6 |
89.0 |
88.9 |
89.2 |
91.2 |
92.3 |
94.6 |
94.8 |
10.1 |
|
Murmansk Oblast |
33.9 |
37.6 |
35.0 |
38.3 |
40.2 |
35.4 |
34.7 |
40.1 |
40.1 |
40.2 |
40.7 |
6.8 |
Source: On the state of the environment in the subjects of the European North of Russia: Government reports, 2006–2018.
Table 5. Percentage of polluted wastewater discharges in the total volume of water disposal, %
|
Territory |
2006 |
2008 |
2010 |
2012 |
2013 |
2014 |
2015 |
2016 |
2017 |
2018 |
2018 to 2006 p. p. |
|
European North of Russia |
77.3 |
79.6 |
85.7 |
84.6 |
79.8 |
77.0 |
82.4 |
84.9 |
88.9 |
83.6 |
6.3 |
|
Republic of Karelia |
85.2 |
84.5 |
92.4 |
85.5 |
87.9 |
87.5 |
82.2 |
92.6 |
88.7 |
71.3 |
-13.9 |
|
Komi Republic |
23.5 |
22.6 |
25.0 |
26.4 |
24.6 |
25.5 |
27.4 |
25.3 |
59.4 |
62.1 |
38.6 |
|
Arkhangelsk Oblast |
71.2 |
73.8 |
63.9 |
56.2 |
53.2 |
52.3 |
51.8 |
49.0 |
48.8 |
49.2 |
-22.0 |
|
incl. Nenets AO |
92.1 |
92.0 |
13.2 |
5.1 |
4.4 |
0.0 |
0.0 |
15.9 |
13.4 |
15.6 |
-76.5 |
|
Arkhangelsk Oblast (excl. Nenets AO) |
71.2 |
73.7 |
64.0 |
56.4 |
53.3 |
52.5 |
52.0 |
49.1 |
49.0 |
49.4 |
-21.8 |
|
Vologda Oblast |
25.4 |
22.3 |
26.6 |
33.9 |
32.4 |
30.7 |
39.0 |
44.6 |
70.3 |
59.7 |
34.3 |
|
Murmansk Oblast |
17.2 |
20.3 |
19.9 |
23.0 |
19.4 |
19.4 |
21.6 |
20.9 |
20.7 |
19.4 |
2.2 |
|
Source: On the state of the environment in the subjects of the European North of Russia: Government reports, 2006–2018. |
|||||||||||
In the ENR from 2006 to 2018, the percentage of wastewater discharged without proper treatment has increased and amounted to about 84% of the total volume of water disposal (see Tab. 5). This forms a fairly high level of anthropogenic impact and indicates not only the failure to consider the ecosystem capacity, but also the lack of a risk-oriented approach to the environmental aspects of economic activity.
In the sphere of production and consumption waste it is also obvious that there is no decoupling effect (Fig. 3). In the case of the production and consumption waste of the ENR we can state the inconsistency with most of the EEB principles. This trend is due to inefficient waste management, i.e. the situation when the volume of generated waste is growing, and the amount of waste sent for recycling is decreasing. For instance, in the ENR, waste generation has increased almost by half, while its recycling has slightly decreased.
This problem is especially acute in the Arkhangelsk Oblast, where the percentage of recycled waste does not exceed 6% of its generation (Tab. 6) .
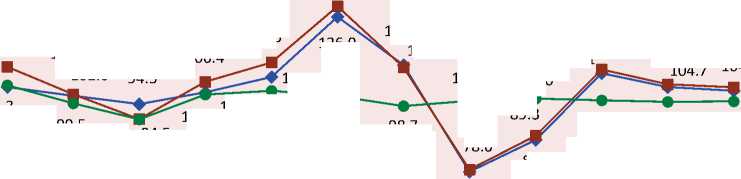
Figure 3. Dynamics of eco-intensity by waste and GRP of the ENR, %
140.0
130.0
120.0
110.0
100.0
90.0
80.0
70.0
60.0
105.3
104.7
130.3
111.1
94.5
102.4
102.0
111.7
111.0
110.3 105.6
100.3 101.0
112.5
106.4
89.3
78.6
107.9
99.5
87.9
77.9
94.5
99.3
126.9
100.5 100.1 103.5
102.3103.0 103.6 101.9
98.7
104.7
100.2
2007 2008 2009 2010 2011 2012 2013 2014 2015 2016 2017 2018
I — EIGRP — ■ — EIP —•— GRP
Sources: Regions of Russia. Social and Economic indicators. 2006–2020, On the state of the environment in the subjects of the European North of Russia: Government reports, 2006–2018.
Table 6. Dynamics of waste generation and recycling of the ENR
|
Territory |
Waste |
2006 |
2008 |
2010 |
2012 |
2013 |
2014 |
2015 |
2017 |
2018 |
2018 to 2006 |
|
European North of Russia |
Generated, mil. t |
323.3 |
354.4 |
324 |
469.3 |
524.4 |
412.8 |
420.5 |
435.6 |
448.7 |
138.8% |
|
Recycled, % |
20.9 |
19.2 |
12.6 |
12.8 |
14 |
14.6 |
25.5 |
21.2 |
19.8 |
-1.1 p. p. |
|
|
Republic of Karelia |
Generated, mil. t |
101.7 |
95.6 |
95.2 |
136.6 |
135.8 |
131.3 |
128.8 |
134.2 |
139.7 |
137.4% |
|
Recycled, % |
10 |
0.5 |
10 |
5.3 |
5 |
5.5 |
37.1 |
13.1 |
9.7 |
-0.3 p. p. |
|
|
Komi Republic |
Generated, mil. t |
16.7 |
19.1 |
16.9 |
24 |
6.8 |
7.4 |
8.4 |
5.8 |
5.6 |
33.5% |
|
Recycled, % |
8.4 |
8.5 |
6.4 |
73.3 |
25.2 |
24.2 |
20.3 |
18.3 |
13.9 |
5.5 p. p. |
|
|
Arkhangelsk Oblast (incl. Nenets AO) |
Generated, mil. t |
10.7 |
17.7 |
8.3 |
60.9 |
126.2 |
69.7 |
81.7 |
81.2 |
74.7 |
by 6.9 times |
|
Recycled, % |
3.4 |
2.7 |
2.5 |
05 |
13.7 |
2.7 |
6.2 |
6.4 |
5.6 |
2.2 p. p. |
|
|
Nenets AO |
Generated, mil. t |
0.6 |
0.1 |
0.1 |
0 |
0.1 |
0.1 |
0.2 |
0.1 |
0.1 |
16.7% |
|
Recycled, % |
0 |
0 |
0 |
0 |
0 |
0.1 |
0 |
0.1 |
0.1 |
0.1 p. p. |
|
|
Arkhangelsk Oblast (excl. Nenets AO) |
Generated, mil. t |
10.1 |
17.6 |
8.1 |
60.9 |
126.1 |
69.6 |
81.5 |
81 |
74.6 |
by 7.4 times |
|
Recycled, % |
33.8 |
15.4 |
30.3 |
0.9 |
10.9 |
3.8 |
7.5 |
7.8 |
7.3 |
-26.5 p. p. |
|
|
Vologda Oblast |
Generated, mil. t |
18.2 |
18.3 |
16.6 |
10.5 |
14.7 |
9.1 |
15 |
14.9 |
15.7 |
86.3% |
|
Recycled, % |
68.7 |
65.8 |
75.7 |
79.6 |
61.1 |
78.6 |
68.1 |
73.5 |
67.3 |
-1.4 p. p. |
|
|
Murmansk Oblast |
Generated, mil. t |
22.7 |
25.2 |
15.3 |
26.3 |
42.1 |
41.5 |
41.6 |
56.2 |
58.4 |
by 2.6 times |
|
Recycled, % |
22.7 |
25.2 |
8.2 |
11.1 |
17.5 |
21.2 |
22.3 |
28.1 |
27.4 |
4.7 p. p. |
Source: On the state of the environment in the subjects of the European North of Russia: Government reports, 2006–2018.
Here, the largest waste volume is generated by mining enterprises. In addition, for almost the entire period, more than 90% of all the production and consumption waste is not recycled and neutralized, regardless of the amount of their generation (that is, the growth of waste disposal is due to both an increase in their generation and insufficient use and disposal).
In 2013, there was a sharp decrease in the share of utilized production and consumption waste in the Komi Republic (from 73.3 to 25.2%), associated with a decrease in the share of used production and consumption waste in the mining industry from 73.92 to 1.85%7.
Thus, the development of the ENR subjects can be characterized as unbalanced in ecological and economic terms which confirms the absence of a decoupling effect in the period from 2007 to 2018. In some cases (emissions of pollutants into the atmospheric air since 2014), it did not comply with the principles of ecological and economic balance. The most serious imbalance of environmental and economic development is manifested in the sphere of production and consumption waste management. More positive trends are noted regarding the environmental intensity of wastewater discharges and emissions of pollutants into the atmospheric air.
In the course of the study, we have noted the low innovative activity of the region’s enterprises. According to the rating of innovative development of the Russian subjects, compiled by the Higher School of Economics, the subjects of the ENR rank in its second half. The methodology for calculating the index of innovation activity has not changed from 2008 to 2017 (Tab. 7).
Table 7. The innovative development level of the regions
|
Year |
Innovative development level |
Republic of Karelia |
Komi Republic |
Arkhangelsk Oblast |
Nenets AO |
Vologda Oblast |
Murmansk Oblast |
|
2008 |
Index value |
0.27 |
0.34 |
0.21 |
0.17 |
0.33 |
0.37 |
|
Rank |
59 |
28–29 |
74 |
82 |
37 |
20 |
|
|
2010 |
Index value |
0.34 |
0.36 |
0.26 |
0.18 |
0.36 |
0.39 |
|
Rank |
51 |
40–41 |
76–77 |
82 |
38 |
27–28 |
|
|
2012 |
Index value |
0.28 |
0.37 |
0.32 |
0.24 |
0.31 |
0.36 |
|
Rank |
71 |
34 |
58 |
76 |
60 |
40 |
|
|
2013 |
Index value |
0.28 |
0.36 |
0.35 |
0.19 |
0.32 |
0.35 |
|
Rank |
68 |
36 |
38 |
79 |
54 |
43 |
|
|
2014 |
Index value |
0.31 |
0.34 |
0.29 |
0.20 |
0.31 |
0.35 |
|
Rank |
54 |
41 |
63 |
80 |
55 |
37 |
|
|
2015 |
Index value |
0.30 |
0.29 |
0.29 |
0.17 |
0.34 |
0.35 |
|
Rank |
55 |
58 |
59 |
84 |
36 |
30 |
|
|
2017 |
Index value |
0.29 |
0.30 |
0.33 |
0.16 |
0.33 |
0.35 |
|
Rank |
60 |
57 |
45 |
84 |
41 |
36 |
Source: Rating of innovative development of Russian regions: Information and analytical materials of the National Research University HSE from 2010 to 2019.
In 2017, the ranking of almost all the subjects of the ENR (except for the Arkhangelsk Oblast) decreased significantly. The index values in most of the subjects also have not increased, therefore, we can conclude that the level of innovative development of the ENR cannot provide the “greening” of the economy corresponding to the modern world requirements.
The ratio of the organizations engaged in technological innovation, in most subjects of the ENR (except for the Murmansk Oblast) decreased. For example, in the Republic of Karelia in 2012
it was 9.8%, and in 2017 it was 4.8%, in the Arkhangelsk Oblast in 2012 – 7.2%, in 2017 – already 3.9%, in the Vologda Oblast in 2012 – 6.1%, in 2017 – 5.0%. Only in the Murmansk Oblast from 2012 to 2017 this indicator increased by 0.2 p.p., amounting to 6.8%8.
At the same time, we should note that such negative trends are observed with increasing expenditures on technological innovation, as well as an increase in investment in fixed capital aimed at the rational use of natural resources and environmental protection (Tab. 8, 9).
Table 8. Costs of technological innovation, mil. rub. *
|
Region |
2006 |
2008 |
2009 |
2010 |
2011 |
2013 |
2014 |
2015 |
2017 |
2018 |
|
European North of Russia |
13246.2 |
28574.9 |
20862.3 |
16201.4 |
51276.7 |
21168.1 |
14725.0 |
5645.5 |
4998.8 |
18627.8 |
|
Republic of Karelia |
1700.0 |
7354.6 |
2679.8 |
3938.3 |
1627.6 |
263.1 |
93.3 |
161.9 |
613.6 |
767.0 |
|
Komi Republic |
397.0 |
1724.9 |
1260.4 |
1904.8 |
26308.5 |
2394.8 |
2573 |
1118.7 |
2404.2 |
7929.2 |
|
Arkhangelsk Oblast |
819.5 |
3368.9 |
2330.3 |
1019 |
5471.3 |
12122.7 |
4961.8 |
1982.8 |
1139.8 |
3534.8 |
|
Including Nenets AO |
0.0 |
0.2 |
523.9 |
2.8 |
9.5 |
31.4 |
22.6 |
39.2 |
3.8 |
0.6 |
|
Vologda Oblast |
4153.5 |
6043.4 |
7758.1 |
4675.5 |
16459.4 |
3742.7 |
3814.5 |
758.1 |
381.5 |
367.0 |
|
Murmansk Oblast |
5176.2 |
10083.1 |
6833.7 |
4663.8 |
1409.9 |
2644.8 |
3282.4 |
1624 |
459.7 |
6029.8 |
* In comparable prices of 2018.
Source: Regions of Russia. Social and Economic indicators: stat. coll. 2007–2018.
Table 9. Investment in fixed capital aimed at environmental protection, mil. rub.
|
Subject of the ENR |
2007 |
2008 |
2010 |
2011 |
2012 |
2014 |
2015 |
2016 |
2017 |
2018 |
|
Republic of Karelia |
311.3 |
0.0 |
833.5 |
885.8 |
136.6 |
192.5 |
123.9 |
161.5 |
123.7 |
55.9 |
|
Komi Republic |
326.7 |
802.0 |
2016.3 |
853.7 |
6342.7 |
12465.6 |
13502.2 |
13357.3 |
5885.1 |
9609.1 |
|
Arkhangelsk Oblast, |
1352.8 |
2016.0 |
745.7 |
1311.9 |
435.3 |
816.9 |
952.4 |
1135.1 |
4019.9 |
1084.2 |
|
incl. Nenets Autonomous Okrug |
466.7 |
1015.7 |
165.6 |
217.2 |
0.0 |
319.0 |
386.9 |
435.2 |
1481.6 |
311.7 |
|
Vologda Oblast |
1605.2 |
1591.0 |
377.1 |
2826.9 |
2579.4 |
2470.0 |
879.5 |
881.8 |
1629.0 |
753.6 |
|
Murmansk Oblast |
73.7 |
356.7 |
586.9 |
523.2 |
322.6 |
1105.1 |
2163.9 |
490.7 |
1017.5 |
12100.9 |
|
Source: EMISS. |
If in the ENR as a whole the costs of technological innovation increased, in some subjects significantly decreased (in the Vologda Oblast, it was 11 times, in the Republic of Karelia – 2.2 times).
The main innovations to ensure the EEB are the best available technologies (BAT) which are understood as “technologies for the manufacturing of products (goods), works, services determined on the basis of modern scientific and technological advances and the best combination of criteria for achieving environmental protection goals, subject to the technical possibility of their application”9.
For their implementation, there was launched the national project “Ecology” which, at the level of the Russian Federation subjects, is implemented through regional projects. However, not all of them are implemented on the territory of the ENR (Tab. 10).
Table 10. Implementation of regional projects in the ENR subjects
Regional Project Republic of Karelia Komi Republic Arkhangelsk Oblast Vologda Oblast Murmansk Oblast Clean Country – + + + + Integrated system for municipal waste management + + + + – Infrastructure for handling especially hazardous waste – – – – – Clean Air – – – + – Clean Water + + + + – Improvement of the Volga river – – – + – Preservation of Lake Baikal – – – – – Preservation of unique water objects + + – + + Conservation of biological diversity and ecological tourism development + + – – + Forests Preservation + + + + + Implementation of the best available technologies – – – – – Source: data from the official websites of regional governments. Available at: ; ; ;
9 Best available technologies. Rosstandart. Available at:
The fact that projects to preserve Lake Baikal and to improve the Volga River (except for the Vologda Oblast) are not implemented in the ENR regions is understandable and caused by natural and geographic reasons. However, there are questions concerning the fact that such important projects as “Infrastructure for handling especially hazardous waste” are not implemented (especially for the Arctic regions of the ENR (Murmansk Oblast, Nenets Autonomous Okrug) with significant accumulated environmental damage, the problem of which is quite acute), and also the project “Implementation of the best available technologies”, contributing to greening of the economy of regions and modernization of existing industries, given the lack of decoupling effect on the main types of anthropogenic waste. Thus, the implementation of BAT at the enterprises is not included in the environmental national project on the territory of the ENR.
One of the most important technical factors limiting the effective implementation and functioning of BAT at Russian enterprises is the absence of specific marker substances and technological indicators in a number of information and technological reference books (in 16 of 51). This applies to such areas as pulp and paper production, chemical industry, mining industry, agriculture (animal husbandry), and waste management10.
Among the main economic factors hindering the growth of innovative activity, including the implementation of BAT, are the lack of enterprises’ own funds and the high cost of innovation, economic risks, difficulties in obtaining borrowed funds and excessive government regulation11.
On average in Russia the indicators of implementation of BAT are significantly inferior to the global average. For example, if in Russia the percentage of implemented BAT in the manufacturing industry is 25%, the world average is 55–60%; in the housing and utilities sector it is 12 and 40% respectively. Approximately the same ratio is observed in the energy sector (10% in Russia and 60% of the world average) and the oil and gas sector (20 and 40%)12.
Considering the main problems of implementation of BAT, we can conclude that at the moment, without additional assistance, the subjects of the ENR are not ready to implement such technologies.
Thus, the main problems in ensuring a balanced ecological and economic development of the region are:
– lack of a risk-oriented approach which manifests itself in the accumulated damage to the environment and failure to take into account the possible additional costs of its elimination;
– insufficient closure of material and energy cycles, as evidenced by the low share of production and consumption waste processing, the share of water used in closed water supply and the share of captured pollutants from stationary sources;
– low innovative activity: technological innovations are implemented at less than 10% of enterprises; the ENR subjects rank only in the second half of the rating “Level of innovative development”; in addition, a significant limitation for the introduction of innovation is their high cost;
– failure to take into account ecological capacity, which is confirmed by ignoring the northern ecological peculiarities of economic activity and, accordingly, is one of the important causes of accumulated damage to the environment;
– lack of implementation important state projects on the territory of the region (for example, “Implementation of the best available technologies” and “Infrastructure for handling especially hazardous waste”).
The results allow concluding that it is necessary to form a mechanism to ensure the ecological and economic balance in the development of the northern regions of the country. Its most important financial and organizational element can be the stimulation of innovations for greening of economic activity, especially BAT.
For this purpose, in our opinion, it is necessary to create a system of funds to support the imple- mentation of BAT at economic entities operating at the level of the RF subject. The scheme of their operation mechanism is shown in Figure 4.
The purpose of such a fund is to financially support implementation of BAT at industrial enterprises. The management of the enterprise makes a project on implementation of BAT in its activities, where it indicates the information about the location, the size of the sanitary protection zone, the adjacent residential area, the anthropogenic impact on the environment, the best available technology to be purchased, as well as the potential effect of it.
Figure 4. Functioning scheme of the fund supporting the implementation of BAT
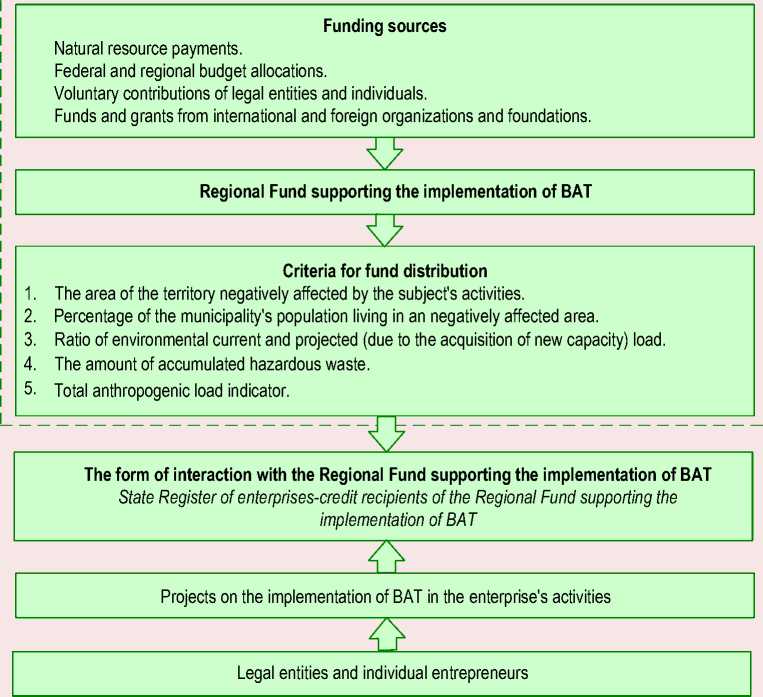
Source: own compilation.
Table 11. Criteria for prioritizing projects for granting funds from the fund
|
1. Percentage of the municipality’s population living in an adversely impacted area (j = 0.2) |
||
|
Value |
Point |
|
|
There is no population in the area |
0 |
|
|
Less than 1% |
1 |
|
|
1–20% |
2 |
|
|
20–40% |
3 |
|
|
40–50% |
4 |
|
|
More than 50% |
5 |
|
|
2. The area of the municipality’s territory negatively affected by the enterprise’s activities (j = 0.2) |
||
|
For facilities located within settlements, ha |
For facilities located outside settlements, ha |
Point |
|
Less than 0,5 |
Less than 1 |
0 |
|
1–5 |
1–10 |
1 |
|
5–15 |
10–20 |
2 |
|
15–30 |
20–50 |
3 |
|
30–50 |
50–100 |
4 |
|
More than 50 |
More than 100 |
5 |
|
3. Ratio of environmental current and projected load (due to the acquisition of new capacity) (j = 0.2) |
||
|
Expected reduction in the environmental load |
Point |
|
|
Reduction of less than 5% |
0 |
|
|
Reduction of 5–10% |
1 |
|
|
Reduction of 10–20% |
2 |
|
|
Reduction of 20–30% |
3 |
|
|
Reduction of 30–50% |
4 |
|
|
Reduction of more than 50% |
5 |
|
|
4. Contribution of the negative impact on the environment of the region (j = 0.2) |
||
|
Value |
Point |
|
|
Less than 1% |
0 |
|
|
1–5% |
1 |
|
|
5–10% |
2 |
|
|
10–20% |
3 |
|
|
20–30% |
4 |
|
|
More than 30% |
5 |
|
|
5. The value of the Total anthropogenic load indicator (TALI) * (j = 0.2) |
||
|
Value |
Point |
|
|
0–1 |
0 |
|
|
1–2 |
1 |
|
|
2–4 |
2 |
|
|
4–6 |
3 |
|
|
6–8 |
4 |
|
|
More than 8 |
5 |
|
|
* The total anthropogenic load indicator (TALI) shows the level of the environment pollution at a particular time, calculated on the basis of data on pollution of atmospheric air, water bodies, soil, noise pollution. Source: own compilation. |
||
The criteria for prioritization of projects for the provision of funds from the fund to support the implementation of BAT are presented in Table 11 . The methodological approach to their allocation is based, among other things, on the criteria for the selection of projects in the field of waste management and elimination of accumulated environmental damage existing in the Russian practice13.
The total point is calculated by the formula:
I = ^at x h, (5)
t=1
where I – total point by project priority;
ai – point by criterion value i ;
ji – criterion weight i ;
i – ordinal number of the criterion i .
The weight of the criterion ( ji ) is determined similarly to the weights of the criteria for the selection of projects in the field of waste management and elimination of accumulated environmental damage.
The maximum value of I is 5, the minimum is 0. Accordingly, the higher the value of I, the higher the priority of the project for funding. Every 6 months, the Fund monitors the purposeful spending of the provided funds and the compliance of the received environmental effect with the declared one.
This tool is quite universal and can be applied not only to the northern regions. However, taking into account the peculiarities of prioritization and its territorial binding to the region, its functioning will be aimed at solving the most acute environmental and economic problems, which, in turn, are most pronounced in the North.
Russia has already had the experience of a system of such funds operating at the federal, regional and local levels. The scheme of receiving funds into the system of such funds was as follows: funds were accumulated on the accounts of funds of the subjects of the Russian Federation, and from them were distributed to federal and local funds every quarter. I.P. Blokov, E.S. Navasardova, E.V. Il’icheva pointed out the need to return to the practice of such funds. [26; 27; 28].
However, prior to the creation of such a fund, several important issues relating directly to BAT must be resolved. First, the information and technological reference books of BAT should be finalized, since one third of them do not contain technological indicators and/or the list of marker substances. Secondly, to ensure a significantly lower value of technological indicators in information and technological reference books compared to the established standards. This is due to the fact that paragraph 3 of article 16.3 of the Federal Law “On Environmental Protection” no. 7-FZ, dated January 10, 2002 provides for a reduction coefficient “0” for payments for negative environmental impact at an anthropogenic load corresponding to technological indicators after the introduction of BAT, thus making the effect of the “polluter pays” principle selective.
Conclusion
The study revealed the absence of the decoupling effect in the territory of the European North of Russia in 2007–2018 which confirms the imbalance of the regional ecological and economic development. The main reason for the ecological and economic imbalance is weak innovation activity of industrial enterprises including in the field of environmental protection measures due to the lack of closure of material and energy cycles and inconsistency with the principles of risk-oriented approach. The enterprises themselves attribute it to the high cost of implementing innovations in production.
To solve the mentioned problem, the work substantiates the creation of a regional fund to support the implementation of BAT, the mechanism of functioning of which is aimed at supporting the enterprises that have the greatest negative impact on the most vulnerable territory. However, before this it is necessary to finalize information and technological reference books of BAT, as well as to ensure the implementation of the “polluter pays” principle.
In the course of this work, the question of quantitative parameters for assessing EEB has repeatedly arisen, which is currently highly debatable. However, in our opinion, it is advisable to judge the balance of regional development mainly by the existing medium- and long- term trends. At the same time, the ecological and economic balance can be characterized by the simultaneous fulfillment of the following conditions: steady growth of GRP and increase in the volume of shipped products; reduction of eco-intensity in value and volume terms; increase in the number of organizations implementing ecological innovations. In more detail the problem of determining the quantitative parameters of the region’s balanced development, as well as the mechanism of its provision will be considered at the next stage of the study.
The presented work contributes to the development of applied and theoretical science which is to improve the methodological tools for assessing the EEB of regional development.
References Problems of providing balanced development of the northern region: ecological and economic aspect
- Zamyatina M.F. Theoretical and methodological problems of regional management in the spheres of ecological, economic and social balance. Ekonomika i upravlenie=Economics and Management, 2012, vol. 4, no. 78, pp. 54–59 (in Russian).
- Zamyatina M.F. (Eds.) Ekologo-ekonomicheskaya sbalansirovannost’ regional’nogo razvitiya: metodologicheskie i metodicheskie osnovy: monografiya [Ecological and Economic Balance of Regional Development: Methodological and Methodological Foundations: Monograph.]. Sankt-Petersburg: GUAP, 2013. 143 p.
- Uskova T.V., Lukin E.V., Vorontsova T.V., Smirnova T.G. Problemy ekonomicheskogo rosta territorii [Problems of Economic Growth of the Territory]. Vologda: ISERT RAN, 2013. 170 p.
- Kudiyarov N. Garbage is out of control. Ekspert= Expert, 2019, no. 50, pp. 28–32 (in Russian).
- Uskova T.V. Upravlenie ustoichivym razvitiem regiona [Management of Sustainable Development of the Region]. Vologda: ISERT RAN, 2009. 355 p.
- Shah M.M. Sustainable Development. In: Encyclopedia of Ecology. 2008.
- Brandi C., Schwab J., Berger A., Morin J.F. Do environmental provisions in trade agreements make exports from developing countries greener? World Development, 2020, vol. 129, 104899.
- Vadén T., Lähdea V., Majavaa A., Järvensivua P., Toivanena T., Hakalaa E., Eronen J.T. Decoupling for ecological sustainability: A categorisation and review of research literature. Environmental Science Policy, 2020, vol. 112, pp. 236–244.
- Choudhary P., Subhash V., Khade M., Savant S., Musale A., Kumar R.K., Chelliah M.S., Dasgupta S. Empowering blue economy: From underrated ecosystem to sustainable industry. Journal of Environmental Management, 2021, vol. 291, 112697.
- Holzer D., Rauter R., Fleiß E., Stern T. Mind the gap: Towards a systematic circular economy encouragement of small and medium-sized companies. Journal of Cleaner Production, 2021, vol. 298, 126696.
- Seroka-Stolka O., Ociepa-Kubicka A. Green logistics and circular economy. Transportation Research Procedia, 2019, vol. 39, pp. 471–479.
- Yashalova N.N. Stimulirovanie ustoichivogo ekologo-ekonomicheskogo razvitiya regiona [Stimulation of Sustainable Ecological and Economic Development of the Region]. Moscow: Lomonosov Moscow State Universuty, 2015. 372 p.
- Akulov A.O. Decoupling effect in the industrial region (the case of the Kemerovo Oblast). Ekonomicheskie i sotsial’nye peremeny: fakty, tendentsii, prognoz=Economic and Social Changes: Facts, Trends, Forecast, 2013, no. 4, p. 177–185 (in Russian).
- Shimova O.S. Assessment of the decoupling effect for monitoring the green economy. Belorusskii ekonomicheskii zhurnal=Belarusian Economic Journal, 2013, no. 2, p. 71–83 (in Russian).
- Towards a Green Economy. Pathways to Sustainable Development and Poverty Eradication. A Synthesis for Policy Makers. Saint-Martin-Bellevue: UNEP, 2011. 52 p.
- Kamenik L.L. Ecological and economic balance – a strategy for managing innovative development of the society of the XXI century. Voprosy innovatsionnoi ekonomiki=Russian Journal of Innovation Economics, 2018, vol. 8, no. 1, p. 25–38 (in Russian).
- Dong F., Li J., Zhang X., Zhu J.A. Decoupling relationship between haze pollution and economic growth: A new decoupling index. Ecological Indicators, 2021, vol. 129, 107859.
- Gao C., Ge H., Lu Y., Wang W., Zhang Y. Decoupling of provincial energy-related CO2 emissions from economic growth in China and its convergence from 1995 to 2017. Journal of Cleaner Production, 2021, vol. 297, 126627.
- Neves S.A., Marques A.C. The substitution of fossil fuels in the US transportation energy mix: Are emissions decoupling from economic growth? Research in Transportation Economics, 2021, 101036.
- Abam F.I., Ekwe E.B., Diemuodeke O.E., Ofem M.I., Okon B.B., Kadurumba Ch.H., Archibong-Eso A., Effiom S.O., Egbe J.G., Ukueje W.E. Environmental sustainability of the Nigeria transport sector through decomposition and decoupling analysis with future framework for sustainable transport pathways. Energy Reports, 2021, vol. 7, pp. 3238–3248.
- Wang Q., Han X. Is decoupling embodied carbon emissions from economic output in Sino-US trade possible? Technological Forecasting & Social Change, 2021, vol. 169, 120805.
- Porfir’ev B.N. Green Agenda: asymmetric response. Ekspert= Expert, 2021, no. 18–19, pp. 19–21.
- Victor P.A. The Kenneth E. Boulding Memorial Award 2014. Ecological economics: A personal journey. Ecological Economics, 2015, vol. 109, рр. 93–100.
- Tikhonova T.V. Environmental assessment of economic growth in the Northern Region. Ekonomicheskie i sotsial’nye peremeny: fakty, tendentsii, prognoz=Economic and Social Changes: Facts, Trends, Forecast, 2018, vol. 11, no. 3, pp. 162–178 (in Russian).
- Malkin P. Wastewater treatment system based on nanomodified natural sorbents. Nanotechnologies in Construction A Scientific Internet-Journal, 2012. Available at: https://readera.org/sistema-ochistki-stochnyh-vod-s-ispolzovaniem-nanomodificirovannyh-prirodnyh-142212241
- Blokov I.P. Okruzhayushchaya sreda i ee okhrana v Rossii [Environment and Its Protection in Russia]. Moscow: OMMNO Sovet Grinpis, 2018. 422 p.
- Navasardova E.S. Ecological funds as sources of financing of ecologically significant actions: historical and legal analysis. Gumanitarnye i yuridicheskie issledovaniya=Humanities and law studies, 2013, no. 1, pp. 89–94 (in Russian).
- Il’icheva E.V. Environmental fund system. Upravlenie ekonomicheskimi sistemami=Management of economic systems, 2007, no. 11, pp. 3–7 (in Russian).
