Prostate specific antigen density as a prognostic factor in patients with prostate cancer treated with combined hormonal radiation therapy

Author: Kneev A.Y., Shkolnik M.I., Bogomolov O.A., Zharinov G.M.
Journal: Сибирский онкологический журнал @siboncoj
Section: Клинические исследования
Article in issue: 3 т.21, 2022.
Free access
Purpose. to evaluate prostate specific antigen density (psad) as a predictor of overall (os) and cancer-specific survival (css) in patients with prostate cancer (pc) who have undergone combined hormonal-radiation therapy. material and methods. in order to assess the prognostic significance of psad we retrospectively analyzed outcomes of 714 pca patients who received combined hormonal-radiation therapy at the a.m. granov Russian scientific center of Radiology and surgical technologies, ministry of Healthcare of Russia, between January 1996 and december 2016. since the prognosis and management differ according to the extent of tumor involvement, patients were categorized into localized (n=272), locally advanced (n=231) and metastatic (n=211) pc groups. We equentially applied Roc-analysis, Kaplan-meier product limit estimator and cox proportional hazards model to assess the prognostic relevance and establish threshold values of psad that had a significant impact on survival rates. results. in the localized pc group, psad threshold values of 0.34 ng/ml/cc and 0.36 ng/ml/cc were associated with a decrease in os and css, respectively. patients with “low” psad had significantly better os and css survival rates in both uni- and multivariate analyses. in locally advanced pc group, psad threshold values were 0.28 ng/ml/cc and 0.63 ng/ml/cc for os and css, respectively. However, exceeding the specified values, in the locally advanced pc group, was not accompanied by a statistically significant decrease in survival rates. Finally, in the metastatic pc group, established psad threshold values were 2.25 ng/ml/cc and 2.30 ng/ml/cc for os and css, respectively. according to the results of univariate analysis, patients with “low” psa tend to demonstrate statistically significant better os and css rates. the results of multivariate analysis, however, failed to prove psad as an independent prognostic factor within the metastatic pc cohort. conclusion. psa density is a reliable tool for assessing survival rates in patients with localized pc who have undergone combined hormonal-radiation therapy.
Prostate cancer, prostate-specific antigen density, combined hormonal-radiation therapy, survival rate, treatment outcomes
Short address: https://sciup.org/140294392
IDR: 140294392 | UDC: 616.65-006.6-059-037:[615.357+615.849] | DOI: 10.21294/1814-4861-2022-21-3-12-23
Плотность простат-специфического антигена как прогностический фактор у больных раком предстательной железы, перенесших комбинированное гормонолучевое лечение
Целью исследования явилась оценка значимости плотности простат-специфического антигена (пПСА) в качестве предиктора общей (ОВ) и опухоль-специфической выживаемости (ОСВ) у больных раком предстательной железы (РПЖ), перенесших комбинированное гормонолучевое лечение. Материал и методы. С целью оценки прогностической значимости пПСА проведен ретроспективный анализ результатов лечения 714 пациентов c РПЖ, получавших комбинированную гормонолучевую терапию в ФГБУ «РНЦРХТ им. акад. А.М. Гранова» Минздрава РФ в период с января 1996 по декабрь 2016 г. В зависимости от распространенности опухолевого процесса пациенты были разделены на группы локализованного (n=272), местнораспространенного (n=231) и метастатического РПЖ (n=211). Для оценки прогностической значимости и установления пороговых значений признака пПСА, достоверно влиявших на показатели выживаемости, нами были последовательно применены методы Roc-анализа, множительных оценок Каплана-Мейера и модель пропорциональных рисков Кокса. Результаты. Значения признака пПСА у больных локализованным РПЖ, превышение которых сопровождалось снижением показателей ОВ и ОСВ, составили 0,34 нг/мл/см3 и 0,36 нг/мл/см3 соответственно. Больные с «низкой» пПСА демонстрировали достоверно лучшие показатели ОВ и ОСВ по результатам как однофакторного, так и многофакторного анализа. Пороговые значения признака пПСА у больных местнораспространенным РПЖ составили 0,28 нг/мл/см3 и 0,63 нг/мл/см3 для ОВ и ОСВ соответственно. Превышение указанных значений в группе больных местнораспространенным РПЖ, однако, не сопровождалось статистически достоверным снижением показателей выживаемости. У больных метастатическим РПЖ пороговые значения признака пПСА составили 2,25 нг/мл/см3 и 2,30 нг/мл/см3 для ОВ и ОСВ соответственно. По результатам однофакторного анализа больные генерализованным РПЖ с «низкой» пПСА демонстрировали статистически значимо лучшие результаты ОВ и ОСВ. По результатам многофакторного анализа, однако, выявленные тенденции не подтвердились. Выводы. Плотность ПСА является надежным инструментом оценки показателей выживаемости больных локализованным РПЖ, перенесших комбинированное гормонолучевое лечение.
Text of the scientific article Prostate specific antigen density as a prognostic factor in patients with prostate cancer treated with combined hormonal radiation therapy
Over the decades urological society has witnessed prostate cancer (PC) evolution from an uncommon disease to one of the most prevalent cancers among men; from a clinically significant tumor at presentation to an asymptomatic, routinely, often accidentally diagnosed cancer; from one of the most lethal medical conditions to an illness than may span an entire life of a patient, often resulting in death of latter from a completely different cause [1]. Notwithstanding the remarkable progress in detection and care, PC remains a relevant public health issue. Currently, it is the second most prevalent malignant tumor among male population in Russia, and most prevalent in men over 60 years old [2]. Up to 40 % of them, at the moment of presentation, harbor locally advanced or metastatic forms of the disease [3].
PC risk stratification traditionally is being held on a combination of serum prostate-specific antigen (PSA) level, findings on digital rectal examination (DRE) and Gleason score assigned by the results of initial biopsy [4] – a set of criteria originally proposed by D’Amico et al. [5]. In some cases, these may also be supplemented by the imaging (radionuclide bone scan, computed tomography (CT) of the abdomen and pelvis, magnetic resonance imaging [MRI]) and molecular (genomic) studies [6]. Despite the extensive appreciation of the aforementioned risk group stratification, important shortcomings of utilizing such an approach exist. One should keep in mind that the initial evaluation may significantly under or overestimate the extent and/or aggressiveness of disease. Factors that need to be considered when relying on clinical staging include volatility in DRE findings interpretation, variability in Gleason score assigning, and sampling errors in the prostate biopsy that may result in omission of areas with higher malignant potential. Inaccuracies in the initial evaluation may lead to the inappropriate control over biologically aggressive tumors as well as selection of treatment modalities with inferior therapeutic potential, which may ultimately have an adverse effect upon patient outcome. Thus, the area of scientific investigation should focus on determining factors that might facilitate identification of patients potentially harboring clinically significant disease.
Purpose. To evaluate prostate specific antigen density (PSAD) as a predictor of overall (OS) and cancer-specific survival (CSS) in patients with prostate cancer (PC) who have undergone combined hormonal-radiation therapy.
Objectives
The primary study objective was to evaluate PSAD as a predictor of OS and CSS in patients with localized PC who underwent combined hormonal-radiation therapy. The secondary study objective was to assess PSAD OS and CSS predicting ability among patients with locally advanced and metastatic PC who underwent combined hormonal-radiation therapy.
Material and Methods
After obtaining Institutional Review Board approval, all patients undergoing combined hormonal-radiation therapy for PC at A.M. Granov Russian Scientific Center of Radiology and Surgical Technologies, Ministry of Healthcare of Russia were identified and evaluated for study feasibility from prospectively recorded and maintained PC database [13]. Inclusion criteria were as follows: histologically verified PC, proper T staging according to the TNM classification, 5th-7th edition. Further staging was performed with bone scan and pelvic MRI in all men with serum PSA concentration >10 ng/ml. Patients who were treated with therapeutic agents that could interfere with baseline PSA concentration, or did not receive androgen deprivation therapy (ADT) were excluded from the study. All patients with missing data regarding baseline serum PSA concentration as well as prostate volume measurements required for PSAD calculation were also excluded from the study.
All clinical and pathological data was collected retrospectively and analyzed prospectively. PSAD was calculated by dividing baseline serum PSA values by transrectal ultrasound (TRUS) determined prostate volumes using the truncated cone formula: 0.52 × (L × W × H) cm3, where the length (L), width (W) at the greatest diameter, and the height (H) at greatest height. Prostate volume estimation on the basis or TRUS data was associated with the availability of these findings among all patients included into the study. In addition, recent investigations have proven that prostate volume measured by TRUS does perfectly correspond to the actual weight of a surgical specimen [14]. Ever since the prognosis and management differ according to the extent of tumor involvement, patients were categorized into localized (cT1–2N0M0, n=272), locally advanced (T3–4N0M0, T1–4N1M0, n=231) and metastatic PC (T1–4N0–1M1, n=211) groups.
External beam radiation therapy
EBRT was carried out by bremsstrahlung radiation on linear electron accelerators with a boundary radiation energy from 6 to 18 MeV. Patients with localized PC received the total EBRT dose of minimum 72–73 Gy in the standard fractionation mode by delivering 3 Gy daily to a local field, which included the prostate gland, periprostatic tissue, and seminal vesicles. Patients suffering from locally advanced PC received EBRT in two steps: the first step included irradiation of the whole pelvis field, which comprised the prostate gland, periprostatic tissue, seminal vesicles, and locoregional pelvic lymph nodes, using a four field technique. The whole pelvis was treated to a dose of 50–52 Gy delivered in 25–26 fractions. This was followed by a CT-guided cone down to a local field, as described above. Total EBRT dose in patients with metastatic skeletal bone lesions were determined at the discretion of each physicist. The most frequently used dosage was 20 Gy by 2 Gy daily to the site of bone lesion. Thereafter patients received regional and local radiation therapy according to the regimens mentioned previously.
Androgen deprivation therapy
ADT was performed using gonadotropin releasing hormone agonists and/or anti-androgen drugs. In order to achieve castration testosterone level a portion of patients underwent bilateral orchiectomy.
Statistical analysis
Normally distributed continuous variables are presented as means with their respective standard deviation. To compare the means of two normally distributed continuous variables an independent samples t-test was applied. Non-normally distributed continuous variables are given as medians with associated ranges, and differences between groups assessed using the Mann Whitney U-test. Categorical variables data are given as proportions, and differences between subsets are examined using Pearson’s chi-squared or Fisher’s exact test, as applicable. In order to assess PSAD overall performance in survival predicting, receiver operating characteristic (ROC) curves were plotted and the area under the curve (AUC) calculated. According to threshold values established by the results of ROC-analysis, patients were distributed into “low” and “high” PSAD groups.
The follow-up duration was calculated as the period between the date of diagnosis and the date of death or last contact. Patients were censored at the last information before 5th November 2021. OS was determined as the length of time from EBRT to death due to any cause, regardless of recurrence. CSS was defined as duration from the date of EBRT to the death due to PC progression other than other cases. OS and CSS curves were plotted by the Kaplan–Meier product limit estimator and were compared between subgroups using the log-rank test.
In univariate analyses, the following prognostic factors were evaluated for their potential associations with OS and CSS outcomes: age at the moment of diagnosis, baseline serum PSA concentration, PSAD, PSA doubling time (PSADT), Gleason score, total EBRT dose. Cox proportional hazards model was applied to evaluate associations between several potential prognostic factors and time-to-event outcomes. Multivariate models were created using variables that showed significant association (p<0.05) with outcomes of interest on univariate analysis. All tests were two-tailed, and considered statistically significant at p<0.05. The statistical software Medcalc version 19.1.3 (MedCalc Software Ltd, Acacialaan 22, 8400 Ostend, Belgium) was used for all statistical analyses.
Results
Out of a total 5500 patients who underwent EBRT at the A.M. Granov Russian Scientific Center of Radiology and Surgical Technologies, between January 1996 and December 2016, 714 patients were eligible for this study. The median follow-up time for patients with localized PC was 139.0 (range 90.0 to 171.0) months, for patients with locally advanced PC – 114.0 (range 73.0 to 148.0) months and 45 (range 24.2 to 98.7) months for patients with metastatic PC. Median age at diagnosis for localized PC was 67.4 (range 61.5 to 71.6) years, for locally advanced PC – 65.3 (range 60.2 to 71.0) years, while mean age for men with metastatic PC was 63.5 ± 7.6 years. A baseline median PSA (ng/mL) concentration was 16.8 (range 10.2 to 27.0), 18.3 (range 10.0 to 36.9) and 54.4 (range 25.1 to 150.0) for patients with localized, locally advanced and metastatic PC, respectively. The median PSADT for patients with localized, locally advanced and metastatic PC were as follows: 36.6
(range 11.3 to 43.8), 28.9 (7.4 to 43.3) and 3.16 (range 1.3 to 9.8) months. Finally, PSAD values, according to the tumor process extent distributed as follows: 0.45 (range 0.26 to 0.83) for localized PC, 0.53 (range 0.25 to 1.08) for locally advanced disease and 1.52 (range 0.61 to 3.79) ng/mL/cc for metastatic PC. Gleason score was available among 509 patients. Within the localized PC group 98 (36.0 %) patients exhibited <7 Gleason score, 67 (24.6 %) patients had a Gleason score equal to 7, while 31 (11.3 %) men had a Gleason score >7. Within the locally advanced PC group 49 (21.2 %) patients had Gleason score of <7, 63 (27.2 %) patients had Gleason score 7, and 60 (25.9 %) patients had low differentiated tumors represented as Gleason score 8-10. Lastly, among group diagnosed with metastatic PC – highly differentiated tumors (Gleason score <7) were identified in 22 (10.4 %) patients, moderately differentiated (Gleason score 7) in 43 (20.3 %) patients, whereas 76 (36.0 %) of men had tumors, corresponding to a Gleason score >7. The results of univariate analysis of variables in relation to OS and CSS are summarized in Table 1 and 2, respectively.
Localized PC
The results of univariate analysis of variables related to OS (table 1) suggest that investigated groups were comparable in terms of age and radiation dose exposure (p>0.05). Alive patients had significantly lower baseline PSA concentration (p=0.02) and PSAD (p=0.04). Well-differentiated tumors were more likely to be observed within a group of alive patients (p=0.0009). PSADT did not differ statistically between two groups (p>0.05). Univariate analysis of main variables affecting CSS (table 2) has revealed that the group of alive patients had a greater probability of having lower PSA (p=0.0001) and PSAD (p<0.0001) values, and a longer PSADT (p=0.002). Patients, who have died as the result of PC progression had a better chance of being diagnosed with PC at younger age (p=0.006) as well as a harboring more aggressive subtype of the disease (p=0.0056). No difference in terms of total EBRT dose was observed within CSS groups.
Locally advanced PC
According to the analysis of variables affecting OS (table 1), one can notice that groups differ significantly in terms of age at the moments of diagnosis (p=0.003) and Gleason score. Well-differentiated tumors were observed more often within censored patients’ group (p<0.0001). At the same time, regardless of group affiliation, differences in baseline PSA, PSAD, PSADT levels and the amount of total radiation dose received remained statistically insignificant (p>0.05). CSS (table 2), on the other hand, has demonstrated correlation with the baseline serum PSA concentration and tumor aggressiveness. Alive patients were more likely to exhibit lower PSA values (p=0.02) as well as table 1/Таблица 1
Variables associated with overall survivalОбщая выживаемость с учетом основных характеристик
Metastatic PC
PSAD prognostic value
We further applied ROC-analysis to determine the threshold of PSAD, which, if exceeded, would be accompanied with a decrease in survival probability. The results are presented in Table 3. Subsequently, table 2/Таблица 2
Variables associated with cancer-specific survivalОпухоль-специфическая выживаемость с учетом основных характеристик
|
Localized PC/ Локализованный РПЖ |
Locally advanced PC/ Местнораспространенный |
Metastatic PC/ Метастатический |
|
|
Variable/ |
РПЖ |
РПЖ |
|
|
Признак |
Censored/ Death/ Цензури- Смерть рованный |
р Censored/ р Death/ Цензури- Смерть рованный |
Censored/ р Death/ Цензури- Смерть рованный |
|
Age (years), Median (IQR)a/ Возраст (лет), Медиана (IQR)a |
67.7 (62.1–27.0) |
64.0 (59.1–68.8) |
0.006 |
66.7 (60.8–71.3) |
63.7 (59.6–68.8) |
>0.05 |
63.7 ± 7.1 |
63.4 ± 7.8 |
>0.05a |
|
PSA (ng/mL), Median (IQR)/ ПСА (нг/мл), Медиана (IQR) |
15.0 (9.6–26.0) |
22.4 (16.0–36.7) |
0.0001 |
17.6 (9.5 – 31.8) |
29.7 (11.6– 48.9) |
0.0261 |
41.1 (18.3–86.1) |
58.8 (30.0– 167.6) |
0.0104 |
|
PSAD (ng/mL/cc), Median (IQR) пПСА (нг/мл/см3), |
0.42 (0.22–0.76) |
0.66 (0.43–1.27) |
<0.0001 |
0.51 (0.25 – 0.93) |
0.63 (0.24–1.2) |
>0.05 |
1.06 (0.39–2.15) |
1.72 (0.70–5.79) |
0.0062 |
|
Медиана (IQR) |
|||||||||
|
PSADT (months), |
|||||||||
|
Median (IQR)/ |
36.6 |
7.5 |
0.002 |
29.2 |
28.6 |
>0.05 |
15.4 |
2.1 |
<0.0001 |
|
ВУПСА (мес), Медиана (IQR) |
(12.6–47.9) |
(1.3–36.6) |
(8.1 – 53.3) |
(7.1 – 36.6) |
(3.5–35.6) |
(1.0–5.2) |
|||
|
Gleason score/ Индекс Глисона |
0.0163 |
0.0001 |
<0.0001 |
||||||
|
<7 |
93 (41.5 %) |
5 (10.4 %) |
<0.0001 |
41 (24.5 %) |
8 (12.5 %) |
0.0489 |
13 (24.0 %) |
9 (5.7 %) |
0.0004 |
|
7 |
54 (24.1 %) |
13 (27.0 %) |
>0.05 |
55 (32.9 %) |
8 (12.5 %) |
0.0016 |
16 (29.6 %) |
27 (17.1 %) |
0.051 |
|
>7 |
20 (8.9 %) |
11 (22.9 %) |
0.0056 |
37 (22.1 %) |
23 (35.9 %) |
0.0329 |
17 (31.4 %) |
59 (37.5 %) |
>0.05 |
|
Unknown/ Неизвестно |
57 (25.4 %) |
19 (39.5 %) |
0.0485 |
34 (20.3 %) |
25 (39.0 %) |
0.0036 |
8 (14.8 %) |
62 (39.4 %) |
0.0007 |
|
Local irradiation total |
|||||||||
|
dose, Gy Median (IQR)/ |
73.0 |
72.0 |
>0.05 |
73.0 |
72.0 |
>0.05 |
73.0 |
72.0 |
>0.05 |
|
Локальное |
(71.0–75.0) |
(72.0–74.0) |
73.0–73.0 |
71.0–73.0 |
72.0–74.0 |
71.0–73.0 |
|||
|
облучение, Гр Медиана (IQR) |
|||||||||
|
Regional irradiation |
|||||||||
|
total dose, Gy Median (IQR)a/ Регионарное облучение, Гр Медиана (IQR)a |
N/A |
N/A |
N/A |
50.5 49.7–51.0 |
50.5 49.7–51.0 |
>0.05 |
52.3 ± 2.2 |
52.3 ± 2.2 |
>0.05a |
Note: a – Mean & standard deviation for metastatic PC; IQR – interquartile range.
Примечание: a – Среднее арифметическое и стандартное отклонение для группы метастатического РПЖ; IQR – межквартильный размах.
according to the established PSAD threshold values, patients were subdivided into “high” and “low” PSAD subgroups.
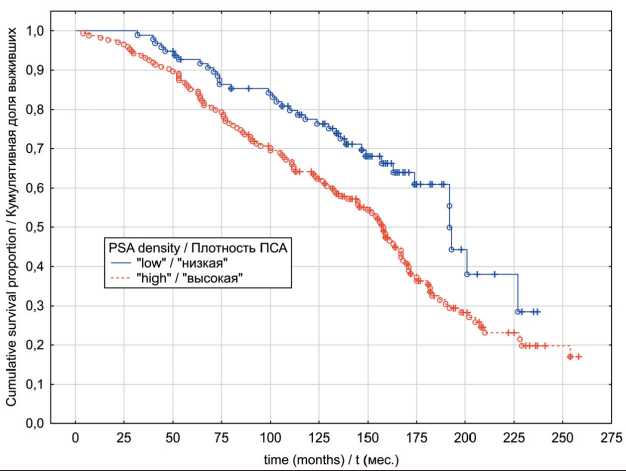
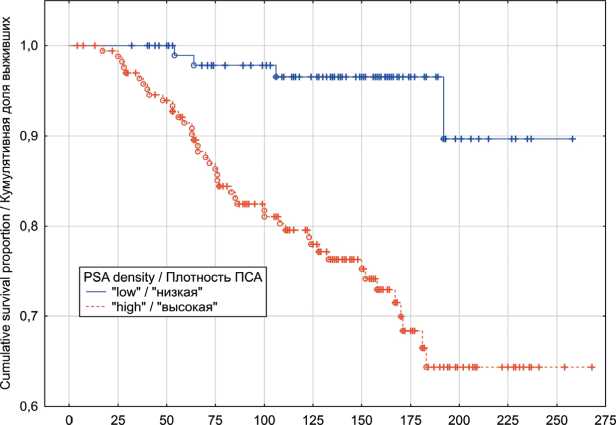
In the localized PC group, univariate analyses indicated that patients exhibiting “low” PSAD values have had significantly better OS (p log-rank=0.0003) and CSS (p log-rank<0.0001) rates (Fig. 1 and 2). The results of multivariate analysis identified baseline PSA concentration, high PSAD and Gleason score 8-10 as independent factors associated with poor OS and CSS outcomes (table 4). Within the locally advanced PC group, univariate analyses failed to confirm PSAD prognostic relevance (p log-rank>0.05) regardless of the outcome (Fig. 3 and 4). Finally in metastatic PC group, patients with higher PSAD had significantly worse OS (p log-rank=0.02) and CSS (p log-rank=0.0005) rates (Fig. 5 and 6). On the basis of Cox proportional hazard model, however, PSADT has proven to be the only independent prognostic factor, associated with survival outcomes in metastatic PC group (table 4).
Discussion
Whereas PSA appears to be a central component of PC risk stratification algorithms – its baseline concentration is by no means being universally reflective of true tumor burden, as PSA values are prone to significant fluctuations [15, 16]. Moreover, since it is produced by both benign and malignant prostatic epithelial cells, serum PSA levels may table 3/Таблица 3
the roc-curve characteristicsХарактеристики roc-кривой
cox proportional-hazards regression analysis resultsРезультаты анализа пропорциональных рисков кокса
|
Variable/Признак |
b |
SE |
Wald Statistics/ Тест Вальда |
p |
Exp (b) |
Exp (b) 95 % CI/ 95 % ДИ для Exp (b) |
|
Localized PC, overall survival/Локализованный РПЖ, общая выживаемость |
||||||
|
Baseline PSA concentration/ Исходная концентрация ПСА |
0.050 |
0.014 |
11.28 |
0.0008 |
1.0516 |
1.02–1.08 |
|
“high” PSA density/ «высокая» плотность ПСА |
0.724 |
0.219 |
10.91 |
0.0128 |
2.064 |
1.43–2.96 |
|
Gleason score ≥ 8/ Индекс Глисона ≥ 8 |
1.263 |
0.413 |
9.32 |
0.0023 |
3.536 |
1.57 –7.95 |
|
Localized PC, cancer |
specific survival/Локализованный РПЖ, опухоль-специфическая выживаемость |
|||||
|
“high” PSA density/ «высокая» плотность ПСА |
1.456 |
0.356 |
16.67 |
<0.0001 |
4.290 |
2.13–8.63 |
|
Gleason score ≥ 8/ Индекс Глисона ≥ 8 |
2.035 |
0.818 |
6.17 |
0.013 |
7.652 |
1.53–38.09 |
|
Metastatic PC, overall survival/Метастатический РПЖ общая выживаемость |
||||||
|
PSADT/ ВУПСА |
–0.053 |
0.017 |
9.003 |
0.0027 |
0.947 |
0.91–0.98 |
|
Metastatic PC, cancer- |
specific survival/Метастатический РПЖ, опухоль-специфическая выживаемость |
|||||
|
PSADT/ ВУПСА |
–0.093 |
0.0285 |
10.62 |
0.0011 |
0.911 |
0.86–0.96 |
time (months) /1 (мес.)
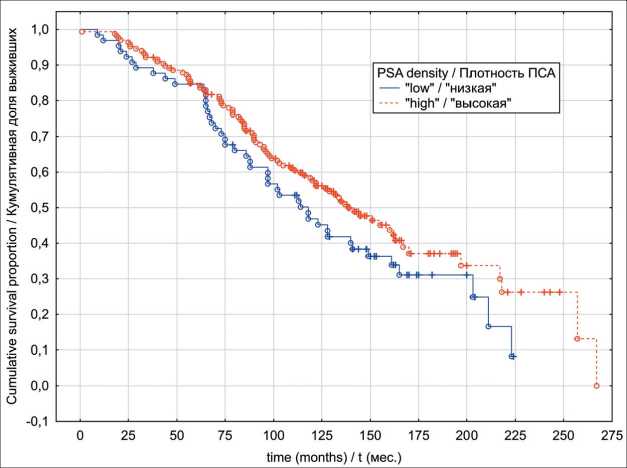
Fig. 1. Localized prostate cancer overall survival in relation to PSA density Рис. 1. Общая выживаемость с учетом показателя пПСА, локализованный РПЖ
-
Fig. 2. Localized prostate cancer cancer-specific survival in relation to PSA density
Рис. 2. Опухоль-специфическая выживаемость с учетом показателя пПСА, локализованный РПЖ
-
Fig. 3. Locally advanced prostate cancer overall survival in relation to PSA density Рис. 3. Общая выживаемость с учетом показателя пПСА, местнораспространенный РПЖ
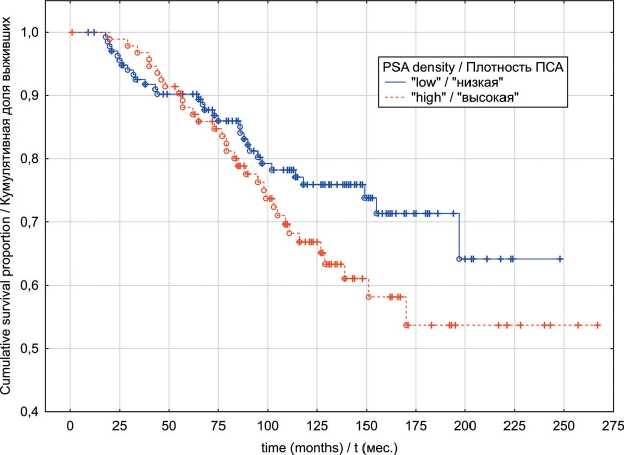
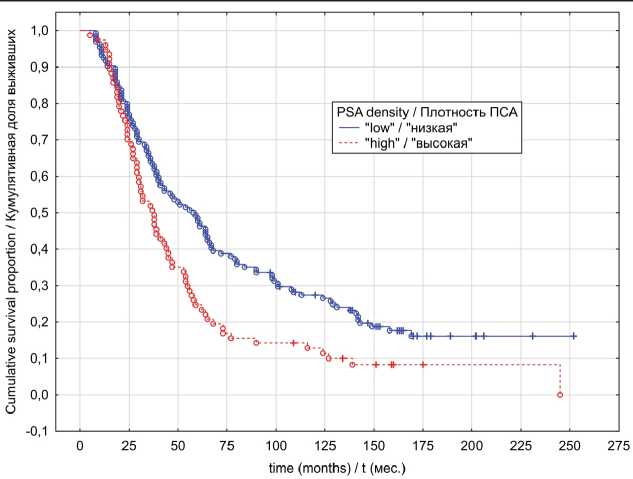
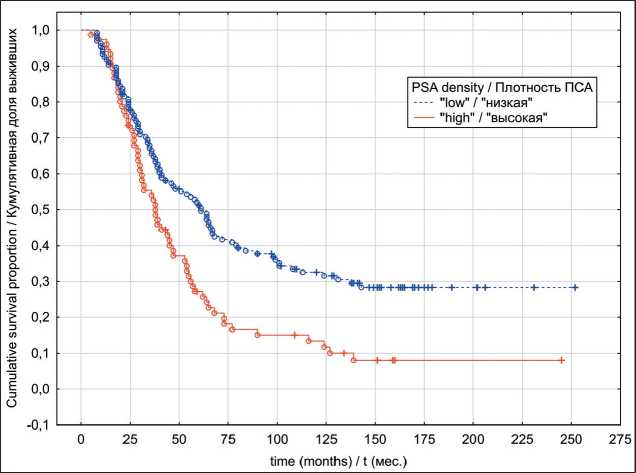
Fig. 4. Locally advanced prostate cancer cancer-specific survival in relation to PSA density
Рис. 4. Опухоль-специфическая выживаемость с учетом показателя пПСА, местнораспространенный РПЖ
Fig. 5. Metastatic prostate cancer overall survival in relation to PSA density Рис. 5. Общая выживаемость с учетом показателя пПСА, метастатический РПЖ
Fig. 6. Metastatic prostate cancer cancer-specific survival in relation to PSA density Рис. 6. Опухоль-специфическая выживаемость с учетом показателя пПСА, метастатический РПЖ overlap considerably in men with benign prostatic hyperplasia (BPH) and those with PC. As an example, one report retrospectively examined preoperative serum PSA in 187 men with a histologic diagnosis of BPH on a transurethral resection of the prostate specimen and 198 men with organ-confined PC as determined by step-section analysis of a radical prostatectomy specimen [17]. The median serum PSA concentrations were 3.9 (range 0.2 to 55) and 5.9 ng/mL (range 0.4 to 58), respectively. Although this difference was statistically significant, the distribution of serum PSA values in both groups overlapped considerably. These findings led scientists to search for more accurate tools of PC prediction. PSA density, on this matter, has clearly illustrated its high predictive ability for PC detection [7]. Furthermore, it has also been shown that PSAD correlates with risk of tumor unfavorable pathological features (upstaging/upgrading, extraprostatic extension and seminal vesicles invasion) detection and biochemical recurrence (BR) following prostatectomy [18, 19]. With the above evidence, it would be logical to assume that PSAD may be a useful predictor of PC survival outcomes, regardless of treatment modality.
The main objective of this study was to investigate the potential impact of PSAD on combined hormonal-radiation therapy outcomes within localized PC patients. Our results indicate significant difference in terms of median PSAD values between alive and deceased patient cohorts in either OS and CSS. However, to represent a useful clinical tool, there must be a PSA density threshold, which, if exceeded, would be associated with an increased probability of an event. In our study, we have determined a PSAD cutoff at 0.34 ng/mL/cc for OS and 0.36 ng/mL/cc for CSS with the best balance between sensitivity and specificity in identifying adverse outcomes that derived from coordination points of the ROC-curve. Our findings indicate in favor of the fact that lower PSAD values were associated with better OS and CSS rates. To our knowledge, to date there are no documented reports aimed to address PSAD significance as a predictor of OS and CSS within PC patients treated with combined hormonal radiation therapy. Existing studies in lieu are focused mainly on evaluation of recurrence-free survival. For instance, Aref et al. demonstrated that, whereas PSAD values > 0.3 ng/mL/cc were accompanied by a statistically significant increase in BR risk in men with PC treated with EBRT, it didn’t appear as an independent prognostic factor of BR [20]. Study reports by Matzkin et al., evaluating outcomes of brachytherapy alone or combined with EBRT within localized PC patients, indicated that men exhibiting PSAD values >0,15 ng/mL/cc had a statistically significant higher risk of BR [10]. Although the suggested PSAD cutoff was lower as compared to our findings, it’s worth noting that the majority of the study cohort (83.6%) belonged to the low-risk progression group with the total Gleason score of ≤ 6.
In contrast, Ingenito et al. [11] reported that in a series of 175 PC patients, only Gleason score was found to exert an independent influence on the biochemical failure (BF) risk following EBRT, while PSAD diagnostic significance has not been confirmed. An important drawback of this study, however, is the heterogeneous nature of the study group, which, aside from localized PC included patients with locally advanced types of the disease. Furthermore, BF was defined as PSA rise of >1 above the nadir, which does not correspond with contemporary guidelines [21]. D’Amico et al. also reported that PC volume and the volume fraction of the gland involved by carcinoma significantly added to the PSA in predicting postradiation PSA failure, while PSAD failed to add considerably in postradiation BF risk estimation [12]. At the same time, similarly to the above-mentioned publication, the main research limitations include the heterogeneous structure of the studied cohort, as well as a comparatively short follow-up period, with a median follow-up of 14 months.
While the results of our study revealed PSAD as an independent prognostic factor of long-term survival among patients suffering from localized PC, it failed to prove sufficient discriminative ability within locally advanced PC group. Surprisingly though, on the basis of univariate analysis PSAD has demonstrated prognostic significance within the metastatic PC group. Since median PSA level in metastatic PC cohort was 54.4 ng/mL (range 40.9 to 67.8) which was significantly higher (p<0.001) than the median PSA of localized PC group 16.8 ng/mL (range 10.2 to 27.0) one possible explanation to these findings, in our opinion, might be attributed to the role of PSA as a confounding factor in the PSAD predicting ability, which, subsequently was proven by the results of multivariate analysis, where PSAD failed to confirm as an independent prognostic factor. These findings again highlight the fact that the PSAD is, apart from being PC specific, in all essence strongly related to prostate volume. In case of tumor spread into surrounding tissues, lymph nodes or distant locations, the proportion of “malignant” PSA, secreted by the bulk of tumor begins to surpass the proportion of PSA secreted by benign prostatic tissue, diminishing, as the result, PSAD forecasting ability.
Several limitations in the present study are worthy of mention. Firstly, selection bias and missing variables are possible due to its retrospective nature. Secondly the single center nature may be the source of limited external validity in addition to a limited number of patients with localized PC. Prospective studies in other populations and larger cohorts are warranted to substantiate and validate our results in the future.
In conclusion, few PC prognosis models include PSAD. According to our analysis there is a substantial value in PSAD in predicting OS and CSS in patients with localized PC treated with combined hormonal-radiation therapy. These findings may have clear implications in the field of selecting appropriate patients for combined hormonal-radiation treatment.
