Пространственно-временное распределение грозовых разрядов по территории Северного региона Азии и его сравнение с солнечной активностью в 2009-2016 гг

Автор: Тарабукина Л.Д., Козлов В.И.
Журнал: Солнечно-земная физика @solnechno-zemnaya-fizika
Статья в выпуске: 2 т.3, 2017 года.
Бесплатный доступ
В течение 2009-2016 гг. на территории с границами 40-80° N, 60-180° E проанализированы вариации грозовой активности, представленной количеством грозовых разрядов по данным Всемирной грозолокационной сети WWLLN. Выделены две области с повышенным уровнем грозовой активности: западный очаг (48-60° N и 60-90° E), восточный очаг (40-55° N и 110-140° E). Плотность грозовых разрядов в этих областях в 10-100 раз превышает плотность разрядов на окружающих территориях. Сравнение вариаций суточного количества грозовых разрядов и потока радиоизлучения Солнца на волне 10.7 см показало слабую линейную корреляцию между ними: коэффициент корреляции от -0.55 до 0.86 для западного региона и от -0.78 до 0.39 для восточного за все летние сезоны. На возрастающей ветви 24-го солнечного цикла происходит пространственное перераспределение количества грозовых разрядов между восточным и западным регионами высокой грозовой активности. В максимумах солнечного цикла и на его спадающей ветви перераспределения становятся не настолько ярко выраженными как во время возрастающей ветви.
Грозовой разряд, пространственное распределение, всемирная грозолокационная сеть
Короткий адрес: https://sciup.org/142103647
IDR: 142103647 | УДК: 551.594 | DOI: 10.12737/22602
Spatial and temporal distribution of lightning strokes over North Asia and its comparison with solar activity variations in 2009-2016
We analyze variations of lightning activity presented by the lightning stroke number obtained by the World Wide Lightning Location Network (WWLLN) within the territory with boundaries 40-80° N and 60-180° E in 2009-2016. There are two regions with high lightning activity: western (48-60° N, 60-90° E) and eastern (40-55° N, 110-140° E). The lightning stroke density in these regions is 10-100 times higher than that in surrounding areas. The comparison between daily variations of lightning stroke number and the 10.7 cm solar radio flux shows no correlation: the linear correlation coefficient varied from -0.55 to 0.86 in the western region and from -0.78 to 0.39 in the eastern region during all summer seasons. During the ascending phase of solar cycle 24, there was a spatial lightning redistribution between the western and eastern regions of high lightning activity. During peaks of the solar cycle and its descending phase, the redistribution was not so pronounced as that during the ascending phase.
Текст научной статьи Пространственно-временное распределение грозовых разрядов по территории Северного региона Азии и его сравнение с солнечной активностью в 2009-2016 гг
The impact of space weather on low atmospheric layers is a great problem. It is important to determine the contribution of space weather to lightning activity, ignoring tropospheric processes [Rycroft, 2014]. Observations in different regions over the world show diverse but certain influence of solar activity on lightning activity. As inferred from regular satellite monitoring over South Asia and Southeast Asia, the lightning activity was in antiphase with solar activity from 2000 to 2010 [Siingh et al., 2013]. The negative correlation between lightning activity and solar activity was also found in [Pinto Neto et al., 1998; Raspopov et al, 2010]. One of the probable processes is solar modulation of galactic cosmic rays, which influence cloud formation. This assumption is confirmed by different long-term observations showing positive feedback between lightning activity variations and galactic cosmic ray flux [Chro-nis, 2009; Ajieva et al, 2010]. Another effect space weather has on the lightning rate is suggested in [Owens et al, 2014; Scott et al, 2014]. Basing on observations of lightning activity made over Great Britain during 6 years, they have found a lightning rate response to the fast solar wind. Arrival of the highspeed stream in Earth also coincides with a small (∼1 %) but rapid decrease in the galactic cosmic ray flux, a moderate (∼6 %) increase in lower energy solar energetic protons (SEPs), and a substantial, statistically significant increase in lightning rates. Also, the significant increase or decrease in the lightning rate and thunder days was found to be consistent with changes of the heliospheric magnetic field polarity. Another probable process of solar modulation of lightning rate is the impact on the global electric circuit and through it on thunderstorms [Harrison et al, 2010].
The object of this study is to estimate the correlation of lightning activity spatial-temporal distribution with solar activity at midlatitudes in northern Asia.
relation coefficient varied from –0.55 to 0.86 in the western region and from –0.78 to 0.39 in the eastern region during all summer seasons. During the ascending phase of solar cycle 24, there was a spatial lightning redistribution between the western and eastern regions of high lightning activity. During peaks of the solar cycle and its descending phase, the redistribution was not so pronounced as that during the ascending phase.
DATA
Lightning data have been obtained by the World Wide Lightning Location Network (WWLLN, URL: , which include more than 50 sensors around the world. One station of the network was installed in Yakutsk in 2009. The area of interest is northern Asia with boundaries 40–80° N and 60–180° E. We consider only the summer season (1 June–31 August) when lightning activity is high over the whole region. The method for locating lightning strokes is based on the time of group arrival (TOGA) of pulses radiated by lightning discharge (sferic) [Dowden et al, 2002]. The network detects more pulses of a cloud-to-ground lightning stroke than pulses of intracloud or intercloud lightning strikes because a receiver used at each station is tuned to very low frequency (VLF) bandwidth (3–30 kHz). The detection efficiency of the system depends on the stroke current and averages around 11–15 % [Hutchins et al, 2012]. The detection efficiency of strokes with current more than 100 kA exceeds 30 % [Abarca et al, 2010]. The amount of network stations has been increasing during years of observation. In 2009, there were 4 stations near or inside the region considered. The network has expanded by about 6 additional stations near to the region; about 7 of these 10 sensors are active nowadays. Due to the small number of stations, the network detection efficiency over the territory of interest is below 15 %.
Data on local thunderstorms are acquired by a one-point lightning detector “StormTracker” of Boltek Corporation. It was installed at Yakutsk in 2009 and has a 480 km radius of detection. The detector allows us to distinguish a type of lightning discharge and its polarity. The device was not changed; it has been working in a stationary mode from 2009 to 2016.
RESULTS AND DISCUSSION
Lightning climatology
Averaged latitudinal and longitudinal variations, derived from summer maps of the total lightning stroke number, show a decrease in the lightning density northward and eastward [Tarabukina et al, 2015]. The high lightning activity zone shifts to the south while moving to the east. There are two regions of high lightning activity, where the lightning stroke density is 10–100 times higher than that in surrounding areas. We call the former region the western region. It is located in the West Siberian Plain (60–90° E). The epicenter of the latter region is in the Amur and Sungari valley (110–140° E). We call it the eastern region. To analyze lightning activity variations in the two storm centers, the western and eastern regions, we consider two zones: western (48– 62° N and 60–90° E) and eastern (40–55° N and 110– 140° E), according to geographical margins of areas with high lightning activity. The western region of high lightning activity is possibly associated with the western zonal flow. Lightning activity in the eastern region is formed due to the East Asian monsoon.
The total annual lightning stroke number, collected from the entire territory under study, had been increasing linearly (the linear function determination coefficient is 0.91) from 2009 to 2016, possibly due to the growing number of stations and increasing detection efficiency. The annual lightning stroke number in the western region had also been linearly increasing from 2010 to 2016 (Figure 1). However, the eastern annual lightning stroke number does not demonstrate such an increasing trend (Figure 1). Variations in the annual total stroke number obtained by StormTracker are well correlated with the eastern annual stroke number: the correlation coefficient is 0.74. So, local thunderstorm activity is influenced by the eastern storm center. The main difference is in 2009: the correlation coefficient is 0.89 for variations occurring since 2010. We can assume that the increasing detection efficiency plays a big role but doesn’t change much the increment of variation. To avoid the influence of the increasing detection efficiency, we use ratios and increments of it or reduce the total lightning stroke number of each year to the total stroke number of the first year of observation – 2009.
There is a strong negative correlation between lightning stroke numbers in the eastern and western regions with high lightning activity (Figure 2, a ): the correlation coefficient is –0.94. The increment of the ratio of the regional annual lightning stroke number to the total number for the entire territory varies with a 1–2-year period (Figure 2, b ), perhaps because of atmospheric quasi-biennial oscillations.
There is an annual redistribution of the lightning stroke number between the western and eastern regions.
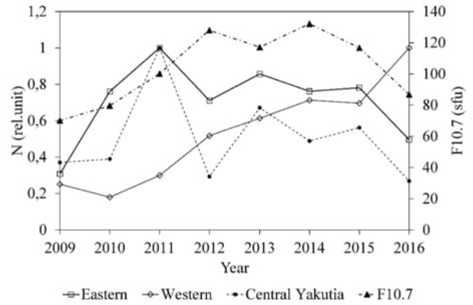
Figure 1. Variations of the annual lightning stroke number normalized to maximum in two regions with high lightning activity from WWLLN and Central Yakutia (Stormtracker detector), and variations of the daily index F 10.7 averaged over summer months
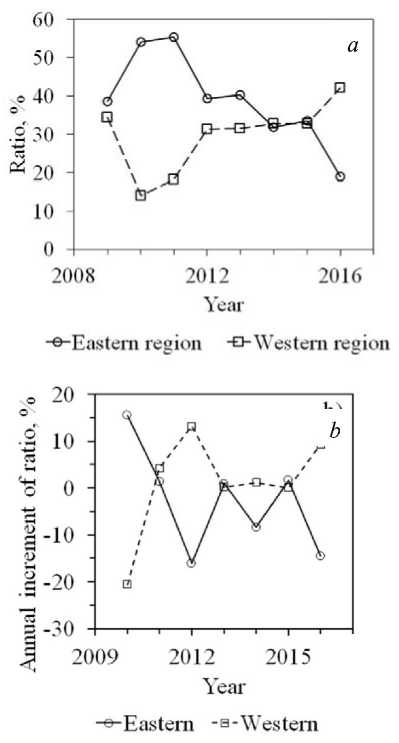
Figure 2. Annual ratio of the eastern and western regional lightning stroke numbers to the total annual lightning stroke number collected from the entire northern part of Asia ( a ); increment of the annual ratio of the eastern and western regional stroke numbers to the total annual number ( b )
After reducing the annual lightning stroke number to the total lightning stroke number in 2009 by averaging annual lightning maps over all latitudes or over all longitudes, we obtained mean longitudinal and latitudinal variations. The latitudinal variation shows that peaks of
high lightning activity differ in latitude: the western region – near 54° N, the eastern – around 47° N. Both the peaks shift northward on average by 1–2 degrees during the first half of summer; during the second half, the peaks return to initial latitudes. The longitudinal variation exhibits lightning activity and location of the two regions with high lightning activity (Figure 3).
In 2009, 2012, 2014, and 2015, both the regions had a comparable activity. But in 2010, 2011, 2013, and 2016, one of these two regions dominated. Such redistribution has a 1–3-year period oscillation. Possibly, in 2009, 2012, 2014, and 2016, the western zonal flow prevailed; and in 2010, 2011, 2013, and 2015, the direction of the zonal flow changed to eastern. Changes of the zonal wind are related to the quasi-biennial oscillation (QBO) of the atmosphere. To try to explain the unregular periodicity in the annual redistribution of the lightning stroke number, we consider the QBO index (Figure 4) [the Earth system research laboratory. URL: ]. The QBO index is calculated for the 30 mb zonal wind at the equator, using the NCEP/NCAR reanalysis. The oscillation propagates in the stratosphere from the equator poleward and to the troposphere [Holton, Tan, 1980; Boville, 1984]. The QBO index in the stratosphere influences the upper tropospheric polar vortex by modulating its strength, perhaps through planetary wave propagation [Baldwin et al, 2001]. However, Devyatova and Mordvinov [Devyatova, Mordvinov, 2009] have not found a regular strong coupling of the polar vortex and the equator QBO. The eastern phase of the zonal-mean flow manifests itself in the increasing rate of the convective cloud formation at tropic latitudes. Yet, at middle latitudes the influence on the tropopause is weaker;
and during the eastern phase, the strong zonal wind across the troposphere can cause a weak cloud formation there [Khairullina, Astafieva, 2011]. So, at middle and high latitudes only the western phase of the zonal flow may force an intense cloud formation. There is a delay of about 2 months between QBO in the stratosphere above midlatitudes and its effect in the troposphere [Kodera et al, 1990]. Therefore we cannot explain the lightning redistribution with the equatorial QBO index as such. Khairullina and Astafieva [Khairullina, Astafieva, 2011] suggest that there are separate extratropical QBO which have a large vertical extension from the stratosphere to the troposphere.
So, taking in account a delay of the oscillation between the equator and midlatitudes, by comparing the QBO index with annual longitudinal variations, we can suppose that in 2009, 2012, and 2014 the westerly direction of the zonal flow prevailed. In 2010, 2011, 2013, and 2015 there was an easterly phase that partially blocked storms in the western region. In 2013 and 2015, the easterly phase was not clearly pronounced, perhaps because of the 2-month delay from QBO peaks at the equator (Figure 4). However, in summer 2016 there was the second local peak of QBO. Instead of the easterly phase, we got the lightning spatial distribution indicating a strong westerly flow that blocked storms in eastern Asia. In summer 2016, there was a local minimum (around 0) in the QBO variation at midlatitudes due to the delay of about 2 months. So, the westerly flow could dominate. To explain the eastern storms blocking, we can assume that the monsoon epicenter shifted southward in latitude. Yet, the averaged latitudinal variation in 2016 exhibits a significant peak at 49° N.
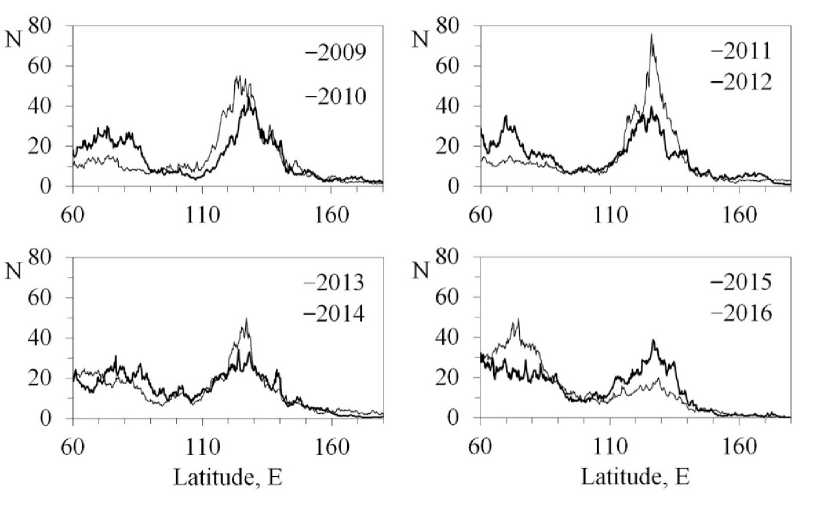
Figure 3. Averaged longitudinal variations of the lightning stroke number reduced to the total number in 2009. The thick line indicates years of quite equal lightning activity in the western and eastern regions
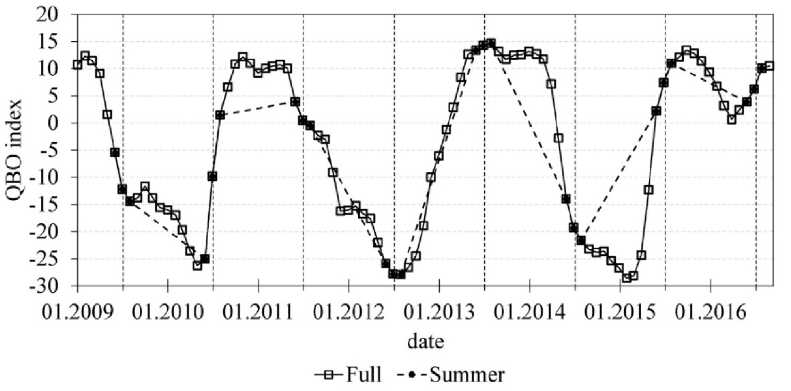
Figure 4. Quasi-biennial oscillation index. Values of the QBO index in summer (June–August) are highlighted and connected by dashed lines. Vertical dashed lines indicate July
|
Year |
2009 |
2010 |
2011 |
2012 |
2013 |
2014 |
2015 |
2016 |
|
Western |
–0.15 |
0.54 |
–0.55 |
0.73 |
–0.2 |
0.43 |
0.86 |
0.22 |
|
Eastern |
–0.49 |
–0.78 |
0.39 |
0.28 |
–0.26 |
0.29 |
0.1 |
0.21 |
Solar activity and lightning rate coupling
To investigate the direct impact of solar activity on lightning variations, we conduct a linear correlation analysis for low frequency variations obtained with moving average filtering. The correlation coefficient of the 27-moving average of daily variations in the lightning stroke number and in F 10.7 varied each year of observation (Table). In addition, given the varying lightning activity over the whole territory, we calculate the correlation coefficient with F 10.7 for every cell of spatial grid (0.25×0.25 degrees). The coefficient does not exceed 0.27. Annual patterns of the correlation coefficient spatial distribution were irregular. Therefore, we may conclude that the linear relation between these parameters is either weak or not evident during one summer season. It can be explained by the complex nonlinear indirect influence of solar activity on climate and atmospheric circulation.
To analyze the correlation of long-period variations, daily variations of the 10.7 solar radio flux are averaged over every summer period (June–August) and are compared with the annual lightning number (Figure 1). Correlation coefficients for the western and eastern region are 0.41 and 0.55. Thus, we cannot suggest that solar activity modulates lightning intensity directly.
Assuming the influence of space weather on the atmospheric circulation, we compare the variation of the ratio of the annual lightning stroke number in the eastern region to that in the western region and the variation of solar activity represented by the summer mean F 10.7 (Figure 5). The ratio of the stroke number widely varied in 2009–2012 during the ascending phase of solar cycle 24. There were two peaks of solar activity in 2012 and 2014. During the peaks and the descending phase of the solar cycle, the ratio varied only slightly. We have two explanations of this effect: 1) it is a coincidence of extremum points in two unrelated oscillation processes of
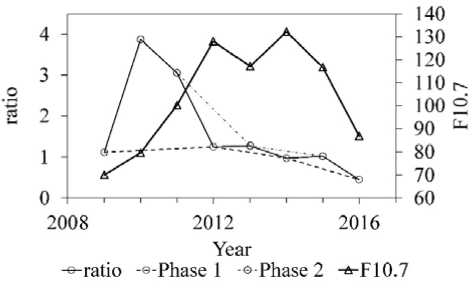
Figure 5. Comparison between variations in the solar radio flux (F10.7) and the ratio of the annual stroke number in two regions with high lightning activity. Dashed lines indicate phases of assumed zonal flow different periods; 2) solar activity modulates or blocks the tropospheric meridional circulation at midlatitudes and high latitudes during its peaks and descending phase.
CONCLUSION
The spatial distribution of lightning activity in northern Asia oscillates with a 1–3-year period. There are two regions of high lightning activity: 48–62° N and 60–90° E, 40–55° N and 110–140° E. The former region is influenced by the western zonal flow and the latter is formed by the East Asian monsoon. These regions show a strong negative correlation of lightning activity between each other.
The influence of solar activity on lightning activity is complex and cannot be found through the assumption of direct lightning rate modulation. The spatial redistribution exhibits an irregularity in oscillation during peaks and descending phase of solar cycle 24, but it should be examined by long-term observation during the whole solar cycle.
The authors wish to thank Mullayarov V.A. and the World Wide Lightning Location Network for collaboration. This research was partially funded by the Russian Foundation for Basic Research, grants Nos 15-45-05005 r_vostok_a and 1545-05135 r_vostok_a, and by the Comprehensive Research Program in the Republic of Sakha (Yakutia).
Список литературы Пространственно-временное распределение грозовых разрядов по территории Северного региона Азии и его сравнение с солнечной активностью в 2009-2016 гг
- Abarca S.F., Corbosiero K.L., Galarneau T.J.Jr. An evaluation of the Worldwide Lightning Location Network (WWLLN) using the National Lightning Detection Network (NLDN) as ground truth. J. Geophys. Res. 2010, vol. 115, no. D18, pp. D18206.
- Adzhieva A.A., Khorguani F.A. Rhythmic variations of lightning processes and solar activity. Doklady Adygskoi (Cherkesskoi) Mezhdunarodnoi akademii nauk . 2010, vol. 12, no. 1, pp. 105-113..
- Baldwin M.P., Gray L.J., Dunkerton T.J., Hamilton K., Haynes P.H., Randel W.J., Holton J.R., Alexander M.J., Hirota I., Horinouchi T., Jones D.B.A., Kinnersley J.S., Marquardt C., Sato K., Takahashi M. The quasi-biennial oscillation. Rev. Geophys. 2001, vol. 39, no. 2, pp. 179-229.
- Boville B.A. The influence of the polar night jet on the tropospheric circulation in a GCM. J. Atmos. Sci. 1984, vol. 41, pp. 1132-1142.
- Chronis T.G. Investigating possible links between incoming cosmic ray fluxes and lightning activity over the United States. J. Climate. 2009, vol. 22, pp. 5748.
- Dowden, R. L., Brundell J. B., Rodger C. J. VLF lightning location by time of group arrival (TOGA) at multiple sites. J. Atmos. Solar-Terr. Phys. 2002, vol. 64, no. 7, pp. 817-879.
- Harrison R.G., Usoskin I. Solar modulation in surface atmospheric electricity. J. Atmos. Solar-Terr. Phys. 2010, vol. 72, pp. 176-182.
- Holton J.R., Tan H.-C. The influence of the equatorial quasi-biennial oscillation on the global circulation at 50 mb. J. Atmos. Sci. 1980, vol. 37, pp. 2200-2208.
- Hutchins M.L., Holzworth R.H., Brundell J.B., Rodger C.J. Relative detection efficiency of the World Wide Lightning Location Network. Radio Sci. 2012, vol. 47, no. 6, pp. RS6005.
- Khairullina G.R., Astafieva N.M. Kvazidvukhletnie kolebaniya v atmosfere Zemli. Obzor: nablyudenie i mekhanizmy formirovaniya . Moscow: IKI RAS, 2011. 60 p..
- Kodera K., Yamazaki K., Chiba M., Shibata K. Downward propagation of upper stratospheric mean zonal wind perturbation to the troposphere. Geophys. Res. Lett. 1990, vol. 17, no. 9, pp. 1263-1266.
- Owens M.J., Scott C.J., Lockwood M., Barnard L., Harrison R.G., Nicoll K., Watt C., Bennett A.J. Modulation of UK lightning by heliospheric magnetic field polarity. Environmental Res. Lett. 2014, vol. 9, no. 11, pp. 115009.
- Pinto Neto O., Pinto I.R.C.A., Pinto O.Jr. The relationship between thunderstorm and solar activity for Brazil from 1951 to 2009. J. Atmos. Sol.-Terr. Phys. 2013, vol. 98, pp. 12-21.
- Raspopov O.M., Mullayarov V.A., Dergachev V.A. About coupling of solar and lightning activities. Trudy 31 konferentsii po kosmicheskim lucham . Moscow, 2010, pp. GEO_36..
- Rycroft M.J. Thunder and lightning -what determines where and when thunderstorms occur? Environmental Res. Lett. 2014, vol. 9, no. 12, pp. 121001.
- Scott C.J., Harrison R.G., Owens M.J., Lockwood M., Barnard L. Evidence for solar wind modulation of lightning. Environmental Res. Lett. 2014, vol. 9, no. 5, pp. 055004.
- Siingh D., Kumar P.R., Kulkarni M.N., et al. Lightning, convective rain and solar activity -over the south/southeast Asia. Atmos. Res. 2013, vol. 120-121, pp. 99-111.
- Tarabukina L.D., Kozlov V.I., Karimov R.R., Mullayarov V.A. Spatial distribution of lightning strikes over North Asia. Proc. SPIE. 21st International Symposium on Atmospheric and Ocean Optics: Atmospheric Physics. 2015, vol. 9680, pp. 96805S.
