Proximity Measurement Technique for Gene Expression Data

Author: Karuna Ghai, Sanjay K. Malik
Journal: International Journal of Modern Education and Computer Science (IJMECS) @ijmecs
Article in issue: 10 vol.7, 2015.
Free access
Data Mining is an analytical process intended to explore the data in search of consistent patterns. Due to its wide spread applications in biomedical industry and publicly available genomic data, data mining has become upcoming topic in the analysis of gene expression data. Clustering is the first step in understanding the complicated biological systems. The objective of clustering is to organize the samples into intrinsic clusters such that samples with high similarity belong to same cluster. The significance of clustering gene profiles is two-fold. Firstly, it assists in diagnosis of the disease condition and secondly it discloses the effect of certain treatment on genes. In this paper, we propose a new method to cluster gene expression data that is solely based on the concept of hierarchical clustering with a different method to compute the similarity between datasets and merge the pairs. The experimental results on two microarray data show the correctness and competence of proposed technique.
Data mining, microarray, gene expression data, hierarchical clustering
Short address: https://sciup.org/15014803
IDR: 15014803
Text of the scientific article Proximity Measurement Technique for Gene Expression Data
Published Online October 2015 in MECS DOI: 10.5815/ijmecs.2015.10.06
Bioinformatics is an interdisciplinary study to understand and dispose the information associated with genomic data and other biological processes using computer, applied math and statistical techniques. Microarray technology measures the expression of thousand of genes simultaneously in a gene expression profiling experiment. It takes into account the intrinsic characteristics of genome wide data. However, to figure out a conclusion that is statistically and biologically justified is a challenge due to the biological complexity of gene expression data.
To extract hidden knowledge from co expression analysis of enormous genome data, data mining is employed on gene expression data [1]. Data mining provides answer to several problems in Bioinformatics [2-4]. There are several major data mining techniques that have been developed and implemented recently including clustering, classification, prediction, association, decision tree and sequential patterns. Data mining technique used in the field of clustering is a subject of active research and assist in biological pattern recognition and extraction of new knowledge from raw data [5]. This resulting true knowledge is useful for decision making. While this whole process comes under KDD (knowledge Discovery in Database), data mining is just a part of it.
Clustering gene expression data has drawn a great deal of attention in scientific community in past few years. Clustering is unsupervised classification that aims to group the functionally correlated genes into one cluster or class. Identifying disease biomarkers for the diagnosis of disease has been improved using several types of clustering methods [6]. In 2000, cheng and church proposed Biclustering [7] of gene expression data. Later loads of clustering algorithms have been introduced such as genetic algorithm [8], particle swarm optimization [9] and many more. A chief drawback of these methods is the requirement for prior knowledge about the number of clusters and sometimes the difficulty of implementation for a novel user as they require specific programming environment. Thus, medical community prefers conventional clustering methods over novel methods. Also, the choice of clustering algorithm is determined by the available data and its application. Prominent categories of clustering methods [10] are: Partition method and Hierarchical method. Partition method works on clustering algorithms such as k-means, fuzzy k-modes [11] but the downside is number of clusters should be known a priori. On the contrary, no prior knowledge is required in hierarchical methods. Most of these algorithms make use of proximity measure [12] to assess the similarity between objects. Accuracy and performance is also governed by the methods used to calculate the proximity which discloses a new area for research scholars [13]. We will discuss some of these methods in details.
The rest of this paper is organized as follows: A review of literature is done in Section II. Our base hierarchical clustering is explained in Section III. Then, we obtain a brief of the existing Proximity measurement techniques in section IV. Next, we introduce our methodology in Section V. Experimental results are presented in Section VI and in the next section we conclude the paper with appropriate biological interpretation of the results in final section.
-
II. Gene Expression Data
Microarray data mining: facing the challenges by Shapiro et al. [1] explained in details the genome-wide molecular sketch of cellular states provided by microarrays. Nearly, all major differences in cell state or type are related with small changes in the mRNA levels of many genes. Different microarray techniques measure the mRNA expression levels. Microarray analysis helps in predicting promising treatment methods and also post treatment outcomes. This paper addressed the major challenges faced by researchers in microarray data mining and facilitates the discovery of new biological knowledge. He also suggested that the main type of data analysis needed to be done for biomedical applications include gene selection, classification and clustering along with the different mechanism for performing an efficient analysis. Microarray data analyses suggest ways for finding significantly co-expressed or associated genes. These genes are somehow related to the disease or condition under investigation. In a paper presented by A. Thalamuthu [14] on evaluation and comparison of gene clustering methods in microarray analysis, by prototyping datasets with various degrees of disruption it gauged a range of gene clustering methods. The paper proposes a new measure known as weighted rand index for estimating the similarity between two clustering results with dispersed genes. The analysis endows with directions for clustering gene expression data and also guides us in the study of microarray data. With both simulated and real datasets, tight clustering and modelbased clustering outperformed other clustering methods time and again as depicted in the results and at the same time hierarchical clustering and SOM are among the worst performers. As gene expression data is highly dimensional, a wide variety of techniques for gene reduction or selection of a subset of genes is essential. An introduction to the fundamental concept of microarray data mining by Xiong et al. [15] described that gene expression profiles may offer more information and helps in the tumor classification. The intention of this scheme was to ensure that the microarray experimental results are not misleading due to some characteristics of gene expression data. The results were mainly used for the classification of tumor tissue and normal tissue. It suggested the application of fisher’s linear discriminant method for selecting the biomarker genes that are supportive for tumor development and serves as potential drug target. In this paper, they gave an overview of gene selection techniques and summarized some of its advantages and practical applications.
According to Rui Xu and Donald Wunsch [16], data analysis plays an indispensable role for understanding various phenomena. Clustering algorithms are reviewed for data appearing in various fields for their pros and cons and also illustrate their applications in bioinformatics. The paper describes the various steps performed in the cluster analysis and validation criteria to evaluate the quality of clustering solutions.
Dynamic clustering gene expression data by lingling and doerge [17] addresses the dynamic nature of biological processes. Expression value of genes at different time and development stages are accessed. Gene expression profiles are dynamically clustered by taking advantage of time frequency theories and techniques. Clustering results are based on the hypothesis that different biological processes are characterized by different spectral frequencies. Cluster validation to expose the exact and natural clusters is done by dynamic index. S. Nagi et al. [18] addressed various approaches for clustering gene expression data such as density based, grid based, model based, partition based, hierarchical and soft computing. Existing popular clustering algorithms were assessed for their efficiency and capability to cluster redundant and high dimensionality data. Prevailing proximity measures were evaluated for their effectiveness. It also took into account diverse problems and research issues in clustering algorithms and recommends possible solution for the challenges in this field. This paper provides a clear difference between co expressed and coherent genes and their utility in clustering techniques. Coherent patterns are assumed to be templates whereas subsequent co expressed genes have similar expression profiles with a little difference in their patterns. Paper provides a completely inclusive study of a variety of the methods for detection of coherent patterns in gene expression profiles. It also counsels the use of some specific datasets for effective interpretation of the clustering results.
Microarray is collection of DNA spots on a solid surface. Scanned images of raw microarray data are generated which are used to measure the expression level of genes in different samples. Preprocessing gene data before obtaining genomic level measurements [19] is crucial since they contain seemingly unrelated gene profiles. The expression level is represented as ratio of pixel intensities of red to green colors. These expressions might represent an increase or reduction from the baseline amount of expression so they must be expressed on logarithmic scale to symmetrically express the fold change. An example of image generated from microarray data is shown in Fig. 1, where yellow spot, red spot and green spot signifies no change in expression, induced (increased) expression and repressed (reduced) expression respectively.
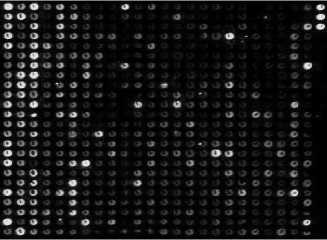
Fig.1. Microarray Data Image
Normalizing the gene expressions is the next step which aims to regulate the data for effects that arise from variation in technology rather than biological differences between samples and printed probes [20]. As a result, a matrix known as gene expression matrix is generated. Rows of gene expression matrix indicate genes and columns indicate samples. Row and column intersections specify expression level of a gene in specific sample.
Analysis can be performed on gene expression data after it has been preprocessed and normalized. Choice of the type of analysis varies with curiosity of the researcher to seek knowledge in that particular field. Types of analysis that can be carried out on gene expression data are:
-
A. Inferential statistics
This type of analysis is executed for the discovery of regulated genes and confidences. Further, a choice of parametric test or non parametric test is available for researchers. t-test is a type of parametric test whereas Mann-Whitney test and Wilcoxon Rank test is non parametric test that results in the genes that are functionally dependent. This results in a metric with p-value and fold change for all the genes in gene expression matrix .
-
B. Descriptive statistics
It is an exploratory technique that binds the correlated objects into one cluster. This binding is achieved by using a similarity measure which is usually the distance between objects. Euclidean distance, Pearson correlation serves as an effective distance measure. A machine learning approach is then applied to recognize the patterns in gene expression profiles. Typically, both supervised learning (classification) and unsupervised learning (clustering) are used to discriminate normal profiles from diseased. Separate algorithms and softwares have been devised for both clustering and classification.
Gene expression matrix is then analyzed using various prevailing clustering algorithms on differentially expressed genes [21]. Differentially expressed genes are those whose value varies considerably in two different categories of samples and are identified by profiling the gene expressions [22]. It is these differentially expressed genes that are used in clustering of the data as there is significant discrepancy in expression value of genes belonging to different category clinical conditions.
-
III. Hierarchical Clustering
Clustering is the process of locating a structure in an assortment of unlabelled data without any training phase. In general, there are many clustering methods that generate the partition results that encourage their assessment. Towards knowledge based Data mining by Ricardo and Blaz [23] explained that by applying the knowledge accumulated from diverse sources, gene expression profile data supplements microarray analysis. Data mining techniques for gene expression data are entailed in this paper with a focus on development of these techniques so as to acknowledge knowledge based data analysis approaches. Clustering methods differ in the way they partition the clusters and assign objects to these clusters. The reason behind huge number of clustering methods is due to vague notion about clusters. A broad classification divides the clustering methods into two groups: Hierarchical and Partition based clustering. Later, three additional methods were also introduced which includes Grid based clustering, density based, model based and soft computing methods. These methods employ different principle for clustering the high dimensional gene expression data. Partition method works on the principle of rearranging the data objects into clusters after the initial random partitioning. The number of clusters into which data is divided is taken as an input parameter from the user. The algorithm adopted for partition based clustering iteratively relocates the objects into clusters to optimize the solution in each step. Grid based clustering is popular method for recognizing patterns in a huge multidimensional space by partitioning the space into cubicle units to appear as a uniform grid. In density based clustering, the data objects in more dense regions are clustered together and those in less dense regions are considered as outliers. The model based method assumes data as a combination of various probability distributions in contrast to other heuristic methods. Particularly, Gaussian mixture model is the most preferred tool out of all the probability distribution models. Data samples belong to more than one clustering in soft computing.
Scientists are embraced by the applications of clustering in fields like biology, life sciences, psychology, botany, sociology and medicine. A partition that brings a group of similar objects into a single cluster is known as a clustering. Statistical data analysis typically exercises this information seeking task of clustering. There are ample of databases containing voluminous microarray data seeking to be analyzed. These databases are growing everyday at an unrivaled rate. Clustering is a crucial task in analyzing the structure of datasets cropping from up abundant gene expression data. Microarray analysis is changing the landscape of researches in medical and life sciences. The hardest problem is to choose the clustering algorithm that works best for the data under study. Different clustering algorithm gives knowledge about different clustering criteria. It is difficult to reach an agreement on which algorithm is best for clustering gene expression data. Hence, it can be concluded that when no preliminary information is available different algorithms are tried to explore microarray data and estimate the optimal solution. Besides, we can choose an algorithm depending upon the behaviour of data. In this paper, Hierarchical clustering algorithm has been used to study the patterns as it is the base algorithm for analysis of gene expression data and does not need definite programming environment. It is best suited for novel researchers.
Hierarchical clustering group data objects based on the similarity measure or association and generates a hierarchical tree called dendrogram. Dendrogram can be cut at specific level to obtain the accurate number of clusters. Unlike partition clustering which clusters the data in one step, it clusters data in subsequently many steps depending upon the size of data. It is also known as connectivity based clustering which aims at clustering the objects based on distance between them. Enormous algorithms have been suggested for computing the distance between these objects [24]. There are two approaches to hierarchical clustering: agglomerative approach and divisive approach. The former integrate clusters and converges to form a single cluster. Later approach successively disintegrates the large clusters into smaller ones. Separate algorithms have been devised for both approaches such as SLINK [25] and CLINK [26] uses agglomerative and graph theoretical algorithms [2728] uses divisive approach.
In cluster analysis, similarity matrix is generated from gene expression matrix of differentially expressed genes. Proximity (similarity) matrix notifies the similarity or distance between two objects. Similarity is drawn using various distance formula including Euclidean, Pearson correlation, spearman correlation and many more. Euclidean distance is one of the most prevalent methods to measure the distance between two objects. The similarity measure given by Euclidean distance is as follows:
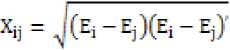
E i and E j is ith and jth sample vector. Although, easy to compute but it also suffer from the problem that scale of measurement of data objects should be standardized.
A linkage criterion decides which data objects should be merged successively. Single linkage merges on the basis of shortest distance between objects in two clusters.
Complete linkage (CLINK) merges on the basis of farthest distance between objects in two clusters i.e. maximum is used instead of minimum.
-
A. Hierarchical Clustering Algorithm:
For hierarchical clustering algorithm, gene expression matrix containing expression values for differentially expressed genes is given as input.
Step 1 : From Gene expression matrix obtain the distance matrix, X = {X ij } where X ij represents the similarity calculated using Euclidean distance.
Step 2 : Find the smallest value X mn from X and merge data objects m and n into a new cluster, say k.
Step 3 : Delete row m and column n from X and add new row and column k in distance matrix defined by linkage criteria. Let y is the number of rows and using single linkage criterion, we update X. The formula for single linkage is:
Xtk = min(dzst(^im,XiR)), i 6 (1.....y)
Step 4 : Repeat step 2 and 3 until all the data objects are clustered.
The result of algorithm is a tree where the data objects are leaf nodes and distance between them are non leaf nodes.
-
IV. Proximity Measurement Technique
Proximity measure also called Similarity measure is a method to compute the similarity between objects. It is of utmost importance to clear the concept of proximity measure in order to apply it to analyze the gene expression data. Earlier, distance calculation methods were used as a proximity measure. These methods determine the distance between two objects in a multidimensional space such as we calculate the distance between two things in real life. The distance is calculated using expression vector containing expression value of all the genes for a particular sample under study. If the objects are close to each other the distance formula assigns them a smaller value and a higher value indicates the objects are far from each other. In recent past, a new measure of similarity called correlation was proposed. It quantifies how correlated the two objects are. The mathematical crux behind clustering is finding the distance between two genes or samples. Once the computation of distance is understood, it is easy to define groups of data.
Similarity could also be measured using correlation coefficient. Correlation measure of similarity stresses on the discrepancy in relationship between gene expression profile vectors compared to distance measures where stress is on relationship between the profile vectors itself. Correlation coefficient is a more useful measure as it expresses the negative and positive correlation between two vectors or samples. By variation in relationship between profile vectors we mean that there should be consistency in the expression values of vectors. The difference between the expression values of two vectors need not to be small as in case of distance measures.
Correlation measures sense the differences in shape in contrast to distance measures that computes the difference between magnitudes of two sample vectors. A correlation measure is suggested for computing similarity if the data contains noise and therefore it is an apt measure for gene expression data that is intrinsically noisy. Correlation is defined as a way of standardization for gene expression data to evaluate the strength of relationship between expression vectors.
-
A. Euclidean distance
The distance is an intuitive measure of similarity. The main advantage of Euclidean distance is its computation time is comparatively less than any other distance. In case of noisy data, Euclidean distance drops its performance which is significant disadvantage that blemish its use for measuring similarity in gene profile pairs. Moreover, the distance suffers from the problem of scaling that it if the two samples have different measurement units they need to be transformed onto the same scale of measurement before calculating the distance between them.
-
B. Pearson Correlation Coefficient
It measures the degree linear dependence between two samples. It assigns a value between -1 and 1 to the proximity measure. A value of 1 indicates that the gene expression vectors are highly correlated and -1 indicates that they are not at all correlated. Pearson correlation can be obtained by dividing the covariance of two vectors with their standard deviations. The coefficient can be measured as:
_ Ек^к-Рех^к-Р;)
^tj 1------------------------------------------7
J^i^"^ ti^-Pj) (3)
µ i is the mean of i th vector, n is the total number of genes one sample, xi j is the i th vector.
Its major shortcoming is it loses its advantage for large samples.
-
C. Kendall Tau Correlation Coefficient
This is a measure of association between two vectors. This coefficient uses ranks instead of actual expression values, so it is non parametric measure of correlation. It is more robust to outliers than spearman correlation and can be calculated using:
C— D
2n(n 1) (4)
C and D represent concordant and discordant pairs.
If there are two vectors
X
1
,...,X
n
and
Y1,...,Y
n
then Concordant pairs are those where if
X
i
>X
j
then
Y
i
>Y
j
or if
X
i
A positive correlation indicates agreement in ranks of both the vectors and a negative value indicates a disagreement. The main advantages of Kendall tau [29] are it provides better results and direct interpretation of measurements. It works equally well with small and large datasets. Computation time and complexity of Kendall tau is its non trivial drawback.
-
D. Spearman’s Rank coefficient
It assigns ranks to vectors and then measures the dependence of relationship between them [30]. It is non parametric measure of strength between two expression vectors. Both continuous and discrete measurements can be evaluated by this coefficient. It works perfectly well with highly dimensional and noisy data. The coefficient can be calculated using formula:
n(n2 — 1) (5)
di is the difference between the ranks of two vectors, n is the dimensionality of a vector.
A value of 1 represents agreement between ranks of two vectors and -1 represents disagreement. The coefficient is more robust than Pearson Correlation. The calculation of spearman correlation is based on deviation.
-
E. Jaccard Coefficient
Jaccard coefficient measures the similarity between two sample vectors by dividing the intersection of samples by their union. The formula for calculating the jaccard similarity between a pair of sample is:
' l-^k + |x?| —x^Xj (6)
The coefficient scales between 0 and 1 where 1 defines that the two sample vectors are similar and 0 defines that they are dissimilar. To represent this similarity coefficient in the form of distance, the values are subtracted from 1. Now, after subtraction if the two sample vectors are similar then the distance between them is 0 and the distance is 1 if they are dissimilar. Jaccard coefficient results in coherent clusters and performance is relatively better than Euclidean distance. It is a measure that does not follow triangle inequality property. Jaccard similarity coefficient is also termed as jaccard index.
-
V. Proposed Technique
Cluster analysis has received a great deal of attention in the field of gene expression. In a multidimensional space it allows for discovery and grouping of analogous objects. In this section, existing proximity measures has been discussed for its disadvantages and how they are overcome by the proposed measure.
Three steps procedure is followed for analyzing the data. Preprocessing of microarray data is step1 followed by identification of differentially expressed genes by profiling gene expression and then clustering is performed by obtaining similarity matrix in the final step. Similarity matrix is a square matrix whose upper triangular values are same as lower triangular values.
Hierarchical agglomerative approach groups object based on similarity of biological pathway. Several measures used to obtain the distance matrix and further cluster the neighbors expressing similar characteristics are Euclidean distance, Pearson correlation coefficient, Kendall tau and Spearman’s rank correlation coefficient. Pearson and Kendall tau correlation coefficients are the baseline of our proposed measure. Euclidean distance does not perform well with shifting profiles [31]. Pearson correlation provides an alternative to this, which measures the linear relationship between two expression profiles for calculating the similarity. The proposed algorithm works similar to hierarchical algorithm but uses a different measure of similarity to group the data objects. Effectiveness of Pearson correlation for gene expression profiles have been recorded [32]. Pearson coefficient is more sensitive to outliers and works with only normally distributed data. So a more robust correlation coefficient,
Spearman and Kendall tau, that address these issues has been suggested. Although, Pearson correlation suffers from some drawbacks but the advantages cannot be overlooked. Our measure is an enhancement of Pearson correlation where we calculate the order of data rather than proportion of variability as in Pearson correlation coefficient. In the proposed method, similarity between two objects of k -dimensions is calculated using:
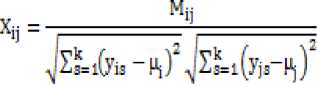
M is the value of genes in concordance in both samples minus the value of genes in discordance in both samples. µi and µ j are mean of ith and jth sample.
The measure is a combination of Kendall tau and Pearson correlation. Pearson correlation evaluate the association of two samples (objects) using covariance and is a parametric measure of correlation whereas Kendall tau evaluates it using concordant and discordant pairs where and discordant pairs where value 1 is assigned if the pair is concordant and -1 if it is discordant. As it does not use actual values to calculate the correlation so it is non parametric measure. Proposed distance formula makes Kendall tau to uses the expression values to calculate the association between two samples instead of ranks and dividing it by standard deviation of both samples to get a parametric measure of correlation.
-
VI. Results and Analysis
To illustrate the efficiency of our proposed method, publically available microarray data sets are used. The data set contain 20 samples derived from the study of Autosomal dominant and sporadic monocytopenia by D.C. Vinh et al., 2009. Expression levels of 54675 genes are included [33]. A total of 742 differentially expressed genes were picked after performing permutation t-test. In Fig. 2, a two sample statistic t-test is performed to evaluate the differential expression of genes from two experimental conditions or phenotypes based on fold change. Data were quantile normalized with intensities on log2 scale.
A convenient approach for retrieving true positive is to plot t-scores. The plot in Fig. 3 shows p-values adjusted for the false discovery rate to interpret q-values. By performing t-test on profiles and picking only those whose t-score is above a certain threshold will disclose the FDR value. The truth of null hypothesis is given by value of π 0
From q-values we can recognize the differentially expressed genes. FDR helps us to distinguish between control and test samples and estimates best value of π 0 under different conditions. Expression matrix consists of only these differentially expressed genes and proximity matrix is prepared using proposed method.
Histograms of t-test Results
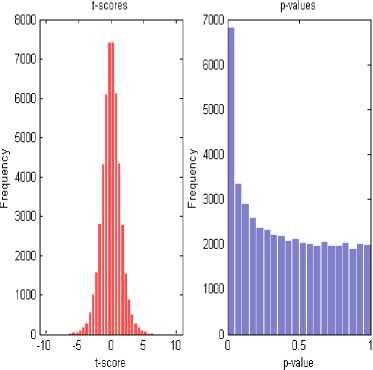
Fig.2. Two Sample T-test
The final result of clustering gene expression data is presented in Fig. 4. Clustering of the most differentially abundant transcripts clearly partitions control and test samples for polymorphonuclear leukocytes (PMNs). Control and test samples form different clusters and if we cut dendrogram at a height of 0.6 then we will get 4 clusters with healthy control and affected patient’s RNA extracted using distinct clinical methods.
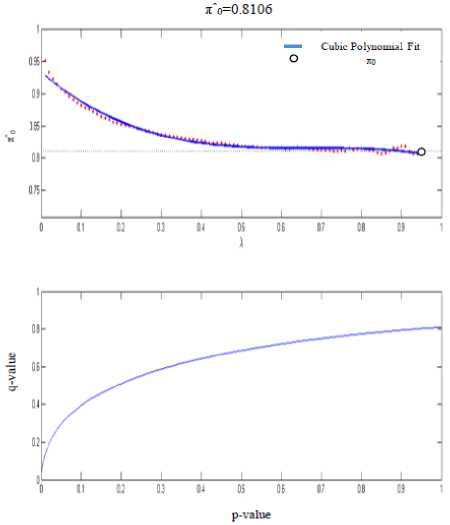
Fig.3. Profiling Gene Expression
The clustergram shown in Fig. 5 assists us in exploring the prominent groups of both samples and genes. By clicking at a particular link, we can know the names of genes involved in that cluster. The color bar along with the cluster gram shows the value of different colors. The red color indicates increased expression values of genes in different color and blue color indicates a decrease in expression values than the base values which is shown by white color. The left side represents clusters formed by bulging number genes.
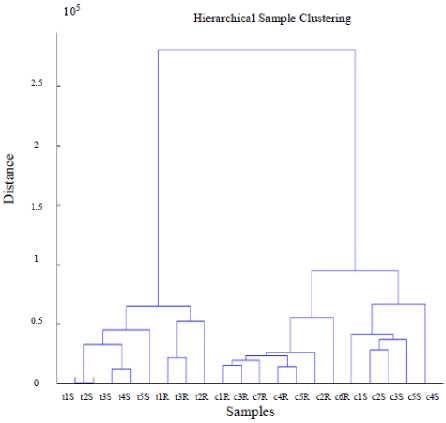
Fig.4. Dendrogram using Proposed Technique
There are a total of 749 differentially expressed genes selected through different tests. The upper side shows the clusters formed by 20 samples in total. The induction or repression in the expression values becomes higher with the increased color that means the darker the color the higher the fold change. This type of visualization is possible only with the use of hierarchical clustering of gene expression data.
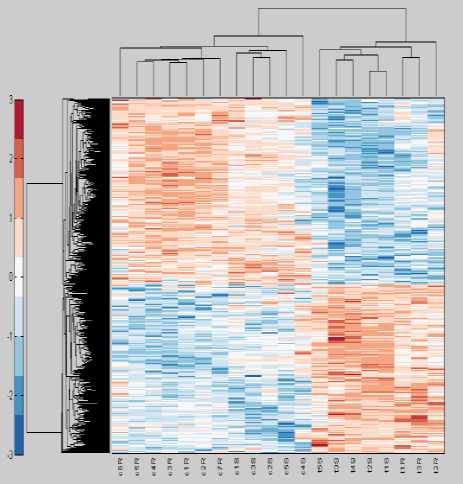
Fig.5. Clustergram using Proposed Technique
-
VII. Conclusion
With the advent of new technology, it is now possible to perform exploratory study on intrinsically complex gene expression data. These studies have also widened the application of data mining in gene expression data. Bioinformatics as a topic for superior quality research has also emerged with this advancement. A rich literature on cluster analysis has been developed. Gene expression data clustering seeks to partition data based on biomarker genes or samples and for this several clustering algorithms and proximity measures had been introduced. Different measures of proximity generate different results and their applicability depends on particular situation and effectiveness solution. Most of the existing proximity measures, evaluate the correlation between samples by assigning ranks to the expression values. These measures produce results that are more robust but the drawback is they do not consider the actual expression values so the association depicted is not an effective measure of correlation.
Through the proposed distance we obtained performance comparable to previously reported distance measures. To check the reliability of our simple yet efficient method, hierarchical clustering was performed on two different data sets. It has been noted that proposed method efficiently clusters the data in both data sets. Cross or cophenetic correlation coefficient is used to evaluate the accuracy of hierarchical clustering and hence validate the clusters formed. The value of this coefficient for the proposed measure is nearly 0.92 which is very good. The closer the value is to 1, the more the accuracy of clustering algorithm. Clusters can also be validated visually by ensuring that braches of dendrogram does not cross each other.
The paper presents an extensive study on the selection of appropriate and efficient Proximity measure which is used in different clustering algorithms for measuring the similarity between two samples so as to group them into clusters. Microarray analysis has received a great deal of attention in recent times due to its widespread applications in different areas. It has been specially employed in the diagnosis of cancer subtypes. In formal terms, microarray analysis problem can be regarded as cluster formation problem with high dimensional and noisy data.
Different measures of proximity generate different results and their applicability depends on particular situation and effectiveness solution. Most of the existing proximity measures, evaluate the correlation between samples by assigning ranks to the expression values. These measures produce results that are more robust but the drawback is they do not consider the actual expression values so the association depicted is not an effective measure of correlation. A new method of finding the proximity has been proposed in this paper. The proximity measure tests the correlation between samples and groups the samples that are more related. It has been noted that the proposed technique performs really well. We have improved the existing measure by making it a parametric and using the true expression values.
-
VIII. Biological Interpretation
Data mining technique used in the field of clustering is a subject of active research and assist in biological pattern recognition and extraction of new knowledge from raw data. Clustering gene expression data resembles the job of extracting useful information voluminous irrelevant data. From biological point of view, the genes that are induced or repressed are more significant than other genes as they were differentially expressed in samples related to healthy person and diseased patients. They contain more biological information and can help in meaningful interpretations of the results obtained from clustering. The result of clustering gene expression profiles as presented by dendrogram shows that there are substantial number of genes that are up or down regulated in two different datasets containing affected and healthy controls. These genes formed different clusters in space showing that they are from two different datasets or clinical conditions. The similarity or degree of correlation can be gauged through the height of the links. If the links have more height then the cluster and subcluster are less correlated. An inverse relation exists between the height and similarity of clusters.
The clustering results can then be used for identification of biomarker genes that is the genes that are differentially expressed in two sample sets. These genes can act as target for microbiologists to discover drugs that can successfully help in treatment of this new disease. The proposed measure that is used to generate the clusters provides extensive knowledge to the researchers and analysts. The clustering results provide a base for the detection and categorization of infectious diseases. The purpose of clustering techniques is to ensure that the genetic targets have been detected.
References Proximity Measurement Technique for Gene Expression Data
- G.P. Shapiro and P. Tamayo, "Microarray Data Mining: Facing the Challenges", SIGKDD Explorations, vol. 5, no. 3, pp. 1-5, 2003.
- A. Bellaachia, D. Portnoy, Y. Chen and A.G. Elkahloun, "E-CAST: A Data Mining Algorithm for Gene Expression Data", Workshop on Data Mining in Bioinformatics, vol. 2, pp. 49-54, 2002.
- J. Li and H.L. Ong, "Feature Space Transformation for Better Understanding Biological and Medical Classifications", Journal of Research and Practice in Information Technology, Vol. 36, 2004.
- Judice L.Y.Koh1, M.L. Lee, A.M. Khan, Paul T.J. Tan1 and V. Brusic, "Duplicate Detection in Biological Data using Association Rule Mining", Proceedings of the 2nd European Workshop on Data Mining and Text Mining in Bioinformatics, pp. 35-41, 2004.
- M. Eisen, P. Spellman, P. Brown and D. Botstein, "Cluster Analysis and Display of Genome-wide Expression Patterns", Proceedings of National Academic Science USA, vol. 95, pp. 14863-14868, 1998.
- L. Wang, F. Chu and W. Xie, "Accurate Cancer Classification Using Expressions of Very Few Genes", IEEE Trans. Computational Biology and Bioinformatics, vol. 4, no. 1, pp. 40-53, 2007.
- Y. Cheng and G.M. Church, "Biclustering of Expression Data", Proceedings of 8th International Conference Intelligent Systems for Molecular Biology (ISMB), vol. 8, pp. 93-103, 2000.
- C.A. Murthy and N. Chowdhury, "In Search of Optimal Clusters using Genetic Algorithms", Pattern Recognition Letters, vol. 17, pp. 825–832, 1996.
- S. Paterlini and T. Krink, "Differential Evolution and Particle Swarm Optimization in Partitional Clustering", Computational Statistics and Data Analysis, vol. 50, pp. 1220–1247, 2006.
- A.K. Pujari, Data mining Techniques, University Press, Hyderabad, 2002.
- Huang and K.N. Michael, "A fuzzy k-modes algorithm for clustering categorical data", IEEE Transaction Fuzzy Systems, vol. 7, no. 4, pp. 446-452, 1999.
- D.T. Nguyen, "Clustering with Multiviewpoint-Based Similarity Measure", IEEE Transactions on Knowledge & Data Engineering, vol.24, no. 6, pp. 988-1001, 2012.
- P.A. Jaskowiak, R.J.G.B. Campello and I.G. Costa, "Proximity Measures for Clustering Gene Expression Microarray Data: A Validation Methodology and a Comparative Analysis", IEEE Transaction on Computational Biology and Bioinformatics, vol. 10, no. 4, pp. 845-857, 2013.
- A. Thalamuthu, I. Mukhopadhyay, X. Zheng and G.C. Tseng, "Evaluation and Comparison of Gene Clustering Methods in Microarray Analysis", Bioinformatics, vol. 22, no. 19, pp. 2405-2412, 2006.
- M. Xiong, W. Li, J. Zhao and E. Biorwinkle, "Feature (Gene) Selection in Gene Expression-Based Tumor Classification", Molecular Genetics and Metabolism, vol. 73, no. 3, pp. 239-247, 2001.
- R. Xu and D. Wunsch, "Survey of Clustering Algorithms", IEEE Transactions on Neural Networks, vol. 16, no. 3, pp. 645-678, 2005.
- A. Lingling and R.W. Doerge, "Dynamic Clustering of Gene Expression", ISRN Bioinformatics, vol. 10, 2012.
- S. Nagi, D.K. Bhattacharyya and J.K. Kalita, "Gene Expression Data Clustering Analysis: A Survey", Proceedings of 2nd IEEE National Conference on Emerging Trends and Applications in Computer Science (NCETACS), 2011.
- R. Gentleman, V. Carey and W. Huber, Bioinformatics and Computational Biology Solutions Using R and Bio conductor, USA, Springer, 2005.
- B. Bolstad, R. Irizarry, M. Astrand and T. Speed, "A Comparison of Normalization Methods for High Density Oligonucleotide Array Data based on Variance and Bias", Bioinformatics, vol. 19, pp. 185-93, 2003.
- I. Jeffery, D. Higgins and A. Culhane, "Comparison and Evaluation of Methods for Generating Differentially Expressed Gene list from Microarray Data", Bioinformatics, vol. 7, pp. 359, 2000.
- I. Jeffery, D. Higgins and A. Culhane, "Comparison and evaluation of methods for generating differentially expressed gene list from microarray data", BMC Bioinformatics, vol. 7, pp. 359, 2000.
- R. Bellazzi and B. Zupan, "Towards Knowledge-Based Gene expression Data Mining", Journal of Biomedical Informatics, vol. 40, pp. 787-802, 2007.
- A.K. Jain, R.C. Dubes, Algorithms for clustering data, Prentice Hall, 1988.
- R. Sibson, "SLINK: An Optimally Efficient Algorithm for the Single-Link Cluster Method", The Computer Journal (British Computer Society), vol. 16 (1), pp. 30–34, 1973.
- D. Defays, "An Efficient Algorithm for a Complete Link Method", The Computer Journal, vol. 20, pp. 364-366, 1977.
- P. Hancen and B. Jaumard, "Cluster analysis and mathematical programming", Mathematical programming, vol. 79, pp. 191-215, 1997.
- A. Ben-Dor, N. Friedman and Z. Yakhini, "Clustering gene expression patterns", Journal of Computational Biology, vol. 6, No. 3/4, pp. 281-297, 1999.
- M.G. Kendall, "A New Measure of Rank Correlation", Biometrika, vol. 30, pp. 81–93, 1938.
- C. Spearman, "The Proof and Measurement of Association between Two Things", American Journal of Psychology, vol. 15, pp. 72–101, 1904.
- H. Wang, W. Wang, Y. Wei, J. Yang, and P.S. Yu, "Clustering by Pattern Similarity in Large Data Sets", Proceedings of ACM SIGMOD International Conference Management of Data, pp. 394-405, 2002.
- D. Jiang, J. Pei, and A. Zhang, "DHC: A Density-Based Hierarchical Clustering Method for Time-Series Gene Expression Data", Proceedings of BIBE2003: 3rd IEEE International Symposium Bioinformatics and Bioengineering, 2003.
- D.C. Vinh, "Autosomal Dominant and Sporadic Monocytopenia with Susceptibility to Mycobacteria, Fungi, Papillomaviruses and Myelodyslasia", Blood, vol. 115, no. 8, pp. 1519-1529, 2010.
