Public opinion monitoring of the state of the Russian society

Author: Ilyin Vladimir Aleksandrovich
Journal: Economic and Social Changes: Facts, Trends, Forecast @volnc-esc-en
Section: From the chief editor
Article in issue: 1 (31) т.7, 2014.
Free access
Short address: https://sciup.org/147223567
IDR: 147223567
Text of the review article Public opinion monitoring of the state of the Russian society
More details on the results of ISEDT RAS polls are available at
Estimation of social condition
The share of positive assessments of social mood and stock of patience on average for the last 6 surveys has increased in comparison with 2012, 2011 and 2007 (68 and 80%, accordingly).
However, in comparison with 2012, there has been a slight increase in the share of the residents, who consider themselves “poor” and “extremely poor” (47%). Over the period of April 2013 – September 2014 their share has not virtually changed.
Table 2. Estimation of social condition, as a percentage of the number of respondents*2
|
2007 |
2011 |
2012 |
2013 |
April 2013 |
June 2013 |
Aug. 2013 |
Оct. 2013 |
Dec. 2013 |
Feb. 2014 |
Average for the last 6 surveys |
Dynamics (+/-), the last 6 surveys in comparison with |
|||
|
2012 |
2011 |
2007 |
||||||||||||
|
Mood |
||||||||||||||
|
Usual condition, good mood |
63.6 |
63.1 |
67.3 |
68.6 |
68.6 |
66.4 |
68.7 |
71.5 |
69.6 |
65.1 |
68.3 |
+1 |
+5 |
+5 |
|
Feeling stress, anger, fear, depression |
27.8 |
28.9 |
27.0 |
26.2 |
26.0 |
25.9 |
26.3 |
24.0 |
26.2 |
27.1 |
25.9 |
-1 |
-3 |
-2 |
|
Stock of patience |
||||||||||||||
|
Everything is not so bad; it is difficult to live, but it is possible to stand it |
74.1 |
74.8 |
76.6 |
79.3 |
77.9 |
77.8 |
79.7 |
81.6 |
83.1 |
79.8 |
80.0 |
+3 |
+5 |
+6 |
|
It is impossible to bear such plight |
13.6 |
15.3 |
15.8 |
14.2 |
16.5 |
13.7 |
14.7 |
12.3 |
12.0 |
12.3 |
13.6 |
-2 |
-2 |
0 |
|
Social self-identification |
||||||||||||||
|
The share of people who consider themselves to have average income |
48.2 |
43.1 |
44.7 |
43.9 |
42.6 |
41.9 |
44.9 |
45.7 |
43.7 |
44.2 |
43.8 |
-1 |
+1 |
-4 |
|
The share of people who consider themselves to be poor and extremely poor |
42.4 |
44.3 |
44.5 |
46.9 |
48.2 |
48.3 |
46.8 |
45.4 |
46.7 |
46.9 |
47.1 |
+3 |
+3 |
+5 |
|
Consumer Sentiment Index |
||||||||||||||
|
Index value, points |
105.9 |
89.6 |
91.5 |
90.3 |
90.4 |
89.8 |
91.0 |
90.4 |
87.9 |
91.5 |
90.2 |
-1 |
+1 |
-16 |
* Ranked according to the average value of the index of success for the last six surveys. For calculating each index the share of negative answers is subtracted from the share of positive answers, after that 100 is added to the obtained figure in order to avoid negative values. Consequently, fully negative answers would give the total index 0, fully positive answers – index 200, the balance between the former and the latter – index 100, which is, in fact, a neutral mark. The index of social strain has a reversed order of values: 0 points is an absolutely positive value, 200 points – an absolutely negative value.
Attitude of the population toward political parties
Positive attitude toward the party of power on average for the last 6 surveys was 29%, which corresponds to the indicators for the previous years.
One can be alarmed by a gradual increase in the share of the oblast residents, who consider that no political party among currently existing ones expresses their interests (in 2007 – 18%, in 2011 – 29%, in 2012 – 31%, on average for the last 6 surveys – 35%).
Table 3. Dynamics of the answers to the question: “Which party expresses your interests?”, as a percentage of the number of respondents
|
Party |
2007 |
^ Q J=C\J S | о t>S шел |
2011 |
SEo оП4-t>S шел |
2012 |
2013 |
April 2013 |
June 2013 |
Aug. 2013 |
Oct. 2013 |
Dec. 2013 |
Feb. 2014 |
Average for the last 6 surveys |
Dynamics (+/-), the last 6 surveys in comparison with |
||
|
2012 |
2011 |
2007 |
||||||||||||||
|
United Russia |
30.2 |
60.5 |
31.1 |
33.4 |
29.1 |
29.4 |
28.5 |
31.3 |
29.6 |
26.9 |
29.5 |
28.3 |
29.0 |
0 |
-2 |
-1 |
|
KPRF |
7.0 |
9.3 |
10.3 |
16.8 |
10.6 |
11.3 |
11.0 |
11.3 |
12.0 |
11.9 |
11.8 |
10.9 |
11.5 |
+1 |
+1 |
+5 |
|
LDPR |
7.5 |
11.0 |
7.8 |
15.4 |
7.8 |
7.2 |
7.1 |
6.6 |
6.8 |
8.4 |
8.1 |
8.9 |
7.7 |
0 |
0 |
0 |
|
Just Russia |
7.8 |
8.8 |
5.6 |
27.2 |
6.6 |
4.6 |
5.1 |
4.7 |
4.3 |
4.0 |
4.4 |
3.5 |
4.3 |
-2 |
-1 |
-4 |
|
Other |
1.8 |
– |
1.9 |
– |
2.1 |
0.6 |
3.4 |
2.0 |
3.4 |
1.0 |
0.8 |
0.4 |
1.8 |
0 |
0 |
0 |
|
No party |
17.8 |
– |
29.4 |
– |
31.3 |
34.9 |
37.1 |
31.7 |
33.4 |
37.3 |
34.4 |
35.2 |
34.9 |
+4 |
+6 |
+17 |
|
It is difficult to answer |
21.2 |
– |
13.2 |
– |
11.7 |
10.2 |
7.8 |
12.3 |
10.5 |
10.5 |
10.9 |
12.7 |
10.8 |
-1 |
-2 |
-10 |
ISEDT RAS has been carrying out a longterm assessments of the attitude of the Vologda Oblast residents to existing power structures and political institutions. The performance indicators are given below.
The graphs, presented hereto, in comparison with those published earlier, take into account the results of assessments obtained during V.V. Putin’s third presidential term, including the results for 2013 in general.
The data show that a sharp increase (in comparison with the period of B. Yeltsin’s presidency) in the level of trust in President V.V. Putin, taking place in 2000–2008, was replaced by a constant decrease of trust in the President (represented by D.A. Medvedev) in 2009–2012, and it has not been restored so far.
We should note that the level of trust in the Church has remained relatively high. The value of the index of trust is higher than that concerning government structures and the majority of political institutions; and it is characterized by stability in all the periods of sociological assessments.
At the same time, there has been an increase of public trust in the Court. 2013 witnessed a positive shift in the trust in the Procuracy, the Federal Security Service, the Army, and the Police – those institutions that are crucial links in the strength of the state system.
So far, it has not been possible to overcome the recession of recent years concerning the trust in the activities of the State Duma and the Federation Council, which indicates that the system of domestic legislation responds untimely to the formation of the legal framework.
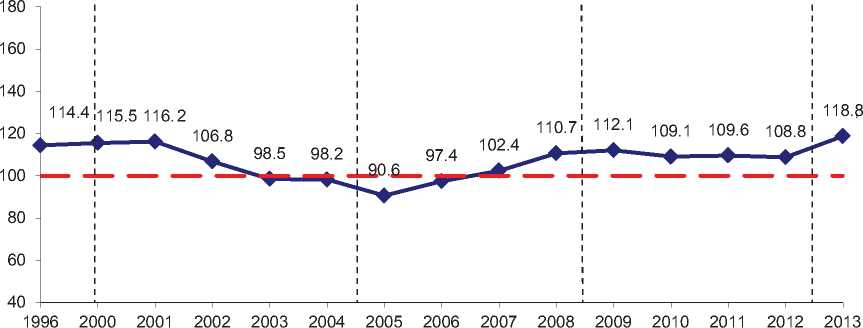
Attitude toward the President of the Russian Federation
RF President V.V. Putin 3 term (May 2012 – present)
RF President
B.N. Yeltsin (November 1996 – December 19 9 9)
RF President
D.A. Medvedev (May 2008 – May 20 12 )
RF President V.V. Putin (January 2000 – April 2000 – acting RF President, May 2000 – May 2004 – 1 term)
RF President V.V. Putin 2 term (May 2004 – May 2008)
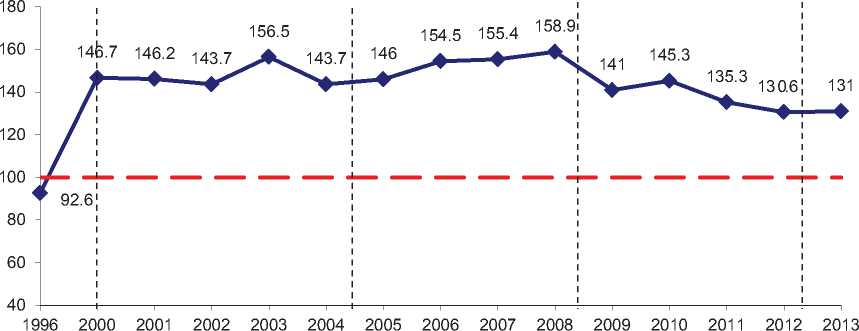
• Index of trust in Russia’s President
The share of the Vologda Oblast residents, who have trust in Russia’s President, did not change significantly in 2013 (47%). In 2010– 2012 there was adecrease in the level of trust (from 145 to 131 points).
Attitude toward the Church
RF President RF President V.V. Putin
D.A. Medvedev 3 term
(May 2008 – May 2012 ) (May 2012 – present)
RF President V.V. Putin
RF President (January 2000 – April 2000 – RF President V.V. Putin
B.N. Yeltsin (November acting RF President, 2 term
1996 – December 1999) May 2000 – May 2004 – 1 term) (May 2004 – May 2008)
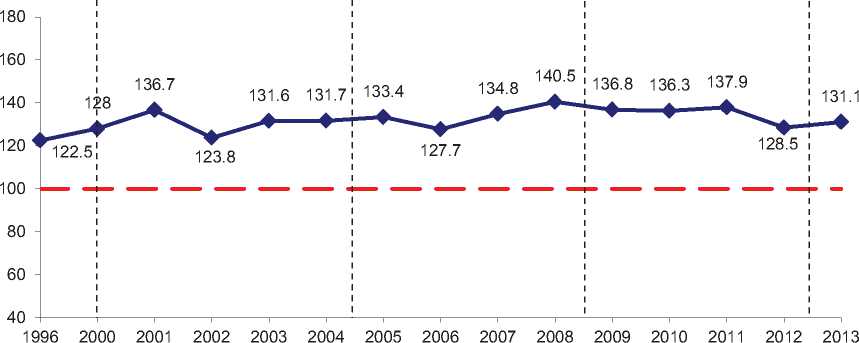
е Index of trust in the Church
The level of trust in the Church increased a little in 2013 (the index increased from 129 to 131 points) after its fall in 2012 by 9 points. (from 138 to 129 points).
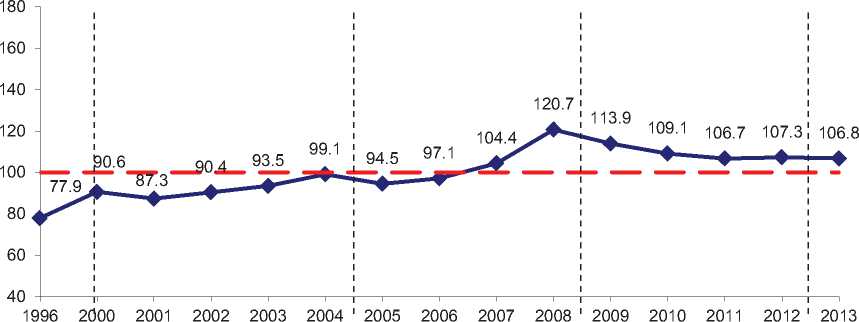
Attitude toward the Government of the Russian Federation
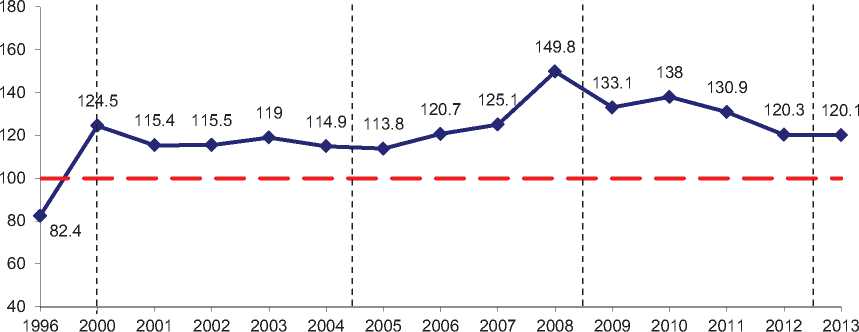
Index of trust in RF Government, after its decrease in 2010–2012 (from 138 to 120 points), has stabilized.
— ♦ — Index of trust in Russia’s Government
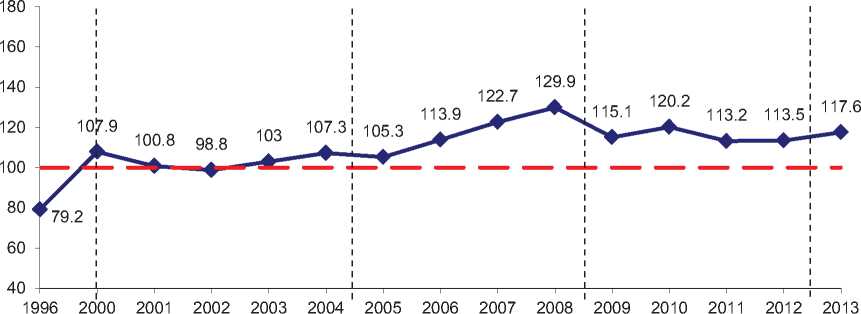
Attitude toward the Court
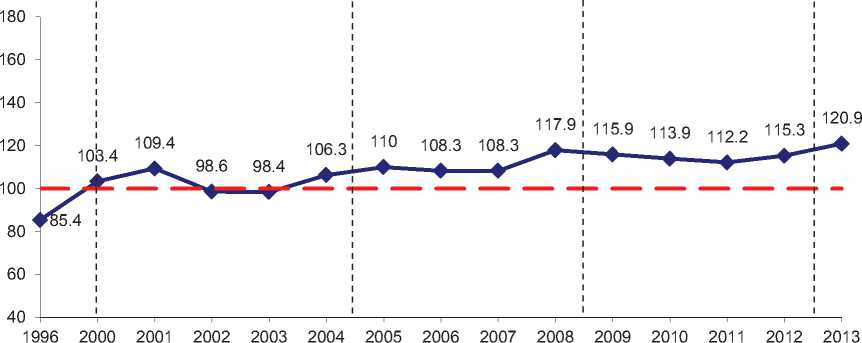
• Index of trust in the Court
Level of the Oblast residents’ trust in the Court has been increasing since 2011. The index has increased by 9 points over this period (from 112 to 121 points).
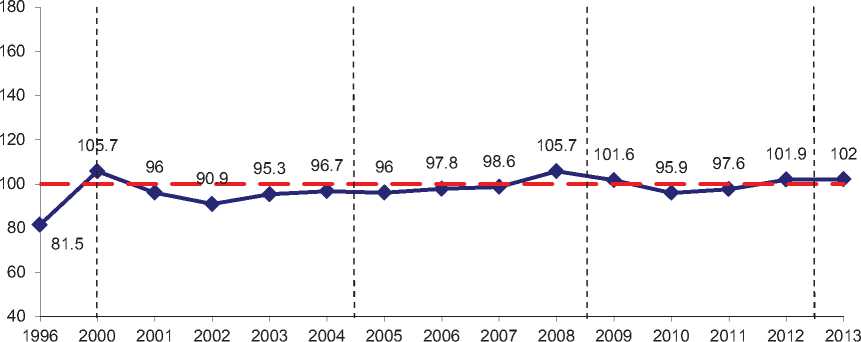
Attitude toward the Government of the Vologda Oblast
RF President
B.N. Yeltsin (November 1996 – December 1999)
RF President V.V. Putin (January 2000 – April 2000 – acting RF President, May 2000 – May 2004 – 1 term)
RF President V.V. Putin 2 term (May 2004 – May 2008)
RF President RF President V.V. Putin
D.A. Medvedev 3 term
(May 2008 – May 20 1 2 ) (May 2012 – present)
In 2013 the index of trust in the Oblast Government slightly increased (from 114 to 118 points).
• Index of trust in the Vologda Oblast Government
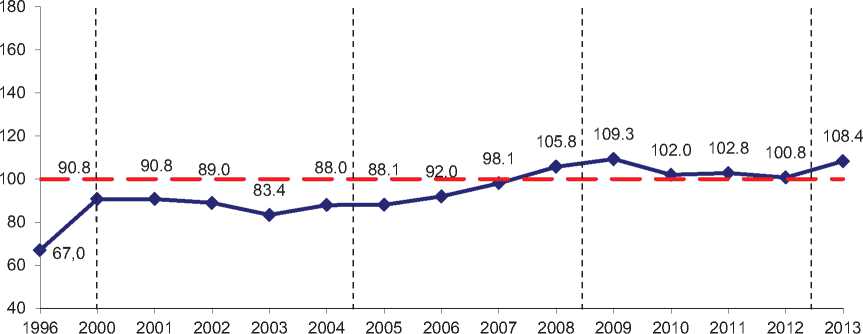
Attitude toward the Procuracy
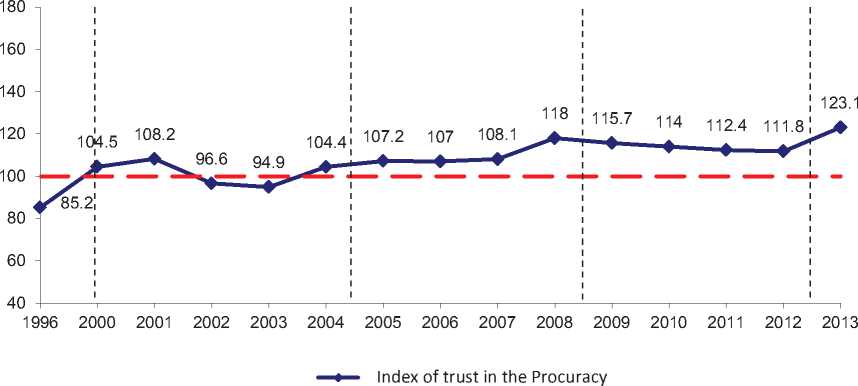
The level of trust in the Procuracy in 2013 increased considerably (from 118 to 129 points). The opposite trend was observed in 2008–2012 (the index has decreased from 118 to 112 points over this period).
Attitude toward the Federal Security Service of the Russian Federation
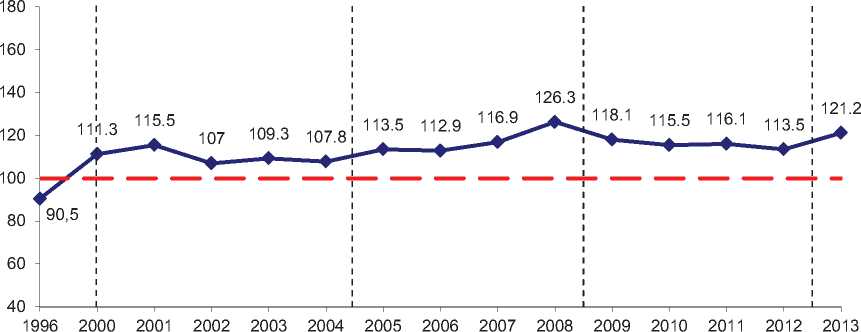
• Index of trust in the Federal Security Service
The level of the Oblast residents’ trust in the Federal Security Service in 2013 increased considerably
(the index has increased from 114
to 121 points). In 2009– 2012 there were no significant changes in the dynamics of the index.
Attitude toward the Federation Council of Russia
RF President V.V. Putin
RF President RF President V.V. Putin
D.A. Medvedev 3 term
(May 2008 – May 2012 ) (May 2012 – present)
RF President
B.N. Yeltsin (Novemb e r 1996 – December 1999)
(January 2000 – April 2000 – acting RF President, May 2000 – May 2004 – 1 term)
RF President V.V. Putin 2 term (May 2004 – May 2008)
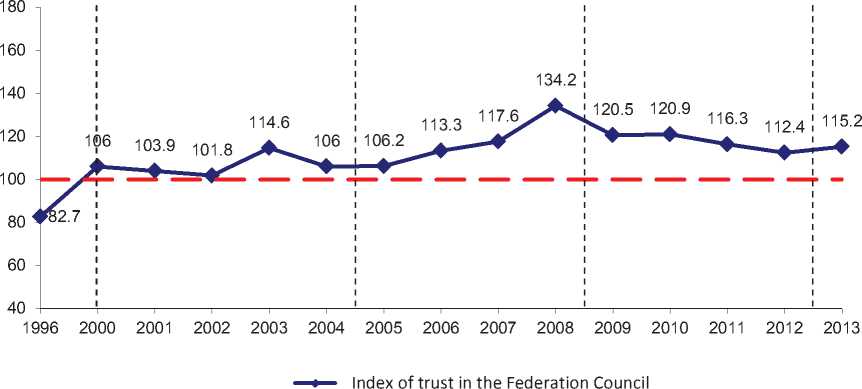
After the decline in the level of trust in the Federation Council in 2009–2012 (the index decreased from 121 to 112 points), there were positive changes in 2013: the index of trust increased a little (from 112 to 115 points).
Attitude toward the Army
• Index of trust in the Army
The residents’ trust in the Army in 2013 increased considerably (the index increased from 109 to 119 points). In 2009–2012 there were no noticeable changes in the dynamics of the index.
Attitude toward the State Duma
=0= Index of trust in the State Duma
Since 2011 there have been no noticeable changes in the dynamics of the index of trust in RF State Duma (107 points).
Attitude toward the mass media
RF President RF President V.V. Putin
D.A. Medvedev 3 term
(May 2008 – May 20 1 2 ) (May 2012 – present)
RF President
B.N. Yeltsin (November 1996 – December 1999)
RF President V.V. Putin (January 2000 – April 2000 – acting RF President, May 2000 – May 2004 – 1 term)
RF President V.V. Putin 2 term (May 2004 – May 2008)
^2= Index of trust in the mass media
After the increase in the index of trust in the mass media in 2010 – 2012 (from 97 to 102 points), the value of the index stabilized in 2013.
Attitude toward the Police
=0= Index of trust in the Police
In 2013 the level of trust in the Police increased (the index increased from 101 to 108 points). In 2010–2012 there were no significant changes.
Attitude toward Trade Unions
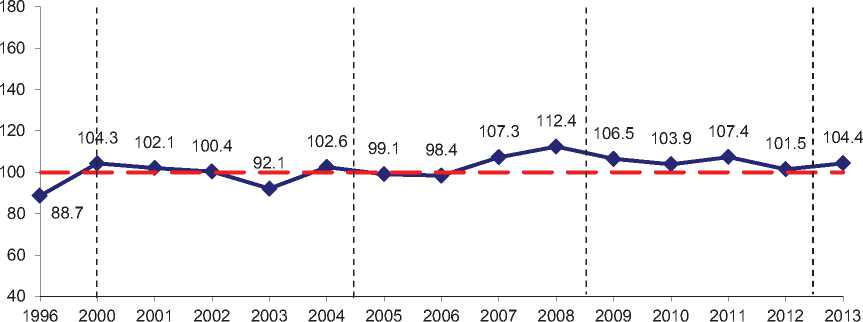
— ♦ — Index of trust in Trade Unions
The index of trust in Trade Unions in 2013 increased a little (from 102 to 104 points) after its decrease in 2012 (from 107 to 102 points).
Attitude toward CEOs
RF President RF President V.V. Putin
D.A. Medvedev 3 term
(May 2008 – May 2012 ) (May 2012 – present)
RF President
B.N. Yeltsin (November 1996 – December 1999)
RF President V.V. Putin (January 2000 – April 2000 – acting RF President, May 2000 – May 2004 – 1 term)
RF President V.V. Putin 2 term (May 2004 – May 2008)
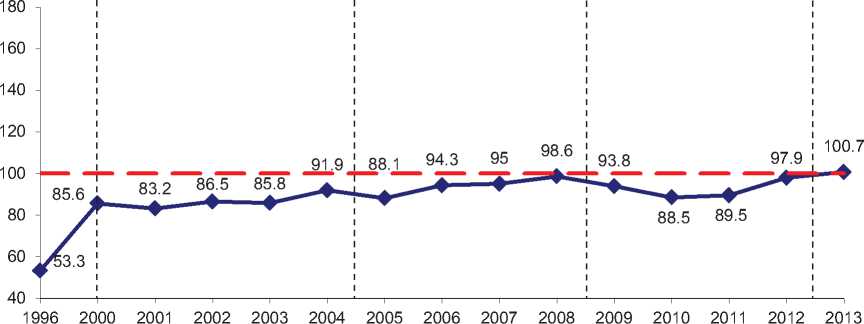
I Index of trust in CEOs
The index of trust in CEOs has been increasing since 2011 (the index has increased from 90 to 101 over this period).
Attitude toward banks and entrepreneurs
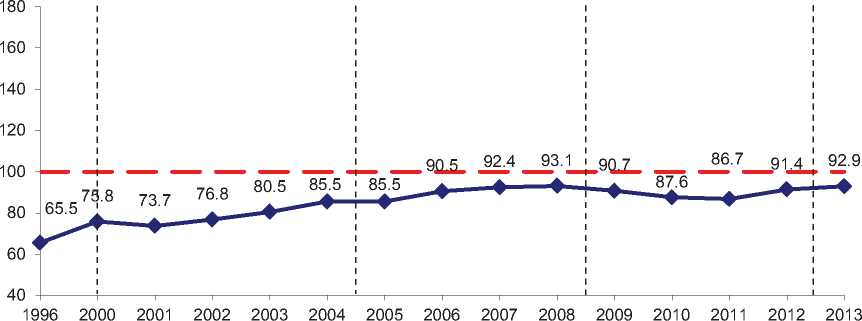
• Index of trust in banks and entrepreneurs
The index of trust in banks and entrepreneurs has been increasing since 2011 (from 87 to 93 points over this period).
Attitude toward political parties and political movements
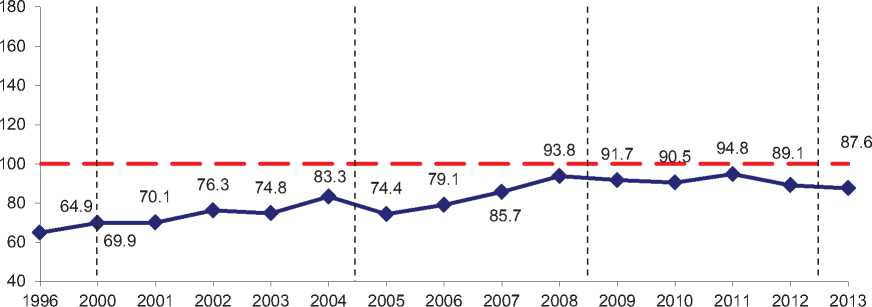
• Index of trust in political parties and political movements
The level of trust in political parties and political movements has been decreasing since 2011. The index has decreased by 7 points (from 95 to 88) over this period.
