Public opinion monitoring of the state of the Russian society

Author: Ilyin Vladimir Aleksandrovich
Journal: Economic and Social Changes: Facts, Trends, Forecast @volnc-esc-en
Section: From the chief editor
Article in issue: 1 (37) т.8, 2015.
Free access
Short address: https://sciup.org/147223689
IDR: 147223689
Text of the review article Public opinion monitoring of the state of the Russian society
More details on the results of ISEDT RAS polls are available at
How do you assess the current performance of..? (as a percentage of the number of respondents)
|
Answer option |
2007 |
2011 |
2013 |
2014 |
Apr. 2014 |
June 2014 |
Aug. 2014 |
Oct. 2014 |
Dec. 2014 |
Feb. 2015 |
Average for the last six surveys |
Dynamics (+/-), the last six surveys in comparison with… |
||
|
2013 |
2011 |
2007 |
||||||||||||
|
RF President |
||||||||||||||
|
I approve |
75.3 |
58.7 |
55.3 |
64.1 |
62.8 |
66.6 |
66.4 |
66.8 |
66.0 |
66.3 |
65.8 |
+11 |
+7 |
-10 |
|
I do not approve |
11.5 |
25.6 |
29.4 |
22.3 |
25.4 |
21.8 |
19.3 |
18.5 |
19.7 |
20.5 |
20.9 |
-9 |
-5 |
+9 |
|
Chairman of the RF Government * |
||||||||||||||
|
I approve |
-* |
59.3 |
48.9 |
54.2 |
52.5 |
55.8 |
55.2 |
56.2 |
56.3 |
56.1 |
55.4 |
+7 |
-4 |
- |
|
I do not approve |
- |
24.7 |
32.8 |
27.6 |
30.9 |
26.4 |
26.8 |
23.9 |
24.7 |
24.7 |
26.2 |
-7 |
+2 |
- |
|
Governor |
||||||||||||||
|
I approve |
55.8 |
45.7 |
44.4 |
40.1 |
41.6 |
38.5 |
38.8 |
39.7 |
39.3 |
38.3 |
39.4 |
-5 |
-6 |
-16 |
|
I do not approve |
22.2 |
30.5 |
33.2 |
38.9 |
39.0 |
40.9 |
40.1 |
39.6 |
37.0 |
37.4 |
39.0 |
+6 |
+9 |
+17 |
|
* Included into the survey since 2008. |
||||||||||||||
The share of the Oblast residents, who believe that the President is successful in coping with the majority of Russia’s key problems, has not changed significantly for the last two months. The proportion of those who support the President’s efforts to strengthen Russia’s international standing is 50–51%, 50–52% support his efforts to impose order in the country, 40–41% support his efforts to protect democracy and strengthen the citizens’ freedoms.
At the same time, it is necessary to point out the decline in the share of the Oblast residents who believe that the actions of Russia’s President promote economic recovery and help increase the welfare of citizens. In December 2014 – February 2015, the proportion of positive ratings decreased from 38 to 34%, which is lower than the average for the last six surveys. The index of success over the past two months has decreased from 87 to 83 points2.
In your opinion, how successful is the RF President in coping with challenging issues? (as a percentage of the number of respondents)*
|
Answer option |
2007 |
2011 |
2013 |
2014 |
Apr. 2014 |
June 2014 |
Aug. 2014 |
Oct. 2014 |
Dec. 2014 |
Feb. 2015 |
Average for the last six surveys |
Dynamics (+/-), the last six surveys in comparison with… |
||
|
2013 |
2011 |
2007 |
||||||||||||
|
Strengthening Russia’s international standing |
||||||||||||||
|
Successful |
58.4 |
46.2 |
45.7 |
50.4 |
48.6 |
53.7 |
50.9 |
52.3 |
50.8 |
50.4 |
51.1 |
+5 |
+5 |
-7 |
|
Unsuccessful |
24.9 |
33.7 |
36.2 |
32.4 |
35.5 |
31.7 |
30.0 |
31.0 |
30.3 |
29.5 |
31.3 |
-5 |
-2 |
+6 |
|
Index of success |
133.5 |
112.5 |
109.5 |
118.0 |
113.1 |
122.0 |
120.9 |
121.3 |
120.5 |
120.9 |
119.8 |
+10 |
+7 |
-14 |
|
Imposing order in the country |
||||||||||||||
|
Successful |
53.2 |
36.6 |
39.4 |
48.0 |
46.7 |
49.5 |
47.5 |
49.4 |
52.1 |
50.3 |
49.3 |
+10 |
+13 |
-4 |
|
Unsuccessful |
34.0 |
50.0 |
47.5 |
39.1 |
40.9 |
39.5 |
37.8 |
37.8 |
35.1 |
37.3 |
38.1 |
-9 |
-12 |
+4 |
|
Index of success |
119.2 |
86.6 |
91.9 |
108.9 |
105.8 |
110.0 |
109.7 |
111.6 |
117.0 |
113.0 |
111.2 |
+19 |
+25 |
-8 |
|
Protecting democracy and strengthening the citizens’ freedoms |
||||||||||||||
|
Successful |
44.4 |
32.4 |
31.8 |
37.5 |
36.3 |
40.1 |
37.6 |
38.2 |
40.7 |
39.5 |
38.7 |
+7 |
+6 |
-6 |
|
Unsuccessful |
37.0 |
48.3 |
51.0 |
45.4 |
48.7 |
43.9 |
43.7 |
44.3 |
41.9 |
40.9 |
43.9 |
-7 |
-4 |
+7 |
|
Index of success |
107.4 |
84.1 |
80.8 |
92.1 |
87.6 |
96.2 |
93.9 |
93.9 |
98.8 |
98.6 |
94.8 |
+14 |
+11 |
-13 |
|
Economic recovery and increase in the citizens’ welfare |
||||||||||||||
|
Successful |
47.2 |
30.7 |
31.3 |
34.8 |
34.9 |
35.8 |
35.1 |
33.9 |
37.6 |
34.4 |
35.3 |
+4 |
+5 |
-12 |
|
Unsuccessful |
39.1 |
56.1 |
56.8 |
53.4 |
54.3 |
53.5 |
50.2 |
54.4 |
50.8 |
51.5 |
52.5 |
-4 |
-4 |
+13 |
|
Index of success |
108.1 |
74.6 |
74.5 |
81.4 |
80.6 |
82.3 |
84.9 |
79.5 |
86.8 |
82.9 |
82.8 |
+8 |
+8 |
-25 |
|
* Ranked according to the average value of the index of success for the last 6 surveys. |
||||||||||||||
The structure of the Russians’ preferences concerning political parties has not changed significantly over the past two months. The proportion of the Oblast residents who believe that the “United Russia” expresses their interests is 37–39%. Support for the KPRF is 8%, for the LDPR – 7–8%, for the “Just Russia» – 3–4%.
It is noteworthy that in February 2015, compared to December 2014, there has been a decrease in the share of the Oblast residents, who think that no party expresses their interests (from 33 to 30%). It is less than in 2013 (35%) and less than the average value for the last six surveys (34%); this fact indicates the increased interest of the Vologda Oblast residents in economic and political situation in the country.
Which party expresses your interests? (as a percentage of the number of respondents)
|
Party |
2007 |
о ° I1 У 1=1 из |
2011 |
о ° 11 из |
2013 |
2014 |
Apr. 2014 |
June 2014 |
Aug. 2014 |
Oct. 2014 |
Dec. 2014 |
Feb. 2015 |
Average for the last six surveys |
Dynamics (+/-), the last six surveys in comparison with… |
||
|
2013 |
2011 |
2007 |
||||||||||||||
|
United Russia |
30.2 |
60.5 |
31.1 |
33.4 |
29.4 |
32.8 |
29.5 |
32.7 |
34.3 |
35.5 |
36.7 |
38.8 |
34.6 |
+5 |
+4 |
+4 |
|
KPRF |
7.0 |
9.3 |
10.3 |
16.8 |
11.3 |
9.7 |
10.7 |
9.8 |
9.1 |
9.3 |
8.3 |
7.7 |
9.2 |
-2 |
-1 |
+2 |
|
LDPR |
7.5 |
11.0 |
7.8 |
15.4 |
7.2 |
7.6 |
8.3 |
6.2 |
6.9 |
7.3 |
7.8 |
6.7 |
7.2 |
0 |
-1 |
0 |
|
Just Russia |
7.8 |
8.8 |
5.6 |
27.2 |
4.6 |
3.5 |
3.3 |
3.3 |
3.7 |
3.9 |
3.2 |
4.1 |
3.6 |
-1 |
-2 |
-4 |
|
Other |
1.8 |
– |
1.9 |
– |
0.6 |
0.3 |
0.2 |
0.1 |
0.1 |
0.7 |
0.1 |
0.3 |
0.3 |
0 |
-2 |
-2 |
|
No party |
17.8 |
– |
29.4 |
– |
34.9 |
34.4 |
34.8 |
36.0 |
35.0 |
32.6 |
32.7 |
30.3 |
33.6 |
-1 |
+4 |
+16 |
|
It is difficult to answer |
21.2 |
– |
13.2 |
– |
10.2 |
11.7 |
13.1 |
11.8 |
10.9 |
10.7 |
11.1 |
12.0 |
11.6 |
+1 |
-2 |
-10 |
The characteristics of social mood and stock of patience for the last two months have deteriorated significantly.
The share of the Oblast residents, who assess their mood as “good and normal”, decreased in December 2014 – February 2015 from 71 to 62%. The share of those who “feel stress, anger, fear and depression” increased from 24 to 31%.
The proportion of those, who believe that «Everything is not so bad; it’s difficult to live, but it’s possible to stand it” decreased from 80 to 74%. The proportion of those who “cannot bear such plight” increased from 14% to 17%.
In general, the assessments of social sentiment and stock of patience in February 2015 are more negative than they were in December 2014, on average for the last six surveys and on average for 2007–2014. Obviously, it is connected with the deteriorating socio-economic situation in the country under the sanctions imposed by the West, and with the low and unstable exchange rate of the national currency.
More and more Russians feel the consequences of negative processes going on in the national economy. For instance, in February 2015 as compared to December 2014 the share of the Vologda Oblast residents who consider they have average income decreased from 42 до 38%, and the proportion of those who consider themselves to be poor and extremely poor increased from 51 до 53%. Such a negative situation is observed for the first time in the last six surveys.
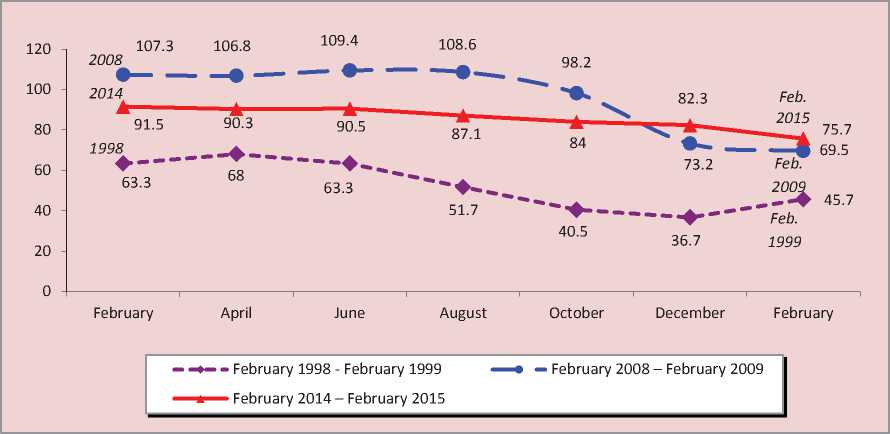
There is a continuous declining trend in consumer sentiment index (CSI) – an integrated indicator that characterizes not only the economic condition of the Russians, but also their expectations concerning the development of their well-being and economic situation in the country in general. In December 2014 – February 2015 CSI decreased from 82 to 76 points, which is significantly lower than on average for the last six surveys and for 2007–2014.
Estimation of social condition (as a percentage of the number of respondents)
|
Answer option |
2007 |
2011 |
2013 |
2014 |
Apr. 2014 |
J une 2014 |
Aug. 2014 |
Oct. 2014 |
Dec. 2014 |
Feb. 2015 |
Average for the last six surveys |
Dynamics (+/-), the last six surveys in comparison with… |
||
|
2013 |
2011 |
2007 |
||||||||||||
|
Mood |
||||||||||||||
|
Usual condition, good mood |
63.6 |
63.1 |
68.6 |
69.4 |
69.3 |
71.1 |
70.5 |
69.3 |
70.9 |
61.8 |
68.8 |
0 |
+6 |
+5 |
|
I feel stress, anger, fear, depression |
27.8 |
28.9 |
26.2 |
24.9 |
24.9 |
23.7 |
25.1 |
24.6 |
24.1 |
31.3 |
25.6 |
-1 |
-3 |
-2 |
|
Stock of patience |
||||||||||||||
|
Everything is not so bad; it’s difficult to live, but it’s possible to stand it |
74.1 |
74.8 |
79.3 |
80.8 |
81.3 |
81.0 |
82.5 |
80.3 |
80.0 |
74.3 |
79.9 |
+1 |
+5 |
+6 |
|
It’s impossible to bear such plight |
13.6 |
15.3 |
14.2 |
12.6 |
11.1 |
13.4 |
12.8 |
12.1 |
13.6 |
17.3 |
13.4 |
-1 |
-2 |
0 |
|
Social self-identification |
||||||||||||||
|
The share of people who consider themselves to have average income |
48.2 |
43.1 |
43.9 |
43.2 |
43.1 |
42.0 |
44.1 |
43.5 |
42.3 |
38.3 |
42.2 |
-2 |
-1 |
-6 |
|
The share of people who consider themselves to be poor and extremely poor |
42.4 |
44.3 |
46.9 |
49.1 |
49.1 |
48.4 |
49.6 |
49.3 |
51.0 |
53.3 |
50.1 |
+3 |
+6 |
+8 |
|
Consumer sentiment index |
||||||||||||||
|
Index value, points |
105.9 |
89.6 |
90.3 |
87.6 |
90.3 |
90.5 |
87.1 |
84.0 |
82.3 |
75.7 |
85.0 |
-5 |
-5 |
-21 |
The reduction of CSI took place in June – December 1998 in the period of default.
Similar changes in the Index were observed in June 2008 – February 2009, when the population was faced with the consequences of the global financial crisis.
The current negative dynamics of CSI has started in June 2014, and its rate is increasing. In December 2014 – February 2015 CSI decreased by six points (from 82 to 76 p.). For comparison, it has not declined by more than four points for the last six polls (this happened in June – August, 2014, the decline was from 91 to 87 p.).
Consumer sentiment index declined in all the socio-demographic categories of the population in the past two months, including all the income and age groups. Especially negative changes are observed among people with higher and incomplete higher education (CSI decreased from 91 to 81 p.), among 20% of the most prosperous (from 101 to 93 p.), and among the Vologda residents (from 84 to 75 p.).
It is alarming that the decrease in CSI has already become a steady trend in most sociodemographic groups. This trend has been observed since June 2014.
Dynamics of consumer sentiment index (CSI) in 1998, 2008 and 2014 (in points).
Consumer sentiment index in different socio-demographic groups (in points)
|
Category of population |
2007 |
2011 |
2012 |
2013 |
2014 |
Apr. 2014 |
June 2014 |
Aug. 2014 |
Oct. 2014 |
Dec. 2014 |
Feb. 2015 |
Average for the last six surveys |
Dynamics (+/-), the last six surveys in comparison with… |
||
|
2013 |
2011 |
2007 |
|||||||||||||
|
Sex |
|||||||||||||||
|
Men |
107.8 |
90.3 |
92.2 |
91.0 |
87.6 |
91.3 |
90.1 |
86.6 |
82.9 |
82.6 |
76.8 |
85.1 |
-6 |
-5 |
-23 |
|
Women |
104.4 |
89.1 |
91.0 |
89.8 |
87.6 |
89.6 |
90.8 |
87.5 |
84.9 |
81.9 |
74.8 |
84.9 |
-5 |
-4 |
-19 |
|
Age |
|||||||||||||||
|
Under 30 |
115.2 |
95.0 |
97.0 |
94.5 |
93.0 |
97.4 |
93.4 |
94.7 |
89.3 |
87.8 |
82.7 |
90.9 |
-4 |
-4 |
-24 |
|
30–55 |
107.1 |
89.1 |
91.9 |
91.4 |
87.5 |
90.1 |
92.2 |
86.3 |
83.1 |
80.1 |
73.0 |
84.1 |
-7 |
-5 |
-23 |
|
Over 55 |
95.7 |
86.0 |
86.3 |
85.6 |
84.2 |
85.5 |
86.1 |
82.9 |
81.8 |
81.6 |
74.9 |
82.1 |
-3 |
-4 |
-14 |
|
Education |
|||||||||||||||
|
Incomplete secondary, secondary |
100.2 |
85.6 |
84.9 |
83.4 |
80.5 |
84.4 |
82.5 |
79.0 |
78.8 |
75.0 |
69.6 |
78.2 |
-5 |
-7 |
-22 |
|
Secondary vocational |
105.9 |
87.9 |
90.2 |
88.7 |
86.9 |
89.5 |
89.5 |
86.5 |
82.2 |
82.0 |
76.9 |
84.4 |
-4 |
-3 |
-21 |
|
Incomplete higher, higher |
113.1 |
95.5 |
98.8 |
99.2 |
96.3 |
98.4 |
100.2 |
96.9 |
92.1 |
91.0 |
80.7 |
93.2 |
-6 |
-2 |
-20 |
|
Income groups |
|||||||||||||||
|
20% of the poorest people |
88.2 |
74.8 |
77.6 |
71.2 |
69.8 |
72.3 |
73.2 |
66.5 |
67.8 |
64.2 |
58.6 |
67.1 |
-4 |
-8 |
-21 |
|
60% of the people with middle-sized income |
105.5 |
89.0 |
90.3 |
90.8 |
87.0 |
88.9 |
88.5 |
87.0 |
83.6 |
81.9 |
76.5 |
84.4 |
-6 |
-5 |
-21 |
|
20% of the most prosperous people |
124.7 |
105.3 |
107.5 |
108.9 |
107.5 |
112.4 |
111.3 |
105.7 |
103.7 |
101.2 |
92.5 |
104.5 |
-4 |
-1 |
-20 |
|
Territories |
|||||||||||||||
|
Vologda |
104.2 |
90.9 |
93.6 |
92.3 |
90.8 |
93.6 |
94.9 |
90.8 |
87.8 |
84.3 |
74.7 |
87.7 |
-5 |
-3 |
-17 |
|
Cherepovets |
114.9 |
98.9 |
100.2 |
97.7 |
95.3 |
99.0 |
96.8 |
93.6 |
90.1 |
90.0 |
82.7 |
92.0 |
-6 |
-7 |
-23 |
|
Districts |
102.3 |
84.4 |
86.2 |
85.3 |
81.7 |
83.8 |
84.6 |
81.5 |
78.7 |
76.9 |
72.4 |
79.7 |
-6 |
-5 |
-23 |
|
Oblast |
105.9 |
89.6 |
91.5 |
90.3 |
87.6 |
90.3 |
90.5 |
87.1 |
84.0 |
82.3 |
75.7 |
85.0 |
-5 |
-5 |
-21 |
The powerful influence of people’s financial situation on how they assess their own social condition is proved by the fact that for the last two months the proportion of the Oblast residents who describe their mood as “good, normal, fine” has also decreased in all the socio-demographic categories. At that the largest decrease in positive assessments of social mood is observed among the 20% of the poorest (by 17 percentage points, from 55 to 38%).
Social mood in different socio-demographic groups (answer option “Good mood, usual, good condition”, as a percentage of the number of respondents)
|
Category of population |
2007 |
2011 |
2012 |
2013 |
2014 |
Apr. 2014 |
June 2014 |
Aug. 2014 |
Oct. 2014 |
Dec. 2014 |
Feb. 2015 |
Average for the last six surveys |
Dynamics (+/-), the last six surveys in comparison with… |
||
|
2013 |
2011 |
2007 |
|||||||||||||
|
Sex |
|||||||||||||||
|
Men |
65.9 |
64.5 |
69.1 |
69.9 |
68.9 |
68.5 |
71.3 |
69.5 |
68.8 |
69.7 |
61.7 |
68.3 |
-2 |
+4 |
+2 |
|
Women |
61.7 |
62.0 |
65.8 |
67.5 |
69.8 |
70.0 |
71.0 |
71.4 |
69.8 |
72.0 |
61.9 |
69.4 |
+2 |
+7 |
+8 |
|
Age |
|||||||||||||||
|
Under 30 |
71.3 |
70.0 |
72.3 |
75.5 |
75.1 |
70.8 |
76.1 |
79.1 |
76.6 |
76.4 |
71.3 |
75.1 |
0 |
+5 |
+4 |
|
30–55 |
64.8 |
62.5 |
67.9 |
69.2 |
69.5 |
70.0 |
71.8 |
70.3 |
68.3 |
69.8 |
58.3 |
68.1 |
-1 |
+6 |
+3 |
|
Over 55 |
54.8 |
58.3 |
62.1 |
62.4 |
65.4 |
67.2 |
66.7 |
64.9 |
66.1 |
69.1 |
60.7 |
65.8 |
+3 |
+7 |
+11 |
|
Education |
|||||||||||||||
|
Incomplete secondary, secondary |
58.4 |
57.4 |
57.2 |
60.6 |
62.5 |
61.3 |
61.7 |
63.3 |
65.4 |
67.8 |
54.8 |
62.4 |
+2 |
+5 |
+4 |
|
Secondary vocational |
64.6 |
63.6 |
66.7 |
68.1 |
70.4 |
70.7 |
72.2 |
71.3 |
70.2 |
71.8 |
65.2 |
70.2 |
+2 |
+7 |
+6 |
|
Incomplete higher, higher |
68.6 |
68.3 |
77.0 |
77.4 |
76.2 |
78.1 |
80.4 |
77.7 |
73.3 |
73.5 |
65.8 |
74.8 |
-3 |
+7 |
+6 |
|
Income groups |
|||||||||||||||
|
20% of the poorest people |
51.6 |
45.3 |
51.5 |
46.2 |
50.8 |
47.4 |
54.9 |
54.1 |
50.2 |
55.1 |
38.3 |
50.0 |
+4 |
+5 |
-2 |
|
60% of the people with middle-sized income |
62.9 |
65.3 |
68.7 |
71.9 |
72.3 |
72.6 |
72.7 |
71.5 |
73.5 |
75.0 |
65.2 |
71.8 |
0 |
+6 |
+9 |
|
20% of the most prosperous people |
74.9 |
75.3 |
81.1 |
83.3 |
84.8 |
82.7 |
89.0 |
89.6 |
79.0 |
81.6 |
80.3 |
83.7 |
0 |
+8 |
+9 |
|
Territories |
|||||||||||||||
|
Vologda |
63.1 |
67.1 |
73.6 |
75.0 |
76.4 |
75.6 |
78.6 |
80.7 |
75.5 |
75.6 |
66.4 |
75.4 |
0 |
+8 |
+12 |
|
Cherepovets |
68.1 |
71.2 |
76.2 |
75.3 |
76.3 |
79.0 |
79.9 |
76.5 |
72.8 |
73.2 |
63.1 |
74.1 |
-1 |
+3 |
+6 |
|
Districts |
61.6 |
57.1 |
59.8 |
61.6 |
61.8 |
60.7 |
62.3 |
61.5 |
64.0 |
67.1 |
58.6 |
62.4 |
1 |
+5 |
+1 |
|
Oblast |
63.6 |
63.1 |
67.3 |
68.6 |
69.4 |
69.3 |
71.1 |
70.5 |
69.3 |
70.9 |
61.8 |
68.8 |
0 |
+6 |
+5 |
Conclusion:
The crisis phenomena in the Russian economy started in 2011–2012. They are caused by internal reasons and now they have acquired a system-wide character. Economic sanctions and the unstable national currency have only aggravated their consequences. According to the surveys conducted in February 2015, the Vologda Oblast experiences the deterioration in the structure of social selfidentification and the decline in consumer sentiment index.
In early 2015 negative processes in the economy for the first time affected the Oblast residents’ social well-being: the indicators of social sentiment and stock of patience, which in recent years (2007 –2014) were characterized by sufficient stability and positive dynamics, declined by 6–9 p.p. for the first time.
So far, the deterioration of financial situation and social sentiment in not reflected in the level of support of federal and regional authorities; however, the experience of social research (in particular, the assessment of consumer sentiment index) suggests that if decisive steps to improve the socioeconomic situation are not taken, there can be serious negative changes in the near future.
Below we have placed the results of the long-term monitoring carried out by ISEDT RAS; they present the assessment of the attitude of the Vologda Oblast population toward the current governmental, public and political institutions.
The graphic materials take into account the assessment results for the period from 2000 to 2014. The data show that the Vologda Oblast residents have greater trust in governmental institutions rather than in public institutions.
People’s trust in the performance of the federal authorities remains high and fairly stable. Since 2000 the trust index has been higher than the neutral level (100 points), which means that the majority of the Oblast residents firmly support the federal government.
A declining trend in the level of trust in presidential power during the period of D.A. Medvedev’s presidency (2009–2012) changed with the beginning of V.V. Putin’s third presidential term. This had a positive impact on the population’s attitude toward the Government of the Russian Federation, the Federation Council and the State Duma. The level of trust in the Vologda Oblast Government
is somewhat lower; nevertheless, generally positive assessments prevail in this regard.
The Church enjoys the highest level of trust among non-state institutions. This attitude has remained stable since 2012.
The level of trust of the Oblast residents in security institutions (the Army, Police, Federal Security Service) and in the Court remains high. Moreover, it should be noted that the attitude toward law enforcement agencies has been improving since 2013.
The level of people’s trust in public institutions, especially the media, CEOs, banks and business community, political parties and movements remains the lowest. The attitudes toward these institutions are mostly negative; moreover, in 2014 the level of trust has decreased significantly.
Thus, the dynamics of people’s assessments indicates that public opinion is focused more and more on the federal level of government, which is not surprising in the current unstable geopolitical situation. The society is consolidating around the federal government, and the President of the Russian Federation plays the key role in this process.
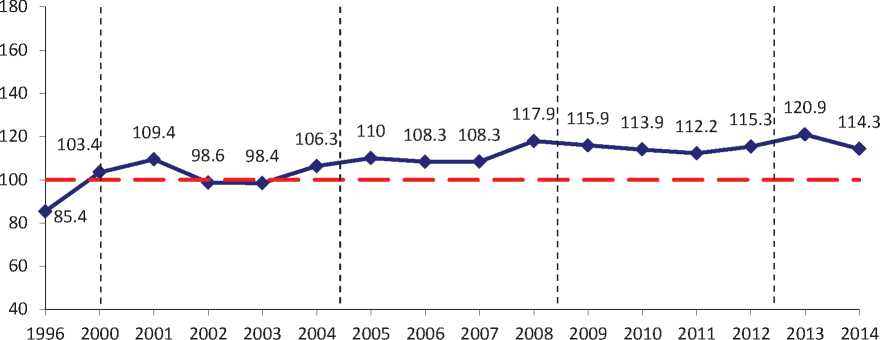
Attitude toward the President of the Russian Federation
RF President
B.N. Yeltsin (November 1996 – December 1999)
RF President V.V. Putin (January 2000 – April 2000 – acting RF President, May 2000 – May 2004 – 1 term)
RF President V.V. Putin 2 term (May 2004 – May 2008)
RF President
D.A. Medvedev (May 2008 – May 2012 )
RF President V.V. Putin 3 term (May 2012 – present)
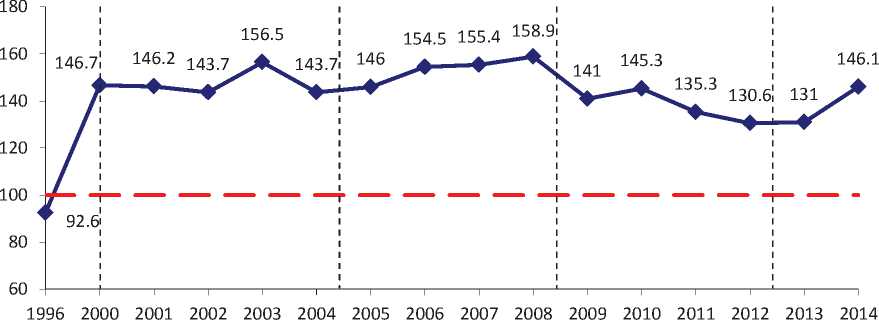
In 2013–2014 the index of trust in Russia’s President increased significantly (by 15 p., from 131 to 146 p.)
— ♦ — Index of trust in Russia’s President
Attitude toward the Church
RF President V.V. Putin 3 term (May 2012 – present)
RF President
B.N. Yeltsin (November 1996 – December 1999)
RF President V.V. Putin (January 2000 – April 2000 – acting RF President, May 2000 – May 2004 – 1 term)
RF President V.V. Putin 2 term (May 2004 – May 2008)
RF President
D.A. Medvedev (May 2008 – May 2012 )
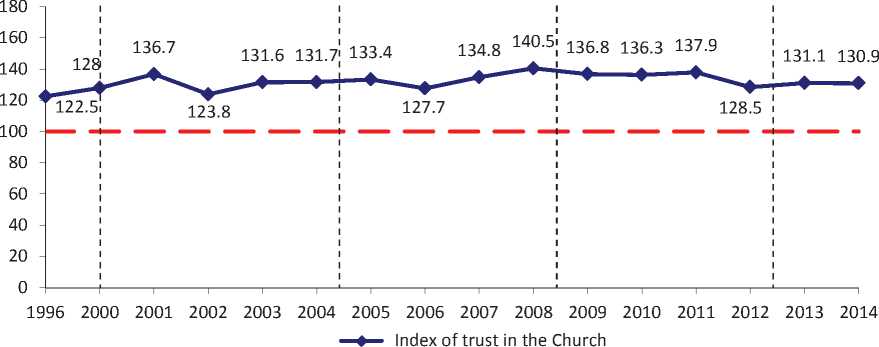
Index of trust in the Church in 2014 remained at the level of 2013 (131 p.).
Attitude toward the Government of the Russian Federation
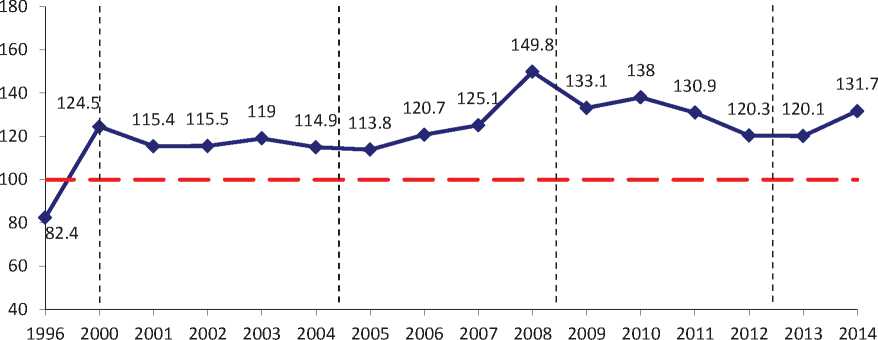
Index of trust in the RF Government in 2014 increased considerably (by 12 p., from 120 to 132 p.).
— ♦ — Index of trust in Russia’s Government
Attitude toward the Court
— ♦ — Index of trust in the Court
In 2014, compared to 2013, the index of the Oblast residents’ trust in the Court decreased (by 7 p., from 121 to 114 p.).
Attitude toward the Government of the Vologda Oblast
RF President
B.N. Yeltsin (Novemb e r 1996 – December 1999)
RF President V.V. Putin (January 2000 – April 2000 – acting RF President, May 2000 – May 2004 – 1 term)
RF President V.V. Putin 2 term (May 2004 – May 2008)
RF President
D.A. Medvedev (May 2008 – May 2012 )
RF President V.V. Putin 3 term (May 2012 – present)
129.9
107.9
115.1 120.2 113.2 113.5
117.6 112
107.3
100.8 98.8 103
122.7
113.9
105.3
79.2
In 2014 the index of trust in the Vologda Oblast Government decreased by 6 p. (from 118 to 112 p.).
40 1------1—
1996 2000 2001
2003 2004 2005 2006 2007 2008 2009 2010 2011 2012 2013 2014
— ♦ — Index of trust in the Vologda Oblast Government
Attitude toward the Procuracy
104.4
108.2
104.5
85.2
107.2
115.7 114 112.4 111.8 123.1 118.1
In 2014 the index of trust in the Procuracy decreased by 5 p. (from123 to 118 p.).
1996 2000
2001 2002 2003 2004 2005 2006 2007 2008 2009 2010 2011 2012 2013 2014
— ♦ — Index of trust in the Procuracy
Attitude toward the Federal Security Service of the Russian Federation
126.3
115.5
111.3
109.3 107.8
113.5 112.9 116.9
118.1 115.5 116.1 113.5 121.2 115.5
90.5
The level of the Oblast residents’ trust in the Federal Security Service decreased in 2014 in comparison with 2013 (by 5 p., from 121 to 115 p.).
1996 2000 2001 2002 2003 2004 2005 2006 2007 2008 2009 2010 2011 2012 2013 2014
— ♦ — Index of trust in the Federal Security Service
Attitude toward the Federation Council of Russia
RF President V.V. Putin 3 term (May 2012 – present)
RF President
B.N. Yeltsin (November 1996 – December 1999)
RF President V.V. Putin (January 2000 – April 2000 – acting RF President, May 2000 – May 2004 – 1 term)
RF President V.V. Putin 2 term (May 2004 – May 2008)
RF President
D.A. Medvedev (May 2008 – May 2012 )
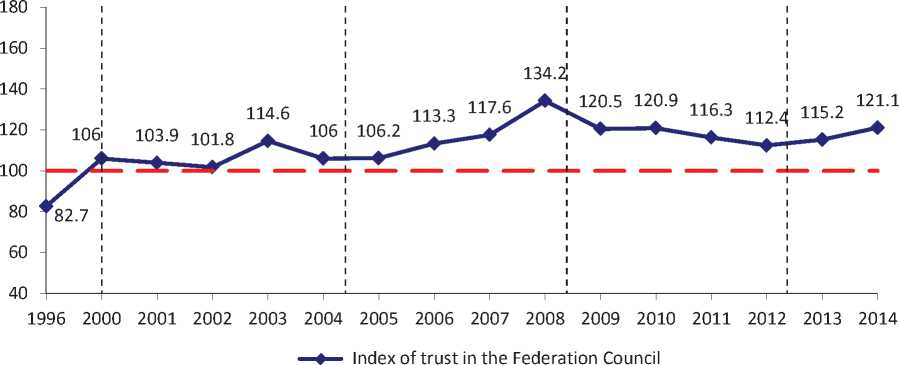
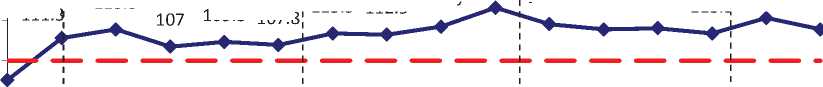
In 2014 the level of trust in the Federation Council continued to grow.
The index increased by 6 p. in comparison with 2013, and by 9 p. in comparison with 2012 (from 112 – 115 to 121 p.).
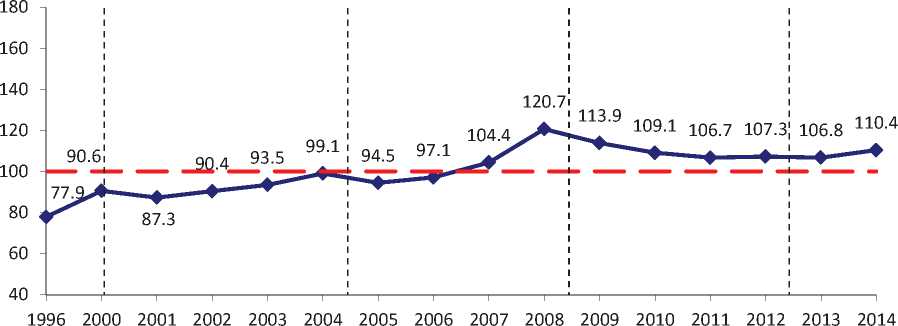
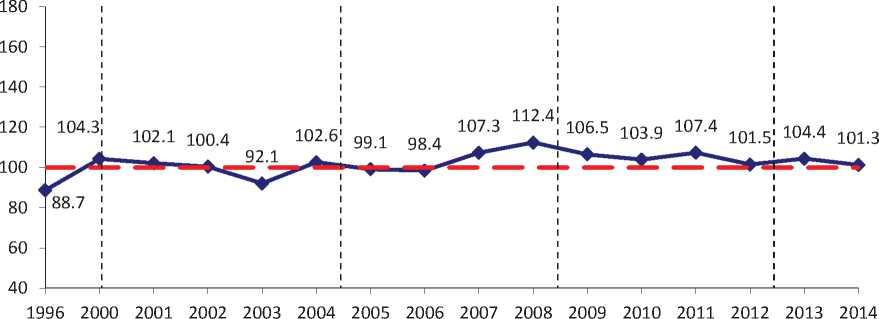
Attitude toward the Army
In 2014 the index of people’s trust in the Army remained at the level of 117 – 119 p.
— ♦ — Index of trust in the Army
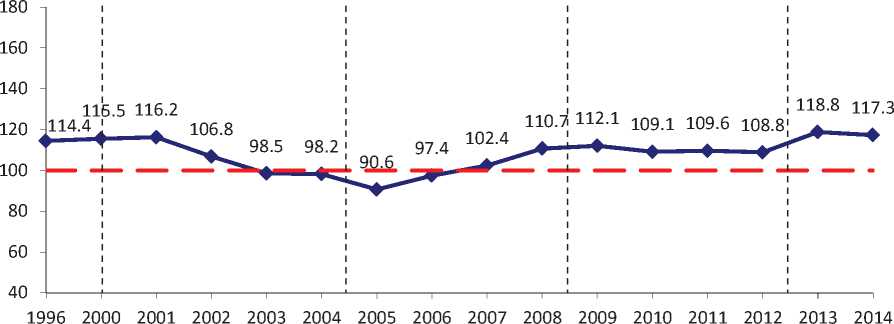
Attitude toward the State Duma
The index of trust in the State Duma in 2014 was by 3 p. higher than the level of 2011 – 2013 (110 p. vs. 107).
— ♦ — Index of trust in the State Duma
Attitude toward the mass media
RF President V.V. Putin 3 term (May 2012 – present)
RF President
B.N. Yeltsin (November 1996 – December 1999)
RF President V.V. Putin (January 2000 – April 2000 – acting RF President, May 2000 – May 2004 – 1 term)
RF President V.V. Putin 2 term (May 2004 – May 2008)
RF President
D.A. Medvedev (May 2008 – May 2012 )
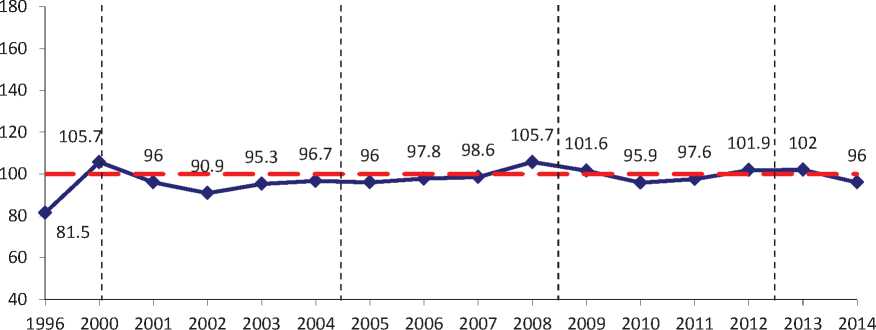
The index of trust in the mass media in 2014 decreased (by 6 p., from 102 to 96 p.).
— ♦ — Index of trust in the mass media
Attitude toward the Police
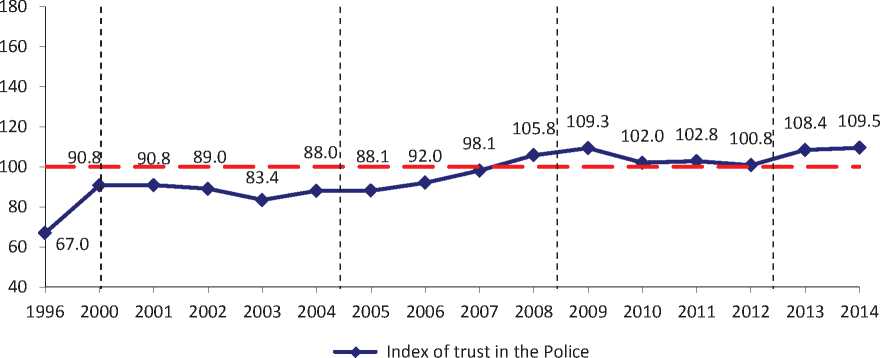
In 2014 the index of trust in the Police increased slightly (by 2 p., from 108 to 110 p.).
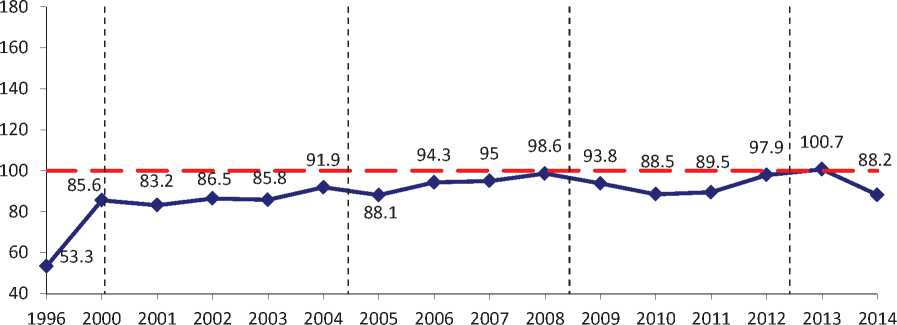
Attitude toward Trade Unions
In 2013–2014 the index of trust in Trade Unions decreased slightly (by 3 p., from 104 to 101 p.).
—•— Index of trust in Trade Unions
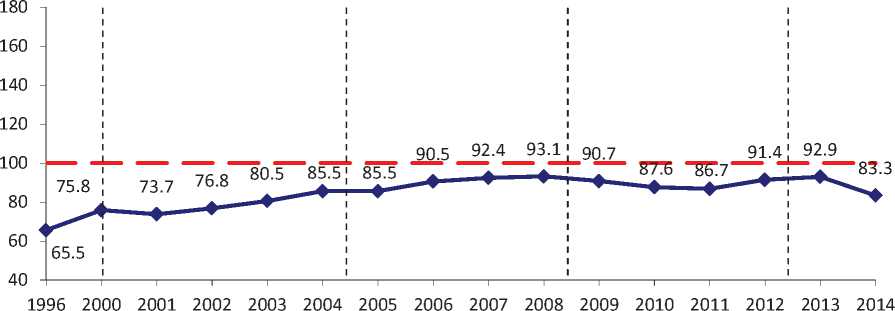
Attitude toward CEOs
RF President
B.N. Yeltsin (November 1996 – December 1999)
RF President V.V. Putin (January 2000 – April 2000 – acting RF President, May 2000 – May 2004 – 1 term)
RF President V.V. Putin 2 term (May 2004 – May 2008)
RF President
D.A. Medvedev (May 2008 – May 2012 )
RF President V.V. Putin 3 term (May 2012 – present)
In 2014, in comparison with 2013, the index of trust in CEOs decreased significantly (by 13 p., from 101 to 88 p.).
• Index of trust in CEOs
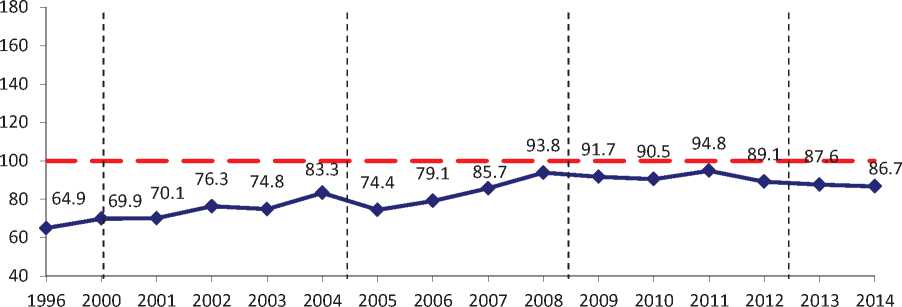
Attitude toward banks and entrepreneurs
The index of trust in banks and entrepreneurs decreased in 2014 (by 10 p., from 93 to 83 p.).
— ♦ — Index of trust in banks and entrepreneurs
Attitude toward political parties and political movements
—•— Index of trust in political parties and political movements
In 2013–2014
the level of trust in political parties and political movements changed nsignificantly (87 – 88 p.).
