Public Opinion Monitoring of the State of the Russian Society

Author: M.V. Morev, E.E. Leonidova, I.M. Bakhvalova
Journal: Economic and Social Changes: Facts, Trends, Forecast @volnc-esc-en
Section: Public opinion monitoring
Article in issue: 5 т.14, 2021.
Free access
Short address: https://sciup.org/147234821
IDR: 147234821
Text of the article Public Opinion Monitoring of the State of the Russian Society
Source: VTsIOM data. Available at:
Question: “In general, do you approve or disapprove of the work of Vladimir Putin at the position of the President of Russia?” Source: Levada-Center*. Indicators. Available at: The latest data – July 2021.
Source: Levada-Center* data. Available at: (no data for December 2020).
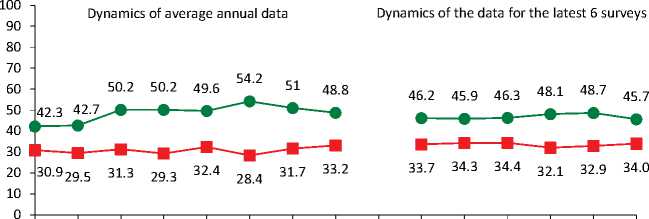
Over the past two months, there was a slight deterioration in the public opinion concerning the RF President’s work on strengthening Russia’s international positions (the share of positive assessments decreased by 3 p.p., from 49 to 46%) and on his efforts to promote economic recovery and growth of citizens’ welfare (the proportion of negative judgments increased by 2 p.p., from 61 to 63%).
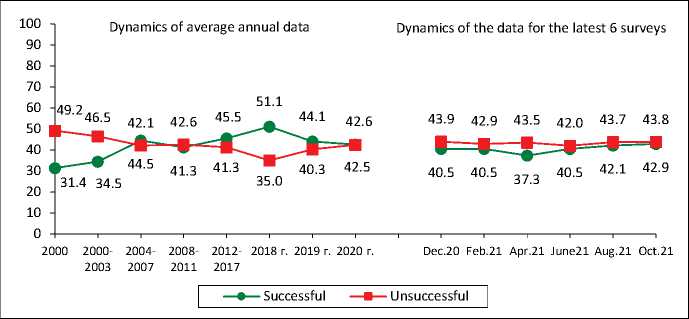
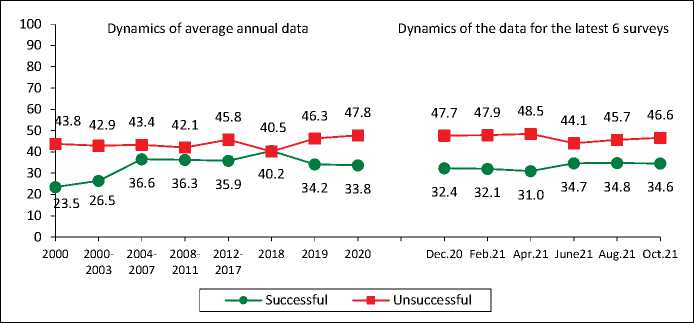
As in August, in October 2021, 42–43% of Vologda Oblast residents note that V.V. Putin is successfully coping with the task of restoring order in the country; 35% consider the activities of the head of state to protect democracy and strengthen citizens’ freedoms to be successful.
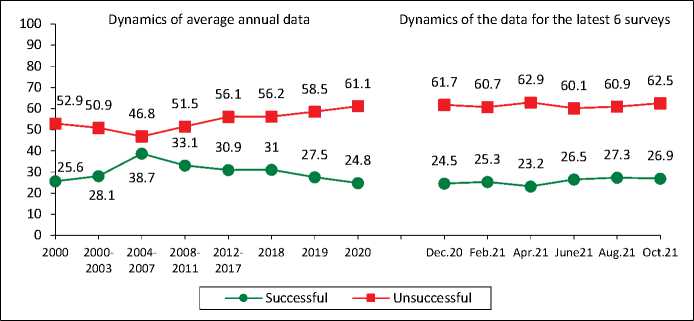
From October 2020 to August 2021, the share of positive assessments of the work of the RF President aimed at restoring order in the country increased slightly (by 2–3 p.p.) (from 41 to 43%), to protecting democracy (from 32 to 35%), boosting the economy (from 25 to 27%)
In your opinion, how successful is the RF President in coping with challenging issues? (% of respondents; VolRC RAS data)
Strengthening Russia’s international position
2000 2000- 2004- 2008- 2012- 2018 2019 2020 Dec.20 Feb.21 Apr.21 June21 Aug.21 Oct.21
2003 2007 2011 2017
—•— Successful — ■ — Unsuccessful
|
Annual dynamics (October 2021 to December 2020) |
|
|
Respond option |
Dynamics (+ / –) |
|
Successful |
–1 |
|
Unsuccessful |
0 |
Imposing order in the country
|
Annual dynamics (October 2021 to December 2020) |
|
|
Respond option |
Dynamics (+ / –) |
|
Successful |
+2 |
|
Unsuccessful |
0 |
Protecting democracy and strengthening citizens’ freedoms
|
Annual dynamics (October 2021 to December 2020) |
|
|
Respond option |
Dynamics (+ / –) |
|
Successful |
+2 |
|
Unsuccessful |
–1 |
Economic recovery and increase in citizens’ welfare
|
Annual dynamics (October 2021 to December 2020) |
|
|
Respond option |
Dynamics (+ / –) |
|
Successful |
+2 |
|
Unsuccessful |
+1 |
There have been no significant changes in the structure of political preferences of the region’s residents for the period from August to October 2021: the level of support for United Russia is 32–33%, KPRF and LDPR – 9–11% each, “Just Russia – For the Truth” – 5–6%.
At the same time, over the past two months, the proportion of people who have not decided on their political preferences, or who believe that none of the political forces currently represented in the State Duma reflects their interests has significantly decreased (by 6 p.p., from 44 to 38%).
During the period from December 2020 to October 2021, there was a slight increase in the share of supporters of United Russia (by 2 p.p., from 31 to 33%) and KPRF (by 4 p.p., from 7 to 11%).
Which party expresses your interests? (% of respondents; VolRC RAS data)
|
Party |
Dynamics of average annual data |
Data dynamics for the last 6 polls |
s о T Ё o' |
||||||||||||||
|
g |
g |
g |
E a to 55 о 1 I TO cc |
g |
co |
E a TO 55 о 1 I TO CC CD ^ |
co |
CD |
g |
s |
g |
g |
g |
g |
о |
||
|
United Russia |
18.5 |
30.2 |
31.1 |
33.4 |
29.1 |
35.4 |
38.0 |
37.9 |
33.8 |
31.5 |
30.9 |
30.5 |
31.5 |
32.1 |
31.7 |
32.7 |
+2 |
|
KPRF |
11.5 |
7.0 |
10.3 |
16.8 |
10.6 |
8.3 |
14.2 |
9.2 |
8.8 |
8.4 |
7.3 |
8.3 |
8.7 |
8.1 |
9.3 |
11.1 |
+4 |
|
LDPR |
4.8 |
7.5 |
7.8 |
15.4 |
7.8 |
10.4 |
21.9 |
9.6 |
9.1 |
9.5 |
9.5 |
10.1 |
9.9 |
8.5 |
9.9 |
11.2 |
+2 |
|
Just Russia – for the Truth |
- |
7.8 |
5.6 |
27.2 |
6.6 |
4.2 |
10.8 |
2.9 |
3.4 |
4.7 |
5.0 |
3.6 |
2.6 |
4.1 |
5.3 |
6.3 |
+1 |
|
Other |
0.9 |
1.8 |
1.9 |
– |
2.1 |
0.3 |
– |
0.7 |
0.3 |
0.5 |
0.7 |
0.2 |
0.1 |
0.1 |
0.2 |
0.5 |
0 |
|
None |
29.6 |
17.8 |
29.4 |
– |
31.3 |
29.4 |
– |
28.5 |
33.7 |
34.2 |
35.3 |
35.9 |
36.4 |
35.4 |
34.1 |
31.7 |
–4 |
|
I find it difficult to answer |
20.3 |
21.2 |
13.2 |
– |
11.7 |
12.0 |
– |
11.2 |
11.0 |
11.1 |
11.2 |
11.3 |
10.9 |
11.8 |
9.6 |
6.6 |
–4 |
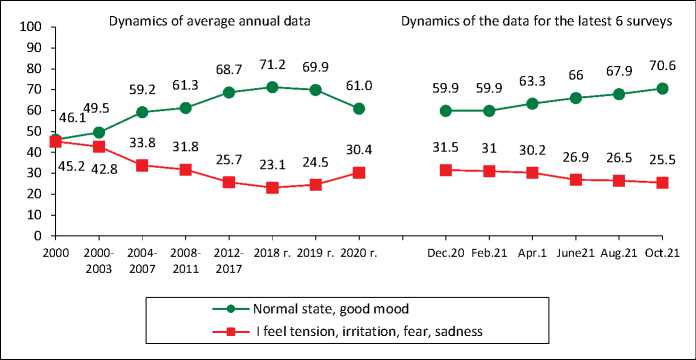
In October 2021, the upward trend in the assessments of public sentiment continued. Over the past two months, the share of people experiencing mostly positive emotions increased from 68 to 71% (by 3 p.p.); the proportion of those who believe that “everything is not so bad and it is possible to live, it is difficult to live, but it is possible to stand it” did not change significantly (77%).
The share of people who positively characterize their mood and have a high potential for patience is higher than in October 2020 (by 11 and 7 p.p., respectively).
The share of the Oblast residents who subjectively classify themselves as “poor and extremely poor” increased slightly over the past two months (by 2 p.p., from 48 to 50%); the share of people of “average income” decreased from 41 to 39%.
In general, the structure of social self-identification in October 2021 corresponds to the level of six months ago (December 2020): the proportion of “the poor and extremely poor” still prevails over the proportion of those with “average income” by 10 p.p.
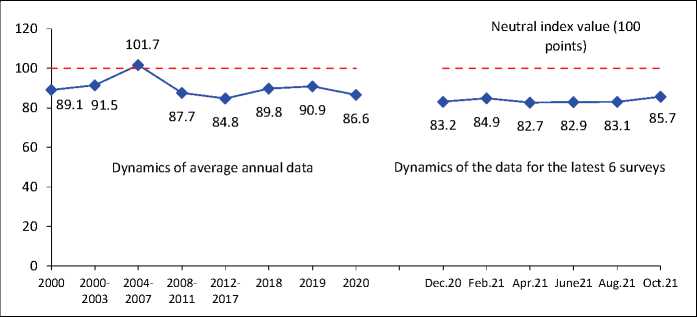
In August – October 2021, there was an increase in the consumer sentiment index (by 3 points, from 83 to 86 p.), which indicates a slight increase in people’s optimistic moods about the dynamics of the economic situation in the country and their personal financial situation.
The CSI is still below 100 points (which means the predominance of pessimistic forecasts in the Oblast in general); however, we should note that positive changes are observed for the first time in the past six months. Compared to December 2020, in October 2021, the consumer sentiment index increased by 3 points (from 83 to 86 p.).
For reference: according to the latest data from Levada-Center* (included in the register of foreign agents), the consumer sentiment index in the whole country did not change in June – August 2021 (75 p.); for the period from September 2020 to August 2021, it increased by 2 points (from 73 to 75 p.)
Estimation of social condition (% of respondents; VolRC RAS data)
Social mood
Stock of patience
|
Annual dynamics (October 2021 to December 2020) |
|
|
Respond option |
Dynamics (+ / –) |
|
Usual condition, good mood |
+11 |
|
I feel stress, irritation, fear, sadness |
–6 |
Dynamics of the data for the latest 6 surveys
64.9
Dynamics of average annual data
71.4 74.0 78.5 77.1 77.0 72.3
66.8

22.3 17.6 15.8 14.8 16.3 17.2 19.9
74.1 76.5 77.0 77.2

20.9 20.4 19 17.7 16.7 17.1

2000 2000- 2004- 2008- 2012- 2018 2019 2020
2003 2007 2011 2017
—е— Everything is not so bad; it’s difficult to live, but it’s possible to stand it
— ■ — It’s impossible to bear such plight
Dec/20 Feb.21 Apr.21 June21 Aug.21 Oct.21
|
Annual dynamics (October 2021 to December 2020) |
|
|
Respond option |
Dynamics (+ / –) |
|
Everything is not so bad; it’s difficult to live, but it’s possible to stand it |
+7 |
|
It’s impossible to bear such plight |
–4 |
Social self-identification*
Dynamics of average annual data
Dynamics of the data for the latest 6 surveys
55.4 50.2 44.6 47.9 45.4 46.8 49.4
61,.3
41.1 44.7 42.6 42.3 42.4 39.1
49.1 48.4 48.4 47.0 47.9 50.4

39.3 39.8 40 41.6 41.3 39.3
2000 2000- 2004- 2008- 2012- 2018 2019 2020
2003 2007 2011 2017
Dec.20 Feb.21 Apr.21 June21 Aug.21 Oct.21
|
Annual dynamics (October 2021 to December 2020) |
|
|
Respond option |
Dynamics (+ / –) |
|
People with average income |
0 |
|
Poor and extremely poor |
+1 |
— ■ — Poor and extremely poor —•— People with average income
Question: “Which category do You belong to, in your opinion?”
Consumer Sentiment Index (CSI, points; data of VolRC RAS for the Vologda Oblast)
|
Annual dynamics (October 2021 to December 2020) |
|
|
CSI |
Dynamics (+ / –) |
|
Index value, points |
+3 |
Consumer Sentiment Index (CSI; Levada-Center* data for Russia)

Dynamics of average annual data
2008 - 2012 - 2018 2019 2020
2011 2017
Neutral index value (100 points)

75 75
73 69 74
Dynamics of the data for the latest 6 surveys
|
Annual dynamics (August 2021 to September 2020) |
|
|
CSI |
Dynamics (+ / –) |
|
Index value, points |
+2 |
Sep.20 Nov.20 Feb.21 Apr.21 June21 Aug.21
The index is calculated since 2008.
Latest data is for June 2021. There are no data for the period from April to August 2020.
Source: Levada-Center* data. Available at:
Over the past two months, the share of people who positively characterize their daily mood has increased in 6 out of 14 socio-demographic groups, especially among people over the age of 60 (by 10 p.p., from 58 to 68%), as well as among those who, according to self-estimates of their own income, belong to the category of 20% of the least affluent residents of the Oblast (by 5 p.p., from 55 to 60%).
Negative changes in the dynamics of social mood assessments are noted among people under the age of 30 (by 7 p.p., from 82 to 75%), as well as in the group of 20% of the wealthiest residents of the region (by 3 p.p., from 87 to 84%).
For the period from December 2020 to October 2021, positive changes in social mood are observed in all major socio-demographic groups, especially among people who, according to self-estimates of their income, belong to the bottom 20% (by 21 p.p., from 39 to 60%).
Social mood in different social groups (respond option “Wonderful mood, normal, stable condition”, % of respondents; VolRC RAS data)
|
Population group |
Dynamics of average annual data |
Dynamics of the data for the latest 6 surveys |
Dynamics (+/–), Oct. 2021 to Dec. 2020 |
|||||||||||
|
2000 |
2007 |
2011 |
2012 |
2018 |
2019 |
2020 |
Dec. 2020 |
Feb. 2021 |
Apr. 2021 |
June 2021 |
Aug. 2021 |
Oct. 202 |
||
|
Sex |
||||||||||||||
|
Men |
50.1 |
65.9 |
64.5 |
69.1 |
72.8 |
70.1 |
60.8 |
60.0 |
60.8 |
61.3 |
65.1 |
65.6 |
70.0 |
+10 |
|
Women |
43.3 |
61.7 |
62.0 |
65.8 |
69.8 |
69.6 |
61.2 |
59.8 |
59.2 |
64.9 |
66.7 |
69.8 |
70.9 |
+11 |
|
Age |
||||||||||||||
|
Under 30 |
59.1 |
71.3 |
70.0 |
72.3 |
80.0 |
81.1 |
67.6 |
65.2 |
60.9 |
67.4 |
73.0 |
82.3 |
75.3 |
+10 |
|
30–55 |
44.2 |
64.8 |
62.5 |
67.9 |
72.6 |
71.2 |
61.8 |
60.9 |
64.4 |
65.5 |
70.0 |
71.4 |
70.8 |
+10 |
|
Over 55 |
37.4 |
54.8 |
58.3 |
62.1 |
65.2 |
63.3 |
57.4 |
56.5 |
54.1 |
59.1 |
58.3 |
58.1 |
68.3 |
+12 |
|
Education |
||||||||||||||
|
Secondary and incomplete secondary |
41.7 |
58.4 |
57.4 |
57.2 |
64.8 |
63.2 |
56.1 |
52.6 |
56.2 |
56.9 |
62.5 |
63.2 |
64.1 |
+12 |
|
Secondary vocational |
46.4 |
64.6 |
63.6 |
66.7 |
72.2 |
72.7 |
63.5 |
62.5 |
60.9 |
64.3 |
66.1 |
68.5 |
70.4 |
+8 |
|
Higher and incomplete higher |
53.3 |
68.6 |
68.3 |
77.0 |
76.8 |
73.4 |
63.3 |
64.6 |
62.7 |
68.7 |
69.7 |
73.0 |
77.1 |
+13 |
|
Income groups |
||||||||||||||
|
Bottom 20% |
28.4 |
51.6 |
45.3 |
51.5 |
57.3 |
53.2 |
43.4 |
38.9 |
44.3 |
49.8 |
54.2 |
55.0 |
60.4 |
+21 |
|
Middle 60% |
45.5 |
62.9 |
65.3 |
68.7 |
71.9 |
71.4 |
62.6 |
63.3 |
60.1 |
65.8 |
67.0 |
68.9 |
70.9 |
+8 |
|
Top 20% |
64.6 |
74.9 |
75.3 |
81.1 |
82.9 |
81.8 |
75.6 |
76.3 |
76.0 |
70.8 |
76.5 |
86.7 |
84.2 |
+8 |
|
Territories |
||||||||||||||
|
Vologda |
49.2 |
63.1 |
67.1 |
73.6 |
71.0 |
68.6 |
60.9 |
58.7 |
55.8 |
57.0 |
59.4 |
59.7 |
64.0 |
+6 |
|
Cherepovets |
50.8 |
68.1 |
71.2 |
76.2 |
75.8 |
71.2 |
60.4 |
60.7 |
64.4 |
68.1 |
70.8 |
72.3 |
75.2 |
+15 |
|
Districts |
42.2 |
61.6 |
57.1 |
59.8 |
68.7 |
69.8 |
61.4 |
60.0 |
59.7 |
64.0 |
67.1 |
70.1 |
71.5 |
+12 |
|
Oblast |
46.2 |
63.6 |
63.1 |
67.3 |
71.2 |
69.9 |
61.0 |
59.9 |
59.9 |
63.3 |
66.0 |
67.9 |
70.5 |
+11 |
CONCLUSIONS
The results of the next “wave” of public opinion monitoring conducted in October 2021 indicate several largely contradictory trends.
On the one hand, support for the work of the authorities remains stable. The share of positive assessments concerning the work of the RF President has remained at the level of 50–52% over the past 6 polls. There are also no significant changes in the assessments of V.V. Putin’s work on addressing Russia’s key problems (with the exception of a slight decrease, in October 2021, in the proportion of people who believe that the RF President is successfully coping with strengthening Russia’s international positions (by 3 p.p., from 49 to 46%)
The structure of people’s political preferences as a whole reflects the results of the elections to the State Duma held on September 17–19, 2021. We observe:
V a stable share of supporters of the United Russia party (31—33% in the last 6 polls);
V over the same period (from December 2020 to October 2021) — the growth of support for the Communist Party (by 4 p.p., from 7 to 11%);
V a noticeable decrease in the proportion of citizens who have not made up their mind yet or who believe that none of the main political parties reflects their interests. Over the past two months, their share decreased by 6 p.p. (from 44 to 38%), over the last 6 surveys – by 8 p.p. (from 46 to 38%).
Since February 2021, the proportion of residents of the Oblast who characterize their mood as “normal, excellent” has been steadily growing. Over the past two months, their share increased by 3 p.p. (from 68 to 71%), in general, for the period from February to October 2021 – by 11 p.p. (from 60 to 71%).
At the same time, it is important to note that over the past two months, the share of positive assessments of social mood in the Oblast as a whole has increased primarily due to assessments of socially vulnerable groups – people over 60 years of age and low-income groups. This, in our opinion, suggests that the social orientation of the state (which can be traced in the public speeches of the president, in the amendments to the Constitution he proposed, and in the measures of financial support for citizens regularly taken by the RF Government) is reflected in the assessments of public opinion. The question is whether the authorities will be able to maintain this positive trend.
Another important positive change for the period from August to October 2021 was, in our opinion, an increase in the consumer sentiment index (by 3 points, from 83 to 86 p.), which indicates an improvement in the forecasts of the population regarding the prospects for the development of the Russian economy and their personal financial situation. The increase in the consumer sentiment index is still extremely insignificant; perhaps it will not become a trend; in addition, it should be noted that the CSI still remains in the zone below 100 p., which indicates the predominance of pessimistic expectations among the people. And, nevertheless, taking into account the dynamics of the previous months (in which no positive changes have been observed for a long time), the growth of the CSI by 3 p.p. compared to the previous “wave” of surveys is a rather significant and indicative result; in our opinion, it is closely related to the already noted long-term trend of improving social sentiment.
Thus, according to the results of sociological surveys (those conducted not only in the Vologda Oblast, but also nationwide), positive changes or, at least, the absence of negative ones are noted according to many very significant criteria for evaluating the effectiveness of public administration. During the period of the State Duma election, as well as against the background of the ongoing threat of the COVID-19 pandemic, this, of course, can be regarded as an achievement of the authorities at all levels and the head of state himself.
However, at the same time, judging by the dynamics of public sentiment, there is no tangible progress in solving the most pressing, lingering problems. Here, first of all, we are talking about people’s subjective perception of the dynamics of the standard of living and quality of life. According to the results of the latest survey, the proportion of people subjectively classifying themselves as “poor and extremely poor” (which has long prevailed over the proportion of “middle-income” people) has increased by 2 p.p. over the past two months (from 48 to 50%) and, thus, exceeded the annual average for the period since 2008.
At the same time, we see that negative trends in assessing the Russian President’s work aimed at promoting economic recovery and the growth of citizens’ welfare: over the past three surveys (from June to October 2021), the share of negative judgments increased by 3 p.p. (from 60 to 63%), and over the past 3 years (from 2018 to 2020) – by 5 p.p. (from 56 to 61%).
Thus, while we observe favorable long-term trends and short-term changes in the dynamics of social well-being, in the change in consumer sentiment, and amid the absence of any signs of deterioration in the assessments of the work of the authorities, there still remains an alarming situation regarding overcoming the problem of poverty (or rather, people’s subjective perception of the dynamics of the standard of living and quality of life), which V.V. Putin called “our main enemy” and “a threat to stable development, to the demographic future”4.
In fact, this assessment is the most comprehensive reflection of the state of the entire public administration system: on the one hand, recognition of its still insufficient effectiveness in solving the most pressing problems of concern to the population, on the other hand, awareness of the need for its system-wide and comprehensive adjustment. In particular, in order to justify the “credit of trust” given to Vladimir Putin in the presidential election of 2018 and to the United Russia, the party of power, in the parliamentary election of 2021; or, in other words, so as not to lose the existing legitimacy of the implemented political course in the assessments of public opinion.
Materials were prepared by M.V. Morev, E.E. Leonidova, I.M. Bakhvalova
