Public Opinion Monitoring of the State of the Russian Society
Автор: Kosygina K.E., Bakhvalova I.M.
Журнал: Economic and Social Changes: Facts, Trends, Forecast @volnc-esc-en
Рубрика: Monitoring studies
Статья в выпуске: 3 т.18, 2025 года.
Бесплатный доступ
Короткий адрес: https://sciup.org/147251540
IDR: 147251540 | DOI: 10.15838/esc.2025.3.99.15
Текст статьи Public Opinion Monitoring of the State of the Russian Society
Source: VCIOM. Available at:
Source: Levada-Center*. Available at:
|
Response |
Dynamics (+/-), June 2025 to |
|
|
June 2024 |
Apr. 2025 |
|
|
I approve |
-1 |
-1 |
|
I disapprove |
0 |
0 |
In your opinion, how successful is the RF President in handling challenging issues?(% of respondents; VolRC RAS data)
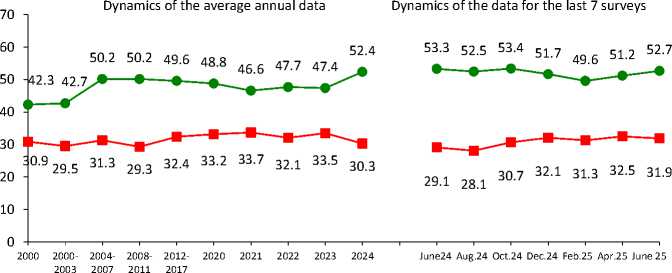
The share of residents of the region who consider the actions of the President of the Russian Federation to strengthen Russia’s international position to be successful was 53% in April – June 2025. The proportion of those who adhere to the opposite point of view was significantly lower (32%).
Compared to June 2024, the proportion of positive ratings remained unchanged in June 2025.
The proportion of negative judgments increased by 3 percentage points (from 29 to 32%).
Strengthening Russia’s international position
—•— Successful — ■ — Unsuccessful
|
Response |
Dynamics (+/-), June 2025 to |
|
|
June 2024 |
Apr. 2025 |
|
|
Successful |
-1 |
+2 |
|
Unsuccessful |
+3 |
-1 |
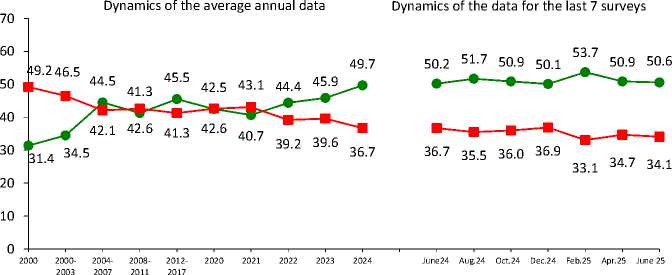
Over the past two months, the opinion of the residents of the region about the activities of the head of state to restore order in the country has remained the same: the share of positive judgments was 51%, negative – 34–35%.
From June 2024 to June 2025, the proportion of people who believe that the President of the Russian Federation is unsuccessfully managing to restore order in the country remains stable (37–34%). The share of positive ratings has not changed and stands at 51%.
Imposing order in the country
—•— Successful — ■ — Unsuccessful
|
Response |
Dynamics (+/-), June 2025 to |
|
|
June 2024 |
Apr. 2025 |
|
|
Successful |
0 |
0 |
|
Unsuccessful |
-3 |
-1 |
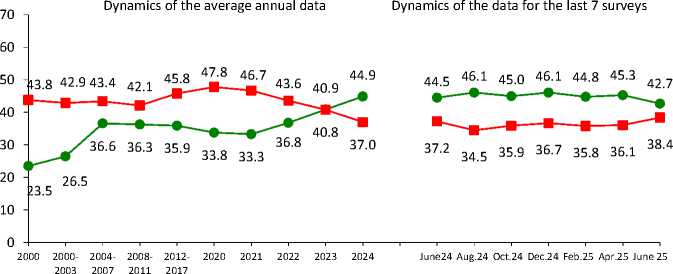
In June, compared with April 2025, the share of residents of the region who positively assess the activities of the President of the Russian Federation to protect democracy and strengthen citizens’ freedoms decreased slightly (from 45 to 43%); the proportion of opposing opinions remains stable.
The population estimates have not changed in 12 months. The proportion of those approving the head of state’s work to protect democracy and strengthen citizens’ freedoms was 43–44%; the proportion of negative judgments was lower (37–38%).
Protecting democracy and strengthening citizens’ freedoms
Successful — ■ — Unsuccessful
|
Response |
Dynamics (+/-), June 2025 to |
|
|
June 2024 |
Apr. 2025 |
|
|
Successful |
-2 |
-3 |
|
Unsuccessful |
+1 |
+2 |
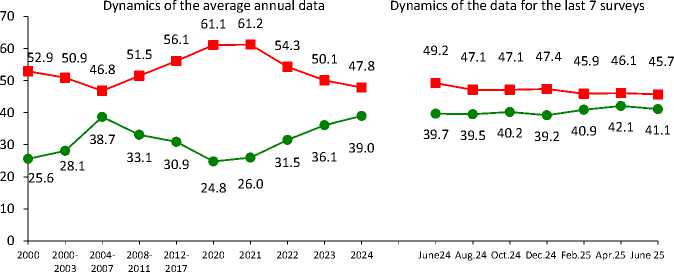
The share of positive assessments of the success of the Russian President’s solution to the problem of economic recovery and the growth of citizens’ well-being in April – June 2025 did not change and amounted to 41–42%.
From June 2024 to June 2025, the proportion of negative judgments regarding the activities of the head of state in addressing economic issues decreased by 4 percentage points, from 49 to 45%.
Economic recovery, increase in citizens’ welfare
—•— Successful — ■ — Unsuccessful
|
Response |
Dynamics (+/-), June 2025 to |
|
|
June 2024 |
Apr. 2025 |
|
|
Successful |
+1 |
-1 |
|
Unsuccessful |
-4 |
0 |
The political preferences of Vologda Region residents remained stable in April – June 2025. As before, the share of people whose interests are expressed by the United Russia party was 41–42%, the Communist Party – 8–9%, the Liberal Democratic Party – 7–9%, Just Russia – 3%, New People – 3–4%.
In the period from June 2024 to June 2025, the level of support for the represented political parties did not change.
Which party expresses your interests? (% of respondents; VolRC RAS data)
|
Party |
Dynamics of the average annual data |
Dynamics of the data for the last 7 surveys |
Dynamics (+/-), June 2025 to |
|||||||||||||||||||
|
g |
co оз E a CD CO co dc CD |
CD |
CO cd" 03 E a CD 00 CO ОС CD .52 |
co |
CM |
co оз E a CD CO CO DC CD |
CD ~Э |
о |
CD О |
C\J и_ |
C\J |
C\J CD -э |
CD -э |
C\J |
||||||||
|
United Russia |
18.5 |
31.1 |
33.4 |
29.1 |
35.4 |
38.0 |
37.9 |
31.5 |
49.8 |
31.7 |
35.2 |
39.5 |
42.9 |
43.7 |
42.5 |
41.8 |
42.3 |
39.9 |
40.5 |
41.6 |
-2 |
+1 |
|
KPRF |
11.5 |
10.3 |
16.8 |
10.6 |
8.3 |
14.2 |
9.2 |
8.4 |
18.9 |
9.3 |
10.1 |
9.6 |
8.9 |
8.2 |
9.7 |
8.7 |
9.1 |
8.8 |
8.0 |
9.1 |
+1 |
+1 |
|
LDPR |
4.8 |
7.8 |
15.4 |
7.8 |
10.4 |
21.9 |
9.6 |
9.5 |
7.6 |
9.9 |
7.3 |
7.0 |
7.1 |
7.1 |
6.1 |
7.5 |
8.8 |
7.5 |
7.1 |
9.4 |
+2 |
+2 |
|
New People* |
– |
– |
– |
– |
– |
– |
– |
– |
5.3 |
2.3 |
1.5 |
1.9 |
2.0 |
2.7 |
3.5 |
4.2 |
4.4 |
3.1 |
2.9 |
3.9 |
+1 |
+1 |
|
Just Russia – Patriots for the Truth |
– |
5.6 |
27.2 |
6.6 |
4.2 |
10.8 |
2.9 |
4.7 |
7.5 |
4.7 |
4.9 |
4.4 |
3.5 |
2.3 |
1.6 |
2.3 |
2.3 |
2.3 |
3.0 |
2.5 |
0 |
-1 |
|
Other |
0.9 |
1.9 |
– |
2.1 |
0.3 |
– |
0.7 |
0.5 |
– |
0.2 |
0.3 |
0.1 |
0.2 |
0.1 |
0.0 |
0.3 |
0.3 |
0.3 |
0.0 |
0.1 |
0 |
0 |
|
None |
29.6 |
29.4 |
– |
31.3 |
29.4 |
– |
28.5 |
34.2 |
– |
33.9 |
30.6 |
26.5 |
25.2 |
26.1 |
25.1 |
24.1 |
26.3 |
28.4 |
27.7 |
24.9 |
-1 |
-3 |
|
Difficult to answer |
20.3 |
13.2 |
– |
11.7 |
12.0 |
– |
11.2 |
11.1 |
– |
10.0 |
10.1 |
11.1 |
10.3 |
9.8 |
11.5 |
11.0 |
6.5 |
9.7 |
10.8 |
8.5 |
-1 |
-2 |
* The New People party was elected to the State Duma of the Russian Federation for the first time following the results of the election held on September 17–19, 2021.
Estimation of social condition (% of respondents; VolRC RAS data)
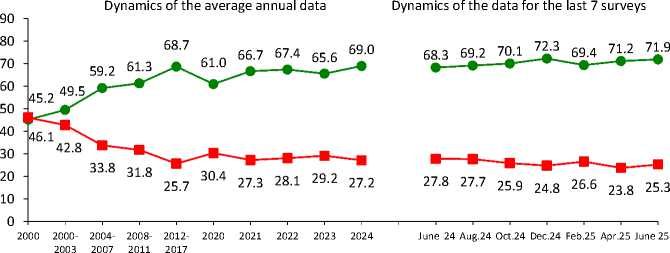
Over the past two months, the share of positive assessments of social mood amounted to 71–72%; the share of negative characteristics was 24–25%.
Over the past 12 months, the proportion of people describing their mood as “normal, fine” increased by 4 percentage points (from 68 to 72%). The proportion of those who more often experience «tension, irritation, fear, sadness» decreased by 3 percentage points, from 28 to 25%.
Social mood
—•— Normal condition, good mood
■ ■ I feel tension, irritation, fear, sadness
|
Response |
Dynamics (+/-), June 2025 to |
|
|
June 2024 |
Apr. 2025 |
|
|
Normal condition, good mood |
+4 |
+1 |
|
I feel tension, irritation, fear, sadness |
-3 |
+2 |
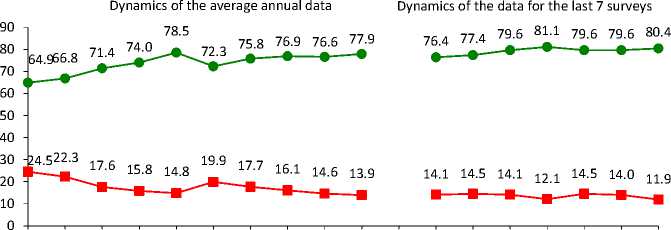
The reserve of patience remains at a consistently high level: 80% of residents of the region in April – June 2025 noted that “everything is not so bad and life is livable”. The proportion of those who believe that it is “no longer possible” to bear their plight was 12–14%.
In June 2025, compared with June 2024, we observe a positive trend: the share of positive assessments of the stock of patience increased by 4 percentage points, from 76 to 80%
Stock of patience
2000 2000- 2004- 2008- 2012- 2020 2021 2022 2023 2024 June 24 Aug.24 Oct.24 Dec.24 Feb.25 Apr.25 June 25
2003 2007 2011 2017
—•— Everything is not so bad and life is livable; life is hard, but we can endure it
— ■ — It’s impossible to bear such plight
|
Response |
Dynamics (+/-), June 2025 to |
|
|
June 2024 |
Apr. 2025 |
|
|
Everything is not so bad and life is livable; life is hard, but we can endure it |
+4 |
+1 |
|
It’s impossible to bear such plight |
-2 |
-2 |
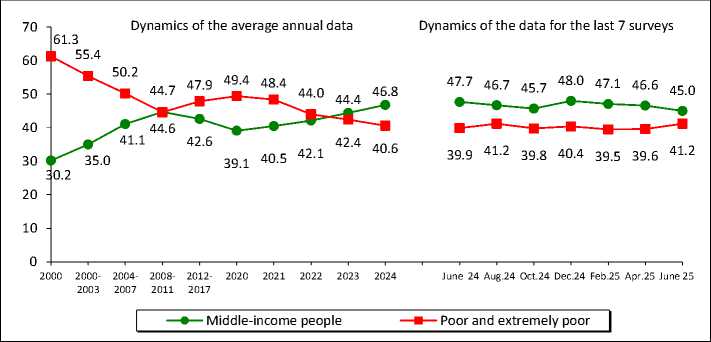
As in April, in June 2025 the share of residents of the region subjectively classifying themselves as “middle-income” people was 45–47%. The proportion of those who identify themselves as “poor and extremely poor” did not change as well (40–41%).
In June 2025, compared with June 2024, the proportion of those who consider themselves to be middle-income people decreased by 3 percentage points (from 48 to 45%).
Social self-identification
Wording of the question: “What category do you belong to, in your opinion?”
|
Response |
Dynamics (+/-), June 2025 to |
|
|
June 2024 |
Apr. 2025 |
|
|
Middle-income people |
-3 |
-2 |
|
Poor and extremely poor |
+1 |
+2 |
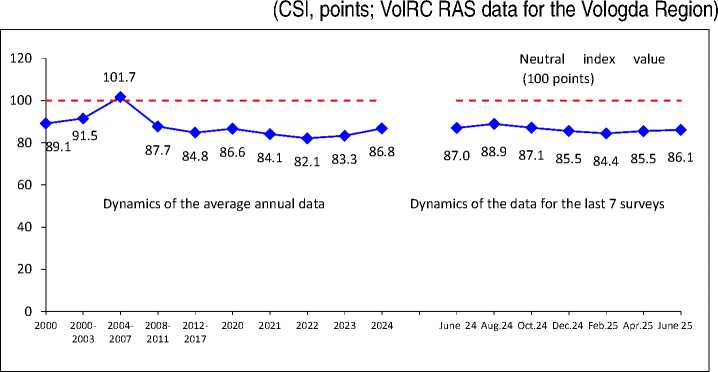
The Consumer Sentiment Index (CSI) in April – June 2025 amounted to 86 points.
There were also no significant changes in the CSI over the year (86–87 points).
Consumer Sentiment Index
|
CSI |
Dynamics (+/-), June 2025 to |
|
|
June 2024 |
Apr. 2025 |
|
|
Index value, points |
-1 |
+1 |
1 18.0 117 .0 109.0 112.0 109.0 113.0 116.0
90.3
113.8
108.8

Dynamics of the average annual data
Neutral index value (100 points)
Dynamics of the data for the last 7 surveys
2012- 2018 2020 2021 2022 2023 2024
Apr.24 June24 Aug.24 Oct.24 Dec.24 Feb.25 Apr.25
|
CSI |
Dynamics (+/-), June 2025 to |
|
|
Apr. 2024 |
Feb. 2025 |
|
|
Index value, points |
-2 |
+3 |
The index is calculated since 2008. The latest data – as of April 2025.
Source: Levada-Center*. Available at:
During the period from April to June 2025, there were no significant changes in the dynamics of the share of positive assessments of social mood in all socio-demographic groups.
During the year (from June 2024 to June 2025), the share of positive assessments of social mood increased in most major socio-demographic groups (in 9 out of 14). The largest increase is observed in men (by 8 percentage points); people with secondary education (by 9 percentage points); people under the age of 30 and over 55 (by 5 percentage points), as well as in all income groups. An increase in the values of social mood is recorded in Vologda (by 4 percentage points) and districts of the Vologda Region (by 5 percentage points).
4 Since March 2025, Levada-Center* has updated data on the CSI. The CSI in Russia has been calculated since 1993 on the basis of five questions, similar to the index developed in the 1940s by the Institute for Social Research at the University of Michigan. The individual indices for each question are calculated as the difference between the proportions of positive and negative responses plus 100. The cumulative CSI is the arithmetic mean of individual indices (range 0–200, where >100 is the predominance of positive ratings). In 2009, the CSI was linked to the values of March 2008 (100% base), which was associated with a change in the methodology of surveys and the economic crisis. However, this led to the fact that the index began to reflect changes only relative to 2008. Since March 2025, it was decided to return to the original method of calculating the CSI, abandoning the link to 2008, because in 2023, many indicators exceeded the peaks of 2008 and the old version of the index ceased to adequately reflect the current situation. A return to the original methodology is intended to solve this problem. Source: Updated Consumer Sentiment Index: February 2025 Figures. Available at:
*Included in the register of foreign agents.
Social mood in different social groups (response: “Wonderful mood, normal, stable condition”, % of respondents; VolRC RAS data)
|
Population group |
Dynamics of the average annual data |
Dynamics of the data for the last 7 surveys |
Изменение (+/-), июнь 2025 к |
|||||||||||||||
|
2000 |
2007 |
2012 |
2018 |
2020 |
2021 |
2022 |
2023 |
2024 |
June 2024 |
Aug. 2024 |
Oct. 2024 |
Dec. 2024 |
Feb. 2025 |
Apr. 2025 |
June 2025 |
June 2024 |
Apr. 2025 |
|
|
Gender |
||||||||||||||||||
|
Men |
50.1 |
65.9 |
69.1 |
72.8 |
60.8 |
65.7 |
66.8 |
65.5 |
66.5 |
63.5 |
67.1 |
65.2 |
69.2 |
70.1 |
68.8 |
71.6 |
+8 |
+3 |
|
Women |
43.3 |
61.7 |
65.8 |
69.8 |
61.2 |
67.4 |
67.9 |
65.7 |
70.9 |
72.1 |
70.9 |
74.0 |
74.7 |
68.8 |
73.1 |
72.2 |
0 |
-1 |
|
Age |
||||||||||||||||||
|
Under 30 |
59.1 |
71.3 |
72.3 |
79.9 |
67.6 |
73.5 |
77.6 |
75.0 |
76.6 |
71.8 |
76.1 |
78.0 |
81.3 |
79.9 |
76.7 |
76.7 |
+5 |
0 |
|
30–55 |
44.2 |
64.8 |
67.9 |
72.6 |
61.8 |
69.5 |
69.4 |
68.8 |
71.3 |
71.8 |
72.8 |
69.8 |
73.2 |
70.2 |
74.1 |
74.1 |
+2 |
0 |
|
Over 55 |
37.4 |
54.8 |
62.1 |
65.2 |
57.4 |
60.5 |
61.1 |
58.2 |
63.3 |
62.7 |
62.1 |
67.4 |
67.8 |
64.6 |
65.8 |
67.6 |
+5 |
+2 |
|
Education |
||||||||||||||||||
|
Secondary and incomplete secondary |
41.7 |
58.4 |
57.2 |
64.8 |
56.1 |
62.1 |
64.6 |
62.0 |
64.6 |
65.5 |
65.3 |
62.5 |
65.5 |
64.6 |
65.6 |
68.4 |
+3 |
+3 |
|
Secondary vocational |
46.4 |
64.6 |
66.7 |
72.1 |
63.5 |
66.7 |
68.3 |
66.1 |
70.3 |
65.2 |
70.7 |
75.2 |
76.5 |
71.8 |
74.8 |
74.1 |
+9 |
-1 |
|
Higher and incomplete higher |
53.3 |
68.6 |
77.0 |
76.7 |
63.3 |
71.5 |
69.5 |
68.8 |
72.3 |
76.0 |
72.1 |
72.3 |
74.2 |
71.4 |
73.4 |
73.0 |
-3 |
0 |
|
Income group |
||||||||||||||||||
|
Bottom 20% |
28.4 |
51.6 |
51.5 |
57.2 |
43.4 |
54.6 |
57.0 |
50.1 |
53.5 |
51.3 |
53.7 |
54.8 |
55.7 |
55.9 |
56.9 |
56.1 |
+5 |
-1 |
|
Middle 60% |
45.5 |
62.9 |
68.7 |
72.1 |
62.6 |
67.3 |
68.1 |
67.4 |
70.7 |
70.0 |
71.0 |
73.6 |
74.2 |
70.5 |
72.6 |
74.4 |
+4 |
+2 |
|
Top 20% |
64.6 |
74.9 |
81.1 |
82.4 |
75.6 |
79.9 |
78.3 |
73.9 |
77.6 |
78.5 |
75.9 |
78.4 |
80.6 |
77.9 |
81.3 |
84.1 |
+6 |
+3 |
|
Territory |
||||||||||||||||||
|
Vologda |
49.2 |
63.1 |
73.6 |
71.0 |
60.9 |
60.3 |
59.8 |
59.6 |
66.0 |
65.2 |
66.4 |
67.9 |
69.6 |
66.7 |
68.6 |
69.5 |
+4 |
+1 |
|
Cherepovets |
50.8 |
68.1 |
76.2 |
75.7 |
60.4 |
71.0 |
71.2 |
68.1 |
69.8 |
69.4 |
70.2 |
70.7 |
73.0 |
69.9 |
71.5 |
72.5 |
+3 |
+1 |
|
Districts |
42.2 |
61.6 |
59.8 |
68.6 |
61.4 |
67.8 |
69.5 |
67.7 |
70.2 |
69.4 |
70.3 |
71.0 |
73.4 |
70.7 |
72.7 |
73.1 |
+4 |
0 |
|
Region |
46.2 |
63.6 |
67.3 |
71.2 |
61.0 |
66.6 |
67.4 |
65.6 |
69.0 |
68.3 |
69.2 |
70.1 |
72.3 |
69.4 |
71.2 |
71.9 |
+4 |
+1 |
RESUME
The latest round of the public opinion monitoring took place in May – June 2025 against the background of two key events. On the one hand, the 80th anniversary of Victory in the Great Patriotic War was widely celebrated, which was accompanied by nationwide large-scale events, patriotic actions and media coverage. According to a VCIOM study, “for Russians, this day is far from just a holiday, but a symbol of national pride and unity, a sacred, memorable date associated with liberation from fascism and the value of peace”5. On the other hand, negotiations were actively underway: two rounds of Russian-Ukrainian talks (on May 16 and June 2, 2025 in Istanbul); contacts between Russia and the United States (on May 19 and June 4, heads of state D. Trump and V. Putin held telephone talks). In general, this period was characterized by a complex intertwining of the patriotic upsurge associated with the Victory anniversary and the cautious expectation of the results of international negotiations.
Given the significance of these events for society, it is important to note that the monitoring results show the stability of the population’s assessments of key indicators of public administration effectiveness both over the two months of measurements and over the year.
In June 2024, the RF President’s approval rating remained consistently high (64–66%), which is confirmed by assessments of his work in key areas. At the same time, we observe a positive trend in the field of economics and improving the well-being of citizens: from June 2024 to June 2025, the proportion of negative judgments about the activities of the head of state on economic issues decreased by 4 percentage points, from 49 to 45%.
The political preferences of Vologda Region residents remain stable, the United Russia party is in the lead (41–42%), the population’s support for other parties has not changed (2–9%).
There are also no significant negative shifts in the dynamics of self-assessments of the standard of living (the share of “the poor and extremely poor” remained at the level of 40–41%, the proportion of people of “average income” – 45–48%) and prospects for its development (consumer sentiment index was 86–87 points).
The situation regarding the purchasing power of household incomes is also stable: almost half of the region’s residents (according to data for June 2025) note that “they have enough money to buy the necessary goods, but large purchases have to be postponed for later” (49%). While the share of those who “have enough money for food at best” is 30%, which is 2 times more than the proportion of people for whom “the purchase of most durable goods (refrigerator, TV) does not cause difficulties” (15%).
At the same time, we should note that over the past 27 years (from 1997 to 2024), the standard of living in the two groups – “the poor and extremely poor” and “rich and middle-income people” – has increased significantly. In other words, while the problem of social inequality remains highly relevant, the modern “poor and extremely poor” people are not what they used to be in the past: among them, for example, there is a signifncant increase in the proportion of those who own a motor vehicle (from 6 to 26%), a TV-set (from 31 to 64%), etc.
Assessment of provision of non-food products depending on social self-identification, % of respondents
|
“Provided to a sufficient extent” |
The poor and extremely poor |
Rich and middle-income people |
||
|
1997 |
2024 |
1997 |
2024 |
|
|
TV-set |
30.9 |
63.9 |
69.1 |
80.7 |
|
Vacuum cleaner |
31.8 |
55.9 |
60.7 |
75.3 |
|
Washing machine |
50.9 |
62.4 |
74.3 |
81.1 |
|
Fridge |
53.8 |
64.7 |
76.2 |
83.1 |
|
Furniture |
32.0 |
54.6 |
55.6 |
80.1 |
|
Motor vehicle |
5.8 |
26.2 |
24.4 |
55.2 |
|
Source: VolRC RAS public opinion monitoring. |
||||
Positive changes are observed in the social mood. From June 2024 to June 2025, the proportion of people describing their mood as “normal, fine” increased by 4 percentage points (from 68 to 72%), and the proportion of those experiencing negative emotions decreased slightly (by 3 percentage points). This indicates an improvement in the psychological climate in society. A high level of patience is also an important factor for stability: during the year, the share of positive assessments of the stock of patience increased by 4 percentage points, from 76 to 80%. In general, indicators of social mood remain consistently positive for the main socio-demographic groups, and estimates have improved in 9 out of 14 categories over the year.
Nevertheless, it should be borne in mind that the improvement in social mood may be due to seasonal factors, such as the holiday period, as shown by long-term annual observations. In order to maintain positive dynamics and prevent an increase in social tension, further work is required to improve the economic situation and raise the standard of living, which corresponds to the tasks set out in the state social policy and national projects.
Prepared by K.E. Kosygina and I.M. Bakhvalova
Economic and Social Changes: Facts, Trends, Forecast
Volume 18, Issue 3, 2025

