Public Opinion Monitoring of the State of the Russian Society

Author: Kosygina K.E., Bakhvalova I.M.
Journal: Economic and Social Changes: Facts, Trends, Forecast @volnc-esc-en
Section: Monitoring studies
Article in issue: 4 т.18, 2025.
Free access
Short address: https://sciup.org/147251843
IDR: 147251843 | DOI: 10.15838/esc.2025.4.100.17
Text of the article Public Opinion Monitoring of the State of the Russian Society
Source: VCIOM. Available at:
Source: Levada-Center*. Available at:
* Included in the register of foreign agents.
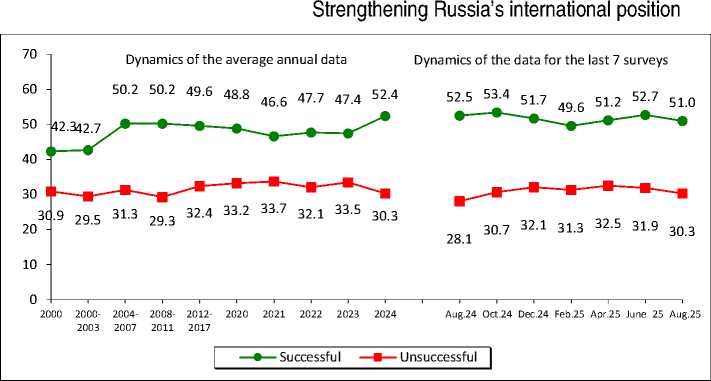
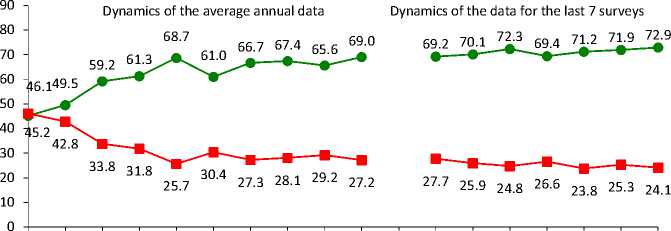
Over the past two months, the proportion of people who consider the actions of the President of the Russian Federation to strengthen Russia’s international position to be successful did not change and amounted to 51–53%. The share of those who adhere to the opposite point of view also remained at the level of June 2025 (30–32%).
Over the past 12 months (from August 2024 to August 2025), the share of positive assessments of the president’s work to strengthen Russia’s international position has decreased slightly (by 2 percentage points, from 53 to 51%).
In your opinion, how successful is the RF President in handling challenging issues? (% of respondents; VolRC RAS data)
|
Response |
Dynamics (+/-), Aug. 2025 to |
|
|
Aug. 2024 |
June 2025 |
|
|
Successful |
-2 |
-2 |
|
Unsuccessful |
+2 |
-2 |
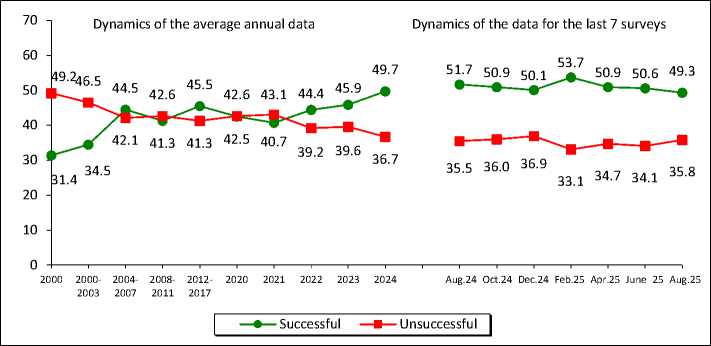
In June – August 2025, the share of residents of the region who positively assessed the work of the head of state to restore order in the country was 49–51%.
From August 2024 to August 2025, the share of positive ratings decreased slightly (from 52 to 49%).
Imposing order in the country
|
Response |
Dynamics (+/-), Aug. 2025 to |
|
|
Aug. 2024 |
June 2025 |
|
|
Successful |
-2 |
-1 |
|
Unsuccessful |
0 |
+2 |
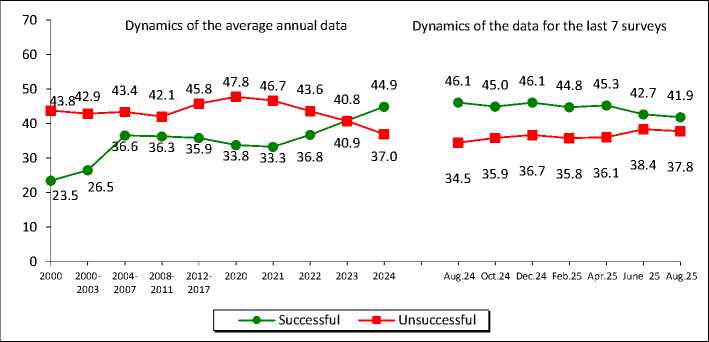
In June – August 2025, the share of positive assessments of the activities of the President of the Russian Federation to protect democracy and strengthen the freedoms of citizens amounted to 42–43%, the proportion of negative ones was 38%.
Over the past 12 months, the proportion of positive characteristics decreased (by 4 percentage points, from 46 to 42%) and the proportion of negative assessments increased (from 35 to 38%).
Protecting democracy and strengthening citizens’ freedoms
|
Response |
Dynamics (+/-), Aug. 2025 to |
|
|
Aug. 2024 |
June 2025 |
|
|
Successful |
-4 |
-1 |
|
Unsuccessful |
+3 |
-1 |
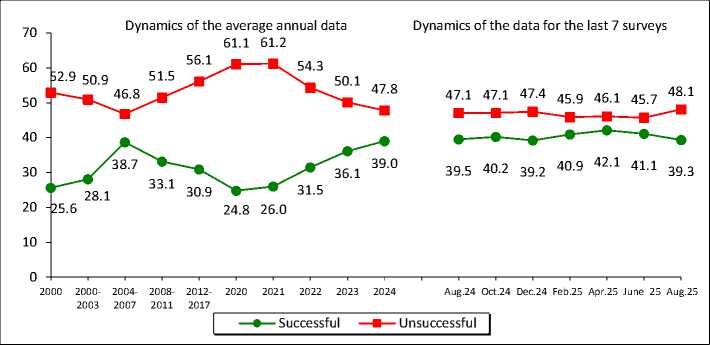
The share of positive opinions about the activities of the head of state to boost the economy and increase the welfare of citizens did not change significantly over the past two months (decreased by 2 percentage points from 41 to 39%). The share of negative characteristics increased from 46 to 48%.
Over the past 12 months, assessments of the work of the President of the Russian Federation on economic issues remained stable: the share of positive ones is 39%; negative – 47–48%.
Economic recovery, increase in citizens’ welfare
|
Response |
Dynamics (+/-), Aug. 2025 to |
|
|
Aug. 2024 |
June 2025 |
|
|
Successful |
0 |
-2 |
|
Unsuccessful |
+1 |
+2 |
In June – August 2025, the structure of political preferences of the residents of the region has not changed. According to residents, United Russia expresses the interests of 41%, the Communist Party of the Russian Federation – 9–11%, the Liberal Democratic Party – 9%, Just Russia – 4%, New People – 2%. The proportion of those who answered that there was no party expressing their interests is 23–25%.
From August 2024 to August 2025, the level of support for the represented political parties did not change significantly. The largest change is recorded in the estimates of the Liberal Democratic Party: an increase in positive judgments by 3 percentage points (from 6 to 9%)
Which party expresses your interests? (% of respondents; VolRC RAS data)
|
Party |
Dynamics of the average annual data |
Dynamics of the data for the last 7 surveys |
Dynamics (+/-), Aug. 2025 to |
|||||||||||||||||||
|
g |
co оз E a CD CO co dc CD |
CD |
CO cd" 03 E a CD 00 CO ОС CD .52 |
co |
CM |
co оз E a CD CO CO DC CD |
о |
CD О |
C\J и_ |
C\J |
C\J CD -э |
C\J |
ю CD ~Э |
|||||||||
|
United Russia |
18.5 |
31.1 |
33.4 |
29.1 |
35.4 |
38.0 |
37.9 |
31.5 |
49.8 |
31.7 |
35.2 |
39.5 |
42.9 |
42.5 |
41.8 |
42.3 |
39.9 |
40.5 |
41.6 |
41.2 |
-1 |
0 |
|
KPRF |
11.5 |
10.3 |
16.8 |
10.6 |
8.3 |
14.2 |
9.2 |
8.4 |
18.9 |
9.3 |
10.1 |
9.6 |
8.9 |
9.7 |
8.7 |
9.1 |
8.8 |
8.0 |
9.1 |
11.5 |
+2 |
+2 |
|
LDPR |
4.8 |
7.8 |
15.4 |
7.8 |
10.4 |
21.9 |
9.6 |
9.5 |
7.6 |
9.9 |
7.3 |
7.0 |
7.1 |
6.1 |
7.5 |
8.8 |
7.5 |
7.1 |
9.4 |
8.7 |
+3 |
-1 |
|
Just Russia – Patriots for the Truth |
- |
5.6 |
27.2 |
6.6 |
4.2 |
10.8 |
2.9 |
4.7 |
7.5 |
4.7 |
4.9 |
4.4 |
3.5 |
3.5 |
4.2 |
4.4 |
2.3 |
2.9 |
3.9 |
4.2 |
+1 |
0 |
|
New People* |
– |
– |
– |
– |
– |
– |
– |
– |
5.3 |
2.3 |
1.5 |
1.9 |
2.0 |
1.6 |
2.3 |
2.3 |
3.1 |
3.0 |
2.5 |
1.8 |
0 |
-1 |
|
Other |
0.9 |
1.9 |
– |
2.1 |
0.3 |
– |
0.7 |
0.5 |
– |
0.2 |
0.3 |
0.1 |
0.2 |
0.0 |
0.3 |
0.3 |
0.3 |
0.0 |
0.1 |
0.1 |
0 |
0 |
|
None |
29.6 |
29.4 |
– |
31.3 |
29.4 |
– |
28.5 |
34.2 |
– |
33.9 |
30.6 |
26.5 |
25.2 |
25.1 |
24.1 |
26.3 |
28.4 |
27.7 |
24.9 |
23.3 |
-2 |
-2 |
|
Difficult to answer |
20.3 |
13.2 |
– |
11.7 |
12.0 |
– |
11.2 |
11.1 |
– |
10.0 |
10.1 |
11.1 |
10.3 |
11.5 |
11.0 |
6.5 |
9.7 |
10.8 |
8.5 |
9.2 |
-2 |
+1 |
Estimation of social condition (% of respondents; VolRC RAS data)
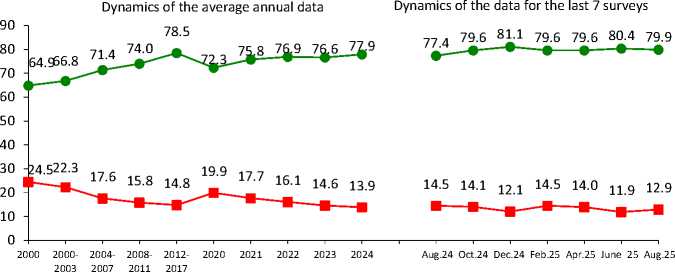
From June to August 2025, the share of positive assessments of social mood remained at the level of 72–73%. The proportion of people experiencing predominantly negative emotions also remained unchanged at 24–25%.
Over the past 12 months, the proportion of people describing their mood as «normal, fine» increased by 4 percentage points (from 69 to 73%). The proportion of those who more often experience «tension, irritation, fear, sadness» decreased by 4 percentage points, as well (from 28 to 24%).
Social mood
2000 2000- 2004- 2008- 2012- 2020 2021 2022 2023 2024 Aug.24 Oct.24 Dec.24 Feb.25 Apr.25 June 25 Aug.25
2003 2007 2011 2017
—•— Normal condition, good mood
— ■ — I feel tension, irritation, fear, sadness
|
Response |
Dynamics (+/-), Aug. 2025 to |
|
|
Aug. 2024 |
June 2025 |
|
|
Normal condition, good mood |
+4 |
+1 |
|
I feel tension, irritation, fear, sadness |
-4 |
-1 |
In June – August 2025, the proportion of people who believe that “everything is not so bad and life is livable” remains stable (80%), as well as the share of those who believe that their plight is “no longer possible to bear” (12–13%).
During the period from August 2024 to August 2025, the proportion of positive assessments of the stock of patience increased from 77 to 80%, while the proportion of negative judgments is significantly lower.
Stock of patience
—•— Everything is not so bad and life is livable; life is hard, but we can endure it
— ■ — It’s impossible to bear such plight
|
Response |
Dynamics (+/-), Aug. 2025 to |
|
|
Aug. 2024 |
June 2025 |
|
|
Everything is not so bad and life is livable; life is hard, but we can endure it |
+3 |
-1 |
|
It’s impossible to bear such plight |
-2 |
+1 |
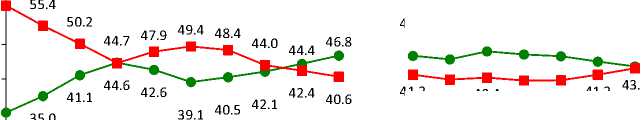
The proportion of residents of the region subjectively classifying themselves as “poor and extremely poor” in June – August 2025 amounted to 41–43%. The proportion of those who subjectively classify themselves as “middle-income people” is 44–45%.
There are also no noticeable changes in the annual dynamics. However, the share of residents of the region who consider themselves middle-income people decreased by 3 percentage points (from 47 to 44%).
Social self-identification
7061.3
Dynamics of the average annual data
Dynamics of the data for the last 7 surveys
46.7 45.7 48.0 47.1 46.6 45.0 43.6
41.2 39.8 40.4 39.5 39.6 41.2 1
30.2
|
Response |
Dynamics (+/-), Aug. 2025 to |
|
|
Aug. 2024 |
June 2025 |
|
|
Middle-income people |
-3 |
-1 |
|
Poor and extremely poor |
+2 |
+2 |
2000 2000- 2004- 2008- 2012- 2020 2021 2022 2023 2024 Aug.24 Oct.24 Dec.24 Feb.25 Apr.25 June 25 Aug.25
2003 2007 2011 2017
—•— Middle-income people — ■ — Poor and extremely poor
Wording of the question: “What category do you belong to, in your opinion?”
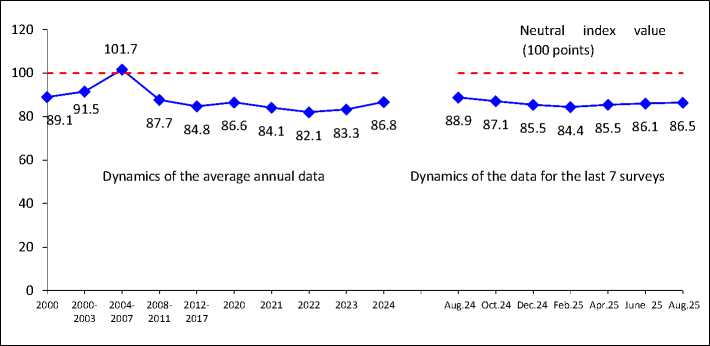
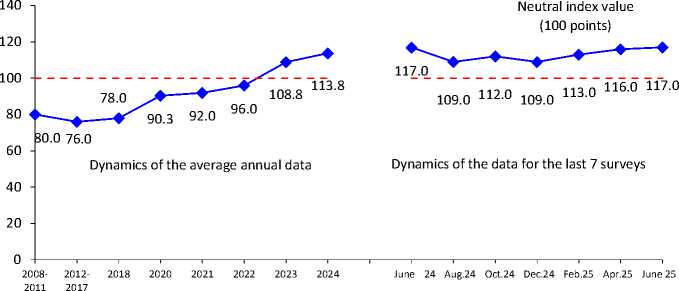
Over the past two months, the Consumer Sentiment Index (CSI) has not changed and amounted to 86 points.
Over the past year, the CSI changed slightly in the negative direction: it decreased by 2 percentage points, from 89 to 87 points.
Consumer Sentiment Index
(CSI, points; VolRC RAS data for the Vologda Region)
|
Response |
Dynamics (+/-), Aug. 2025 to |
|
|
Aug. 2024 |
June 2025 |
|
|
Index value, points |
-2 |
0 |
|
Response |
Dynamics (+/-), June 2025 to |
|
|
June 2024 |
Apr. 2025 |
|
|
Index value, points |
0 |
+1 |
The index is calculated since 2008.
The latest data – as of June 2025.
Source: Levada-Center*. Available at:
From June to August 2025, social mood assessments did not change significantly in all major sociodemographic groups.
In the social mood over the past 12 months (from August 2024 to August 2025), there has been a positive trend in the assessments in 7 out of 14 socio-demographic groups. At the same time, the most pronounced positive changes are recorded among the 20% of the most affluent (by 8 percentage points); residents of Vologda (by 7 percentage points); persons over 55 (by 6 percentage points). There are also no significant changes in estimates for 7 out of 14 socio-demographic groups.
Social mood in different social groups (response: “Wonderful mood, normal, stable condition”, % of respondents; VolRC RAS data)
|
Population group |
Dynamics of the average annual data |
Dynamics of the data for the last 7 surveys |
Dynamics (+/-), Aug. 2025 to |
|||||||||||||||
|
2000 |
2007 |
2012 |
2018 |
2020 |
2021 |
2022 |
2023 |
2024 |
Aug. 2024 |
Oct. 2024 |
Dec. 2024 |
Feb. 2025 |
Apr. 2025 |
June 2025 |
Авг. 2025 |
Aug. 2024 |
June 2025 |
|
|
Gender |
||||||||||||||||||
|
Men |
50.1 |
65.9 |
69.1 |
72.8 |
60.8 |
65.7 |
66.8 |
65.5 |
66.5 |
67.1 |
65.2 |
69.2 |
70.1 |
68.8 |
71.6 |
72.1 |
+5 |
+1 |
|
Women |
43.3 |
61.7 |
65.8 |
69.8 |
61.2 |
67.4 |
67.9 |
65.7 |
70.9 |
70.9 |
74.0 |
74.7 |
68.8 |
73.1 |
72.2 |
73.5 |
+3 |
+1 |
|
Age |
||||||||||||||||||
|
Under 30 |
59.1 |
71.3 |
72.3 |
79.9 |
67.6 |
73.5 |
77.6 |
75.0 |
76.6 |
76.1 |
78.0 |
81.3 |
79.9 |
76.7 |
76.7 |
78.1 |
+2 |
+1 |
|
30–55 |
44.2 |
64.8 |
67.9 |
72.6 |
61.8 |
69.5 |
69.4 |
68.8 |
71.3 |
72.8 |
69.8 |
73.2 |
70.2 |
74.1 |
74.1 |
74.9 |
+2 |
+1 |
|
Over 55 |
37.4 |
54.8 |
62.1 |
65.2 |
57.4 |
60.5 |
61.1 |
58.2 |
63.3 |
62.1 |
67.4 |
67.8 |
64.6 |
65.8 |
67.6 |
68.6 |
+6 |
+1 |
|
Education |
||||||||||||||||||
|
Secondary and incomplete secondary |
41.7 |
58.4 |
57.2 |
64.8 |
56.1 |
62.1 |
64.6 |
62.0 |
64.6 |
65.3 |
62.5 |
65.5 |
64.6 |
65.6 |
68.4 |
70.3 |
+5 |
+2 |
|
Secondary vocational |
46.4 |
64.6 |
66.7 |
72.1 |
63.5 |
66.7 |
68.3 |
66.1 |
70.3 |
70.7 |
75.2 |
76.5 |
71.8 |
74.8 |
74.1 |
73.6 |
+3 |
–1 |
|
Higher and incomplete higher |
53.3 |
68.6 |
77.0 |
76.7 |
63.3 |
71.5 |
69.5 |
68.8 |
72.3 |
72.1 |
72.3 |
74.2 |
71.4 |
73.4 |
73.0 |
74.7 |
+3 |
+2 |
|
Income group |
||||||||||||||||||
|
Bottom 20% |
28.4 |
51.6 |
51.5 |
57.2 |
43.4 |
54.6 |
57.0 |
50.1 |
53.5 |
53.7 |
54.8 |
55.7 |
55.9 |
56.9 |
56.1 |
58.3 |
+5 |
+2 |
|
Middle 60% |
45.5 |
62.9 |
68.7 |
72.1 |
62.6 |
67.3 |
68.1 |
67.4 |
70.7 |
71.0 |
73.6 |
74.2 |
70.5 |
72.6 |
74.4 |
73.1 |
+2 |
–1 |
|
Top 20% |
64.6 |
74.9 |
81.1 |
82.4 |
75.6 |
79.9 |
78.3 |
73.9 |
77.6 |
75.9 |
78.4 |
80.6 |
77.9 |
81.3 |
84.1 |
83.8 |
+8 |
0 |
|
Territory |
||||||||||||||||||
|
Vologda |
49.2 |
63.1 |
73.6 |
71.0 |
60.9 |
60.3 |
59.8 |
59.6 |
66.0 |
66.4 |
67.9 |
69.6 |
66.7 |
68.6 |
69.5 |
72.9 |
+7 |
+3 |
|
Cherepovets |
50.8 |
68.1 |
76.2 |
75.7 |
60.4 |
71.0 |
71.2 |
68.1 |
69.8 |
70.2 |
70.7 |
73.0 |
69.9 |
71.5 |
72.5 |
75.0 |
+5 |
+3 |
|
Districts |
42.2 |
61.6 |
59.8 |
68.6 |
61.4 |
67.8 |
69.5 |
67.7 |
70.2 |
70.3 |
71.0 |
73.4 |
70.7 |
72.7 |
73.1 |
71.6 |
+1 |
–2 |
|
Region |
46.2 |
63.6 |
67.3 |
71.2 |
61.0 |
66.6 |
67.4 |
65.6 |
69.0 |
69.2 |
70.1 |
72.3 |
69.4 |
71.2 |
71.9 |
72.9 |
+4 |
+1 |
|
Total number of groups: positive changes / no changes / negative changes |
14: 7 / 7 / 0 |
14: 0 / 14 / 0 |
||||||||||||||||
RESUME
The results of the latest round of the public opinion monitoring conducted in August 2025 showed that there were no significant changes in the dynamics of population estimates in the Vologda Region compared to the first summer months.
From August 2024 to August 2025, support for the President of the Russian Federation remains at a fairly high level (67%), despite a slight decrease in approval of his activities aimed to protect democratic freedoms (by 4 percentage points, from 46 to 42%). The party preferences of the residents of the region have also not undergone significant changes, which indicates the stability of political preferences. United Russia continues to hold the leading positions (41–43%), although a significant part of the population still does not see any political parties represented in the State Duma that express their interests (23–25%).
The social mood of the population remains positive with positive changes in the annual dynamics: the proportion of people noting “a great mood, a normal, even state” increased by 4 percentage points (from 69 to 73%). First of all, positive changes in social mood are observed among the most affluent segments of the population, the elderly and residents of Vologda. In addition, the population of the region invariably has a high stock of patience (80%). We should note that the improvement of social mood in many population groups is a very typical phenomenon for the summer months, especially when it comes to periods of adaptation of society to certain “force majeure” circumstances. The same situation, for example, was observed in the process of gradual adaptation of the population to living conditions during the COVID-19 pandemic.
Nevertheless, the proportion of people who classify themselves as “poor and extremely poor” remains significant at 43%. At the same time, over the past year, there has been a weakly pronounced negative trend: the proportion of low-income citizens (according to self-assessments) has increased from 41 to 43%, and the proportion of those who consider themselves middle class has decreased from 47 to 44%. This trend is confirmed by the Consumer Sentiment Index (CSI), which decreased by 2 points over the same period, from 89 to 87 points, indicating a slight deterioration in estimates of the financial situation of the population and their economic expectations.
The revealed negative trend of deterioration in self-assessments of the financial situation and prospects for the development of the economic situation may well be due to the fact that society is getting used to life in the context of the special military operation and, as a result, is increasingly beginning to worry about its daily life problems (although, of course, the range of issues related to the SMO and events in the foreign policy arena, does not leave the focus of citizens’ attention).
This, in particular, is evidenced by the conclusions obtained by VCIOM experts: “... there is a process of routinization. People have already integrated the special operation and everything related to it into their image of the world. It occupies a central place in it, but it is already more or less familiar, understandable and predictable. Therefore, there are fewer emotions associated with the SMO, and rational perception prevails ” 5 . We believe that the negotiation processes that have been taking place regularly at various levels since the beginning of 2025 (including the meeting of the presidents of the United States and Russia on August 15, 2025) also contribute to the transformation of the agenda of the social mood of Russian society.
Prepared by K.E. Kosygina and I.M. Bakhvalova
Economic and Social Changes: Facts, Trends, Forecast
Volume 18, Issue 4, 2025
