Qualitative visualization of the development of stresses through infrared thermography

Author: Эвен Станге, Захра Андлиб, Хассан А. Кхавайа
Journal: Вестник Мурманского государственного технического университета @vestnik-mstu
Article in issue: 4 т.22, 2019.
Free access
In this work, the IR thermography has been used to study the steel specimens (DIN 50125 Standard) undergoing the tensile tests. The tensile tests were performed using GUNT® Hamburg Universal Material Tester. The tensile specimens were clamped, and the test force was applied using a hand-operated hydraulic system. A dial gauge measured the elongation of the specimens. The steel specimens were coated with high emissivity paint. Using the WP 300.20 system for data acquisition, the measured values for force and displacement were recorded in a PC. The IR thermographic imaging was performed using the FLIR® T1030sc IR camera and ResearchIR Max software. The tests have revealed that the steel specimens show noticeable thermal signature when undergoing tensile loading.
IR thermography, tensile tests, thermal signature, ИК-термография, испытания на растяжение, тепловая характеристика
Short address: https://sciup.org/142221527
IDR: 142221527 | UDC: 669.14:620.172 | DOI: 10.21443/1560-9278-2019-22-4-503-507
Text of the article Qualitative visualization of the development of stresses through infrared thermography
The tensile tests were conducted with the intentions of generating stress – strain diagrams and thermographic images of the DIN 50125 standard steel specimens 1 . These tests were performed at room temperature conditions (25°). The tensile tests were repeated multiple times to ensure that repeatability of the results.
Methods
GU^T® Hamburg Universal Material Tester
The GUNT® Hamburg universal material tester 2 , displayed in Fig. 1, was used to carry out all the experimental tensile tests in this study. The tensile specimens are clamped between the upper cross member and the crosshead. The test force is generated by means of a hand-operated hydraulic system and displayed on a large force gauge with the pressure indicator. A dial gauge measures the elongation of the specimens.
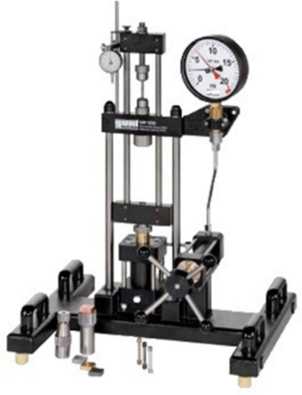
Fig. 1. The GUNT® Hamburg universal material tester
Рис. 1. Универсальный тестер GUNT® Hamburg
DI^ 50125 Standard Steel Test Specimens
The test specimens used were DIN 50125 standard steel 3 . The steel specimen has a circular cross-section, with two center punch marks on the shafts to mark the test length, as shown in Fig. 2.
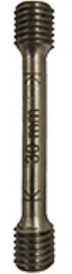
Fig. 2. The steel specimen with a circular cross-section
Рис. 2. Стальной образец с круглым поперечным сечением
Data Acquisition
The universal material tester used was equipped with an electronic measuring system. By using this system, measured values for force and displacement can be transferred to a computer and analyzed with the system software (Fig. 3). Measured values are evaluated in the user-friendly software, so stress – strain diagrams can be recorded. The raw data were exported and stored for all tensile tests performed.
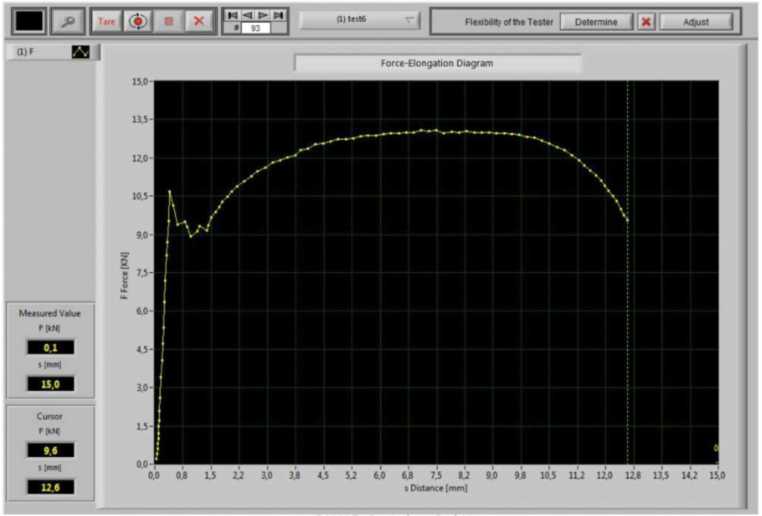
Fig. 3. Stress – strain data from WP300.20 GUNT® Hamburg universal material tester Рис. 3. Данные, полученные с помощью тестера GUNT® Hamburg, на экране монитора
Infrared Thermography
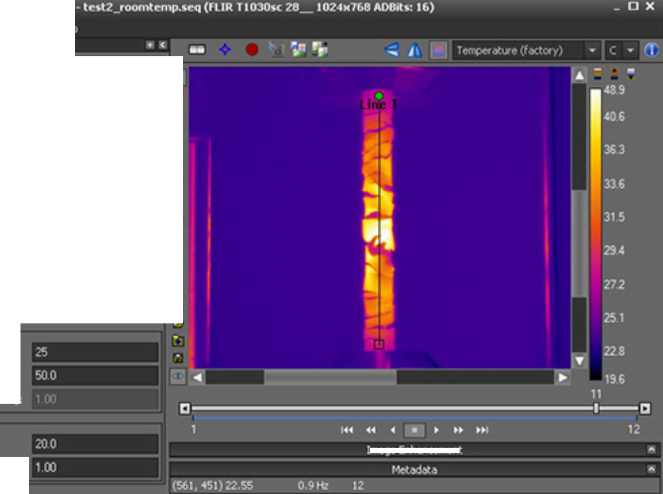
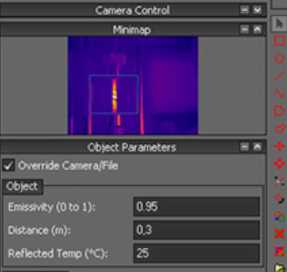
The test specimens were monitored with the infrared thermography throughout the course of the tensile tests using FLIR® T1030sc thermal camera 4 and analyzed using Researcher IR Max software 5 (Fig. 4), to investigate the heat generation associated due the thermoelastic/thermoplastic effects. With the use of thermography, the infrared wavelengths emitted from the test specimen were observed in high-definition thermal images. The rate of energy emitted as thermal radiation is highly dependent on the surface temperature. Small temperature changes in the test specimens generate visible thermal readings. Similar studies have been carried out by (Khawaja et al., 2016; Taimur et al., 2016; 2019; Tanveer et al., 2017).
External Opb« Terrperatve(*C): TransnkRon (0 to 1):
Lmaoe Enhancement
Fig. 4. FLIR Research IR Max software-window
Рис. 4. Программное обеспечение FLIR Research IR Max
FUR RcworchlR Max*HSDR
Me Edt Camera Mew Took Help Tock
Atmosphere
Atmosphenc T«r<> (*C):
Relative HurrwMy (%): П Trarwwsion (0 to 1):
Thermal Image Analysis
The profile plot of the test specimen, as shown in Fig. 5, indicates an irregular distribution with substantial temperature drops. This uneven distribution is caused by cracking in the coating on the test specimen, which clearly display the difference in radiation emitted from the white paint and unpolished steel. An estimated temperature distribution was created by only using the peak-values in the profile plot. Fig. 6 shows the coated test specimen before and after fracture. The emissivity of the paint was calibrated and found to be 0.95.
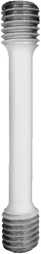
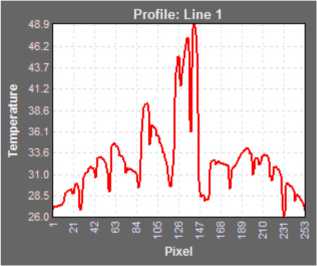
Fig. 5. Irregular distribution thermal distribution
Рис. 5. Неравномерное распределение температуры
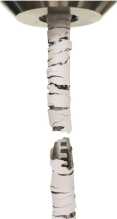

a – before fracture b – after fracture
Fig. 6. DIN 50125 standard steel sample before and after fracture
Рис. 6. Стандартный стальной образец DIN 50125: a – до разрушения; b – после разрушения
Results and Discussion
The heat generation exhibited in the steel specimens in Fig. 7 was not thermally isolated therefore there were thermal loses due to conduction and convection. Nonetheless the thermal images obtained via infrared thermography reflect qualitative visualization of the development of stresses as shown in Fig. 8. This shows the mechanical energy entering the test specimen in form of applied stresses is converted into heat due to internal friction. The steel specimen exhibited the same temperature change throughout the specimen in the initial phase, as the applied stresses were homogeneous. Following, a temperature gradient developed in the specimen, as a result of the non-homogeneous stress due to the plasticity. The first frame illustrates the steel specimen in the start of the tensile test, right before the stress was applied, indicating an approximately equal temperature as its surroundings. The increase in temperature is noticeable for each frame recorded, with the development of a temperature gradient, until the fracture of the specimen.
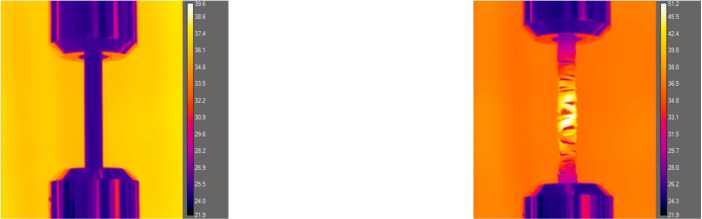
a – start b – end (45s)
Fig. 7. Infrared thermography of DIN 50125 standard steel sample
Рис. 7. ИК-термография стандартного образца стали DIN 50125

Fig. 8. Qualitative visualization of stresses (frame 1–10)
Рис. 8. Визуальное отображение увеличения напряжения (кадры 1–10)
Conclusion
Tensile testing is standard test to study stress – strain behavior of materials. The tests are often used to standardize the materials properties. The only results recording during the tensile testing are the stresses and respective strain. This study has demonstrated that these stresses can be visualized using infrared thermography. In addition, careful monitoring also helps to see the elastic and plastic response of the materials.
