Quality assessment of soil nutrients in the steppe region of the Mongolian plateau

Author: Mаntegeer, Wulantuya, Bao Yuhai
Journal: Природа Внутренней Азии @nature-inner-asia
Article in issue: 4 (19), 2021.
Free access
Characteristics of soil nutrient quality assessment of steppe region in Mongolian Plateau are presented. The research has conducted mainly vertical and horizontal changes in soil fertility quality assessment in Mongolian and Inner Mongolian research areas. The results show that along vertical direction of soil fertility gradually decreased with increasing depth (in the form of 0-5
Soil nutrients quality, steppe zone of mongolian plateau, mongolian sukhbaatar, inner mongolian uzemchin, grey correlation analysis method
Short address: https://sciup.org/148323783
IDR: 148323783 | UDC: 631.421(510:517.3) | DOI: 10.18101/2542-0623-2021-4-92-104
Оценка качества питательных веществ типичных степных почв Монгольского нагорья
В статье представлена детальная характеристика оценки качества питательных веществ в типичных степных почвах Монгольского нагорья. В рамках этой работы были проведены как вертикальные, так и горизонтальные исследования по оценке качества питательных веществ почвы в районе Внутренней Монголии и Монголии. Результаты показывают, что содержание питательных веществ в почве постепенно снижается в вертикальном направлении при увеличении глубины (в форме 0-5
Text of the scientific article Quality assessment of soil nutrients in the steppe region of the Mongolian plateau
Mаntegeer, Wulantuya, Bao Yuhai. Quality Assessment of Soil Nutrients in the Steppe Region of the Mongolian Plateau. Nature of Inner Asia. 2021; 4(19): 92‒104.
Introdution
The region selected for the research is the main part of Mongolia’s elevated steppe zone which connects the two countries (China and Mongolia). The research work has been conducted on the example of Uzemchin, Xilinguole Province, Inner Mongolia, China and Sukhbaatar Province, Mongolia (Figure 1.1). The similar regions were selected as a research region for the comparatively less destructed and destructed state due to different use and soil samples were collected with the purpose of comparing the soil fertilities of this research region, observing the changes in the soil fertility and provide scientific facts for the proper use of soil. Therefore, it is very important to study and evaluate the soil nutrients.
In general, qualitative and quantitative analyses are made for soil assessment. Qualitative analysis assesses any soil properties for relatively good or bad. Use of this method has been reduced now. Quantitative method has been used widely for soil assessment in connection with soil analysis. Quantitative method uses various mathematics based methods, estimates soil elements and assesses soil properties by calculating its general percentage.
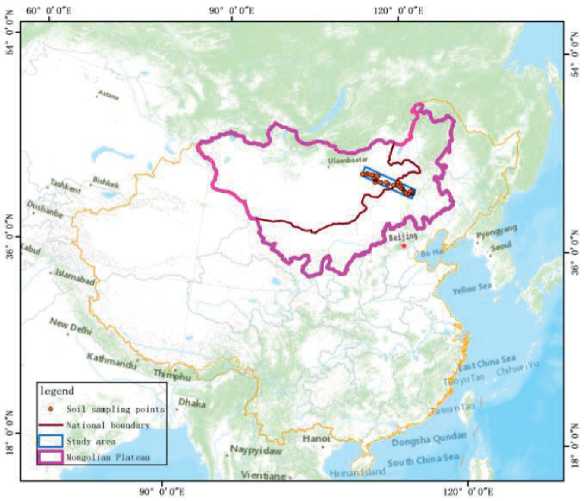
Fig. 1.1 Sketch map of geography location of the study area
Analytic hierarchy process (AHP), artificial neural networks (ANN), set pair analysis (SPA), Generalized assessment method by weird number, GIS and mathematical methods are used for the quantitative method [Tang xuan et al., 2009]. GIS and mathematical method are the most widely used models. GIS and Grey correlation analysis were used for this research work.
Materials and methods
Results of the field surveys conducted in 2015, 2016 and late July and early August 2017 were used for this research work. When obtaining soil samples, the surface area was chosen as a representative area, representing the whole area and the location of the sampling points
Areas with flat surface were selected from the entire region in order to collect soil samples and the locations of sampling are shown in Figure 2.1. During the research, 29 samples were taken from Inner Mongolia, China and 25 samples were collected from Mongolia. Each sample was divided into 0-5, 5-10, and 10 -20 cm at the top layer of soil, taken from each three layers by using the cutting ring and 500 g of soil was kept in each bag оf high quality.
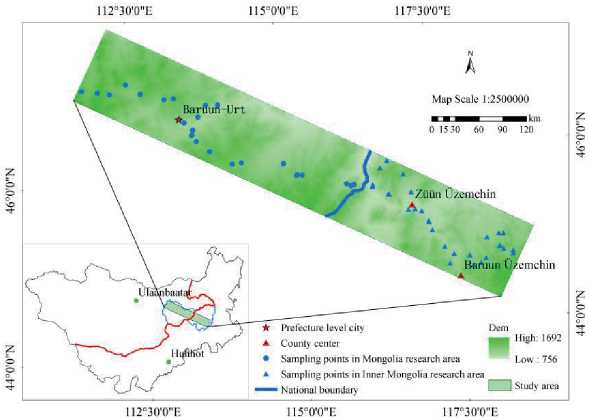
Fig. 2.1 Sketch map of distribution of the sampling sites
The soil samples were analyzed at the soil laboratory of the School of Geography of Inner Mongolian University of Education for the identification of soil organic, phosphorus, potassium, nitrogen, phosphorus mobility, potassium mobility and nitrogen mobility. The method to determine those indicators was based on the Soil agro-chemical analysis book by Shidan Bao (2013).
Statistical data was estimated by using SPSS20 statistics software. The data was compiled with Microsoft Excel software program and general quality sequence of the soil nutrients was developed under the Grey correlation analysis method [Yuerong WU et al., 2008]. Quality assessment mapping of the soil nutrients quality was made by using the Excel2007, Origin9.1 and ArcGis10.3 software.
Grey system theory was developed in 1987 by a Chinese Professor Julong Deng of Huazhong University of Science and Technology (Jianhua XU, 2004). This system theory of the Grey correlation analysis collects all cumulative numerical data with multiple curves. The closer their geometric shapes are and parallel to each other, the more they change and the greater the degree of correlation.
Data closer to the required parameters will be reflected to the assessment indicators of correlation values. The maximum correlation value will be considered as the highest value [Yuerong W. U. et al., 2008]. Therefore, the evaluation parameters will be compared in accordance with the sequence of correlation values. The following formula was used for the calculation:
-
(1) Deletion of the units and sequence of the evaluation parameters
Parameters of the soil nutrients have different meanings. In general, the parameters of soil nutrients differ from each other by numerical sequences and units. Therefore, the units and sequence of the evaluation parameters are deleted by using the formula of average numerical change in order to scientifically solve the problem. Formula for the mean numerical method (2.1):
x'i(t) = x^ (i = 1,2,-,N;t=1,2,-,IM) 2.1
Where, $l = 1№"1^' ; " = 55 M = 7
-
(2) Formula of the Grey correlation analysis method
2.2
2.3
The maximum value of the parameters was selected from the numerical data of the reference indicators. Where, x0(t) = {x0(1),x0(2 ) , ^,x0(M),} and the maximum value is found from the Table 3.1. The formula of the Grey correlation analysis method is used under the following two processes.
Formula of the correlation coefficient of the indicator' t at x0 and xi - 2.2:
,,x _ mtn. i mtn t |x0(t)-xi(t)|+ p m ax i max t|x0(t)-xi(t)|
£t( ) - |x0(t)-xi(t)|+p max i max tlx0(t)-xi(t)l
Where, min i min t|x0(t) — xi (t) | is the minimum value, and max i max t|x0( t ) — xi(t) | is the maximum value. p is grey number at [0,1] , always p = 0.5
Formula of the correlation value (2.3):
rl = 2 t=i £t(t) M
Results
General description of soil nutrients
General description of the soil nutrients is expressed on the example of the elevated steppe region of Mongolia or Uzemchin, Inner Mongolia and Sukhbaatar Province,
Mongolia (Table 3.1). According to this table, variations in the soil nutrients at 0–5, 5–10 and 10–20 cm layers along the vertical direction reduce in the depth of soil. Variations in the horizontal direction and the variations in the soil nutrients from the southeast to the northwest of the steppe region of Mongolia tend to increase.
Table 3.1
Descriptive statistics
|
soil nutrients |
soil depth (cm) |
Uzemchin N=29 |
Sukhbaatar N=25 |
Mean |
Sig. |
||||||||
|
Minimum |
Maximum |
Mean |
Std. Deviation |
coefficient of variation(%) |
Minimum |
Maximum |
Mean |
Std. Deviation |
coefficient of variation(%) |
||||
|
soil organic matter |
0-5 |
14.96 |
68.06 |
30.54 |
12.37 |
40.49 |
20.76 |
98.00 |
39.59 |
15.98 |
40.36 |
35.07 |
0.02 |
|
5-10 |
11.76 |
47.52 |
26.79 |
8.82 |
32.92 |
15.56 |
46.56 |
29.19 |
7.79 |
26.68 |
27.99 |
0.26 |
|
|
(g/kg) |
10-20 |
7.28 |
38.80 |
21.80 |
7.69 |
35.29 |
10.68 |
42.96 |
23.75 |
6.96 |
29.32 |
22.78 |
0.32 |
|
0-20 |
11.33 |
47.92 |
26.38 |
8.55 |
32.42 |
15.67 |
56.50 |
30.84 |
9.13 |
29.59 |
28.61 |
0.06 |
|
|
0-5 |
3.75 |
12.92 |
6.12 |
2.44 |
39.91 |
3.65 |
30.05 |
8.8182 |
5.40443 |
61.29 |
7.47 |
0.02 |
|
|
soil available phosphorus ( mg/kg ) |
5-10 |
2.05 |
5.90 |
3.72 |
0.93 |
25.06 |
2.71 |
16.55 |
4.2290 |
2.76486 |
65.38 |
3.97 |
0.36 |
|
10-20 |
1.96 |
4.65 |
3.34 |
0.69 |
20.77 |
1.71 |
19.40 |
4.5868 |
4.07698 |
88.89 |
3.97 |
0.12 |
|
|
0-20 |
2.59 |
7.21 |
4.39 |
1.10 |
24.93 |
3.05 |
20.90 |
5.88 |
3.59 |
61.07 |
5.14 |
0.05 |
|
|
0-5 |
90.23 |
529.38 |
276.99 |
103.43 |
37.34 |
135.80 |
851.19 |
339.08 |
169.21 |
49.90 |
308.04 |
0.10 |
|
|
soil available potassium |
5-10 |
48.04 |
383.73 |
156.22 |
61.75 |
39.53 |
80.02 |
721.54 |
182.31 |
146.41 |
80.31 |
169.26 |
0.39 |
|
( mg/kg ) |
10-20 |
24.23 |
249.63 |
124.29 |
60.52 |
48.70 |
51.54 |
469.94 |
114.06 |
93.12 |
81.64 |
119.17 |
0.58 |
|
0-20 |
87.47 |
297.17 |
185.83 |
52.97 |
28.50 |
90.96 |
639.77 |
211.82 |
129.59 |
61.18 |
198.82 |
0.33 |
|
|
0-5 |
75.25 |
671.76 |
228.39 |
130.80 |
57.27 |
152.68 |
323.68 |
258.98 |
39.89 |
15.40 |
243.69 |
0.24 |
|
|
soil available nitrogen ( mg/kg ) |
5-10 |
97.72 |
451.72 |
211.72 |
88.70 |
41.89 |
185.06 |
318.49 |
250.61 |
36.43 |
14.54 |
231.17 |
0.04 |
|
10-20 |
83.75 |
718.52 |
195.31 |
121.38 |
62.15 |
93.28 |
497.88 |
235.47 |
75.86 |
32.22 |
215.39 |
0.14 |
|
|
0-20 |
109.07 |
431.47 |
211.81 |
90.97 |
42.95 |
206.11 |
340.64 |
248.35 |
34.49 |
13.89 |
230.08 |
0.05 |
|
|
0-5 |
.23 |
1.56 |
0.62 |
0.27 |
44.11 |
.47 |
3.07 |
1.21 |
0.61 |
50.25 |
0.92 |
0.00 |
|
|
soil total phosphorus (g/kg) |
5-10 |
.20 |
1.16 |
0.57 |
0.26 |
45.27 |
.34 |
3.46 |
0.98 |
0.68 |
68.87 |
0.77 |
0.00 |
|
10-20 |
.17 |
1.17 |
0.54 |
0.27 |
49.79 |
.34 |
2.90 |
0.88 |
0.63 |
71.15 |
0.71 |
0.01 |
|
|
0-20 |
0.25 |
1.25 |
0.58 |
0.25 |
42.89 |
0.40 |
3.14 |
1.02 |
0.62 |
60.04 |
0.80 |
0.00 |
|
|
soil total |
0-5 |
2.82 |
17.33 |
8.33 |
4.17 |
50.11 |
4.18 |
20.94 |
12.46 |
4.03 |
32.37 |
10.40 |
0.00 |
|
potassium |
5-10 |
3.02 |
15.68 |
6.95 |
3.68 |
52.96 |
3.74 |
19.53 |
10.96 |
4.55 |
41.47 |
8.96 |
0.00 |
|
(g/kg) |
10-20 |
1.57 |
23.61 |
7.11 |
5.12 |
72.01 |
2.20 |
20.07 |
9.65 |
4.66 |
48.36 |
8.38 |
0.06 |
|
0-20 |
3.31 |
16.04 |
7.46 |
3.81 |
51.10 |
3.50 |
18.19 |
11.02 |
4.16 |
37.74 |
9.24 |
0.00 |
|
|
0-5 |
.75 |
3.97 |
1.88 |
0.76 |
40.27 |
1.36 |
6.61 |
3.08 |
1.12 |
36.40 |
2.48 |
0.00 |
|
|
soil total nitrogen (g/kg) |
5-10 |
.60 |
2.82 |
1.66 |
0.55 |
33.08 |
1.21 |
3.69 |
2.34 |
0.61 |
26.27 |
2.00 |
0.00 |
|
10-20 |
.42 |
2.52 |
1.30 |
0.52 |
39.87 |
0.55 |
3.21 |
1.85 |
0.56 |
30.32 |
1.57 |
0.00 |
|
|
0-20 |
.62 |
2.75 |
1.61 |
0.53 |
33.02 |
1.04 |
4.10 |
2.42 |
0.68 |
27.99 |
2.02 |
0.00 |
|
Low or high coefficients of variance express the approximate dispersion and average percentage and determine the variances in the research indicators.
Variance is less if CV<10%, is average if 10%≤CV≤100% and is high if CV≥100% [Fangli Shao et al., 2012]. Coefficient of variance in the soil nutrients for this research expresses the mean variance.
According to the variance analysis (ANOVA), organic matter and phosphorus mobility in the soil samples of Uzemchin and Sukhbaatar were different from each other in 0–5 cm upper soil layer (p<0.05) but were same in 5–10 and 10–20 cm layers. Potassium mobility in the soil samples was same in 0–5, 5–10 and 10–20 cm layers. Nitrogen mobility in the soil samples differs in 5–10 and 0–20 cm layers (p<0.05) but was same in 0–5 and 10–20 cm layers.
Total phosphorus, potassium and nitrogen etc indicators in the soil samples were significantly different in 0–5, 5–10 and 10–20 cm layers (p<0.05).
Grey correlation analysis on quality of soil nutrients
Based on the sequence of correlation value for the Grey system theory, quality of the reference parameters is considered as the best in the system. If the correlation value between the evaluation parameters and reference parameters was greater, the quality will be higher and vice versa.
Sequence of the correlation values between the indicators of soil nutrients was estimated by using the Microsoft Excel program and the Grey correlation formula (Table 3.2). The Table 3.2 shows that the sequence of correlation values in the soil samples collected from Sukhbaatar, Mongolia is significantly higher than the soil sampes taken from Uzemchin, Iinner Mongolia. It also shows that the quality of soil nutrients in Sukhbaatar was higher in the soil nutrients in Uzemchin.
Grassland soil quality is rated under the following five degrees [Li Bo, 1997]: the first degree if r ≫ 0.90, the second degree if 0.75 ≪ r < 0.90, the third degree if 0.55 ≪ r < 0.75 , the fourth degree if 0.40 ≪ r < 0.55 and the fifth degree if r < 0.40 [Yuerong W. U. et al., 2008]. The Table 3.3 shows the quality degree of the soil nutrients involved in the research work.
Table 3.2
References Quality assessment of soil nutrients in the steppe region of the Mongolian plateau
- Tat! xuou, Hgodnitdn, JgoOi Lv, Qtgttdn Ytu, LIoui 0-, ZO-uqloo Let, R-dgyiu Lt. ESS-cSs of cooservaiioo tittan- or soil ugSui-dS aoU ornanic carbou soot // Ecology aoU Edvtronu-dSol Sct-uc-s. 2009. No.18(6). P. 2339-2343. [Id COiu-se]
- Xtit- Ygp, Xtog G-, XiUooi Woug. AddttcaStod aoU dronr-ss of soil quality -valgaiiod u-SOoU // Review of COioa AgutcglSural Sct-oc- aoU T-c0ootog9, 2010. No. 12(6). P. 56-61. [It COiu-se]
- Xiugjie ZOoog, Jtdn0gt Ltg, Lijiu Lt, Yikgo Dgao, Z0inodn Wong, SOgnCe Sg. SiiUy or soil wilti-di, utcroornanisu aoU -no9U- aciivi(9 to cods-uvaiiod Stttan- u-(Cons // COid-s-Jogruol of Soil Sct-rce, 2009. No. 40(3). P. 542-546. [Id COiu-se]
- SOiUou Boo. Soil ogio-cO-mical ooot9sts. //B-iiidn: COiuo AnrtcgtSgr- Press, 2013. [Id COid-se]
- Yg-rodn W. S., G-dc0-dn S. S. Addticotiod of Grey S9sS-u T0-or9 So -votgotidn nrosslodU soil qioliSies id NorSC Modnotioo PloSeoi. //Joirdol of Iroer Mongolia Noruot Sniv-rsi(9 (Noiurol Sci-dc- EUiiiou) 2008. No. 37(6). P. 775-779. [Id COid-se]
- JiOio X. S. Mo(C-uo(1co1 u-ICoUs id codi-usoroly nr-nrod0y. B-iiidn, 2004. [Id COid-se]
- Tangli SOoo, Xinxioo Yi, ZOijiou Yoog, Jiodnkgd Z0-dn. TO- R-loiiousOis b-Swe-d sdotiol voriobilily of soil diSri-di ouU -dvironu-diol factors Sot (ysicol aor-sS (yd-s id B-ijidn uoidioid oreo //Joirdol of Assli-U TogdnoSiod ouU Ednid--ridn Sci-dce, 2012. No. 20(4). P. 581-591. [Id COid-se]
- Li Bo. TO- roug-tooU U-nroUoiiod id NoriC COiuo ouU iis sr-v-dSiv- siroiegy // GrosslodU R-s-orcO IdsSiSgn-, 1997. No. 30(6). P. 1-9.
- AvooUorj D. Anrology. Slooobooiou, 2014. [Id Modnolioo]
- Bo(k0is0in O. Soil sros-rlt-s of SO- Eosi-iw Modnoliod si-ss- r-giod // G-oguosOic issies of Modnolio. 2007. P. 11-20. [Id Modnolioo]
- Batkhishig O., Shin Myun Kho. Soil in Khalkha River // Geographic issues of Mongolia, 2011. P. 12-22. [In Mongolian]
