Quality Evaluation of Mobile Networks Using VoIP Applications: A Case Study with Skype and LINE based-on Stationary Tests in Bangkok

Автор: Pongpisit Wuttidittachotti, Therdpong Daengsi
Журнал: International Journal of Computer Network and Information Security(IJCNIS) @ijcnis
Статья в выпуске: 12 vol.7, 2015 года.
Бесплатный доступ
This paper presents the performance evaluation of 3G mobile networks for one kind of multimedia application called Voice over IP (VoIP) within Bangkok, the capital city of Thailand, using Line and Skype, two popular VoIP applications. This study used evaluation of voice quality provided by both applications. The tests have been conducted using stationary scenarios over 5 major 3G mobile networks, served by 5 operators, within 14 universities in the inner city of Bangkok in order to gather data of degraded speech files. Then, the data was measured using Perceptual Evaluation of Speech Quality (PESQ) to find Mean Opinion Score (MOS) before analyzing with ANOVA and T-test, which are statistical tools, so that the discussion and conclusion can be eventually derived.
Mean Opinion Score, Voice over IP, 3G mobile networks, Perceptual Evaluation of Speech Quality, Skype, LINE
Короткий адрес: https://sciup.org/15011480
IDR: 15011480
Текст научной статьи Quality Evaluation of Mobile Networks Using VoIP Applications: A Case Study with Skype and LINE based-on Stationary Tests in Bangkok
Published Online November 2015 in MECS DOI: 10.5815/ijcnis.2015.12.04
Nowadays, mobile networks have become major parts of the telecommunication infrastructure, particularly for fast internet access using High Speed Packet Access (HSPA), Evolved High Speed Packet Access (HSPA+) and Long Term Evolution technology (LTE) [1]. In Thailand, studies have been conducted looking at the impact of 3G mobile network investment on economic growth and investments [2]. Its result shows that 3G mobile network investment dramatically affects Thailand’s economic growth. An increasing amount of investment along with early initiation of the investment could actually boost up the number of mobile phone and wireless internet users, leading to higher employment rate and GDP.
In Thailand, 3G deployment was delayed for about a decade after Japan [3]. The 3G frequency band of 2.1 GHz auction was successfully completed in Oct 2012, before officially launching by AIS, DTAC and TrueMove in May 2013. After 3G mobile networks were officially launched, it has been reported that the number of mobile subscribers reached over 100.2 million numbers in Q3/2014, whereas the Thai population is about 65-66 million people approximately [4].
However, because of high competition in the telecommunication market in Thailand, some 3G mobile operators advertise and present slightly exaggerate claims that their 3G mobile networks are better than other operators. Therefore, in order to know the facts about the performances of each 3G mobile network provided by each operator, it is necessary to evaluate those networks with fairness. Therefore, this independent study has been intensively conducted without hidden agenda or bias about those operators.
To evaluate 3G mobile networks, it is necessary to investigate all areas not only good voice quality but also quality of service for data traffic expected to be received by users from the modern 3G mobile networks. Therefore, VoIP applications, for example LINE and Skype, are interesting options because VoIP technology is the combination of voice communications and data communications. That means VoIP applications can be used to evaluate both voice and data parts of 3G mobile network. Besides, social applications, for example LINE, are very popular for Thai users at present, recently 27 million users approximately (the first is Japan, 52 million users), updated in September 2014 [5].
This paper, which is an applied version of [6-7], has been organized into 5 sections. After this section, background information is presented in Section 2. Section 3 presents methodology about applying Skype and LINE, two popular VoIP applications to evaluate 3G mobile networks in Bangkok, Thailand. Speech samples were been played and captured at the destination end-point before processing for scores of voice quality, called MOS, using PESQ. Eventually, the results were analyzed using ANOVA and t-test in Section 4 before finally presenting conclusion in Section 5.
-
II. Background
This section presents the background information about 3G mobile networks in Thailand, related VoIP applications, quality of service and quality of experience, VoIP quality measurement, hypothesis tests and related research works, as follows:
-
A. Current Mobile Networks in Thailand: 3G
Currently, 3G is the official mobile networks in Thailand whereas 4G is only the trial networks available in a few areas of Bangkok and cities, such as Hua Hin, Pattaya, Phuket and Samui, [8]. 3G mobile network is the standard of mobile networks that use the Universal Mobile Telecommunications System (UMTS) or the International Mobile Telecommunications 2000 (IMT-2000) that was issued by the International Telecommunication Union (ITU) and Third Generation Partnership Project (3GPP) in 2001. The motivation for 3G evolution came from the growing demand for network services such as VoIP, web browsing, video telephony, and video streaming, with constraints on delays and bandwidth requirements [9]. Namely, it is the third generation of mobile networks that can support important features beyond 2G mobile network as shown in Fig. 1 [10]. Fundamentally, 3G topology is a tree topology. As shown in Fig. 2 [6], the 3G network mainly consists of [11-15]:
-
- User Equipment (UE): this is a device used by a user to access network services. The UE is divided into Mobile Equipment (ME), which is manufactured by vendors, and the Universal Subscriber (USIM) that contains, for example, the permanent identity of the user, the shared secret key for authentication Identity Module.
-
- Base Station (BS): it is usually called Node-B. It is connected with the radio network controller and UE. Of course, it has the capability for both transmission and reception. It is responsible for allocating the channel and radio resources to interact with UE. Also, its functions cover error detection and correction, modulation and handover management
-
- Radio Network Controller (RNC): it performs various tasks and controls all radio resources. Each RNC is allocated between the serving GRPS support node and the mobile switching center. It is responsible for call admission control, radio resource management, data transmission, radio bearer setup and release, code allocation, power control, packet scheduling, Radio Network Subsystem (RNS) allocation to handover control, encryption, protocol conversion and ATM switching.
-
- Serving GRPS Support Node (SGSN): it is to support the packet switched network. It is responsible for routing the incoming and outgoing packet data from and to GPRS user via radio access network. Also, it is responsible for user authentication, user location update, data encryption and decryption, establishment,
maintaining, terminating sessions and mobility management procedure for UMTS users.
-
- Gateway GPRS Support Node (GGSN): is the main component to support the packet switched network. It acts as a gateway of external Packet Data Network (PDN) such as the Internet. It is connected with external IP network to route the IP packets. It is responsible dynamically generating IP addresses.
-
- Mobile Switching Center (MSC): it is the primary node within the Circuit Switch (CS) domain, responsible for handing voice call and other circuit switched services. Its main functions are traffic switching (e.g., establishment of traffic parts from PSTN to mobile stations), mobility management (e.g., location registration and handover), and allocation of radio resources.
-
- Gateway Mobile Switching Center (GMSC): It is to provide a gateway to the Public Land Mobile Network (PLMN) in the CS domain. For example, when a call is delivered to the PLMN from another network, the GSMC processes location information, before routing the call to the appropriate MSC where the mobile station is located.
-
- IP Multimedia Substation (IMS): it is one of the most important structural elements of all-IP systems in 3G and beyond. It is used to enhance the basic IP connectivity of UMTS in order to provide IP multimedia services to users. It assures the future of mobile operators, for example, IMS is used as an efficient instrument in the work of combining the new all-IP multimedia features. It becomes possible to provide an almost unlimited range of advanced, interactive multimedia services even for future scenarios.
This has been described in [16], in order to provide higher traffic of packets, 3GPP proposed High Speed Downlink Packet Access (HSDPA) and High Speed Uplink Packet Access (HSUPA) to improve the data rates. HSDPA (defined in 3GPP release 5) and HSUPA (defined in 3GPP release 6) are an evolution of Wideband Code Division Multiple Access technology (WCDMA) [17]. HSUPA scheduling is many-to-one, whereas HSDPA scheduling is a one-to-many [18]. HSUPA increases the practical maximum data rates from 384 kbps of WCDMA uplink to several Mbps in new 3GPP releases. The combination of HSDPA and HSUPA lead to the development of the technology referred to as HSPA or 3.5G informally [19]. However, it has been reported in [17] that, beyond HSPA, 3GPP release 7, called HSPA evolution or HSPA+ release 7, provides major end-user performance and network efficiency improvements to HSPA. For example, VoIP performance over HSUPA is enhanced by minimizing the control overhead with packet bundling operation by aggregating several VoIP packets into one. Evolving HSPA+ standards continued to increase the peak-data rate in 3GPP release 8 to a potential 42 Mbps by combining the advanced
Quadrature Amplitude Modulation, called 64QAM and the Multiple Input and Multiple Output technique called 2x2 MIMO, and will also introduce Dual Carrier operation and further improvements to the User Equipment state transitions and battery life. Beyond 3GPP release 8, the peak-data rate is improved once again by combining existing features in the release 9. In this case, Dual Carrier HSDPA is combined with 2x2 MIMO and 64QAM, resulting in a theoretical peak data rate of 84Mbps. The release 10 standardized enhancements increase the multi-carrier capabilities to utilize up to 20 MHz over two frequency bands by introducing the Four Carrier HSPDA feature, again doubling the potential peak-data rate to 168 Mbps. Another 3GPP release 10 feature worth noting is adding support for MIMO operation with non-MIMO coexistence in HSDPA, minimizing the potential negative performance impact of the introduction of MIMO in the network on legacy non-MIMO user equipment. 3GPP work-items are currently underway for release 11 and 12 with very high performance. Downlink and uplink speed of each release is shown in Table 1 [20].
However, after surveying about 3G speed rate from five 3G network operators in Thailand, it has been found that 3G operators claim the maximum data speed rate of 42 Mbps, which is equivalent to HSPA+ release 8 [21-24].
1G
1st Generation Wireless Network
2G
2nd Generation
Wireless Network
3G
3rd Generation Wireless Network


Speed rate: 2.4 Kbps
Basic voice service Analog-based protocols


Speed rate: 2 Mbps
Fig. 1. Characteristics of 1G, 2G and 3G
Speed rate: 64 Kbps
Designed for voice
Improved coverage and capacity
First digital standards (GSM,
CDMA)
Designed for voice with some data consideration (multimedia, text, internet)
First mobile broadband
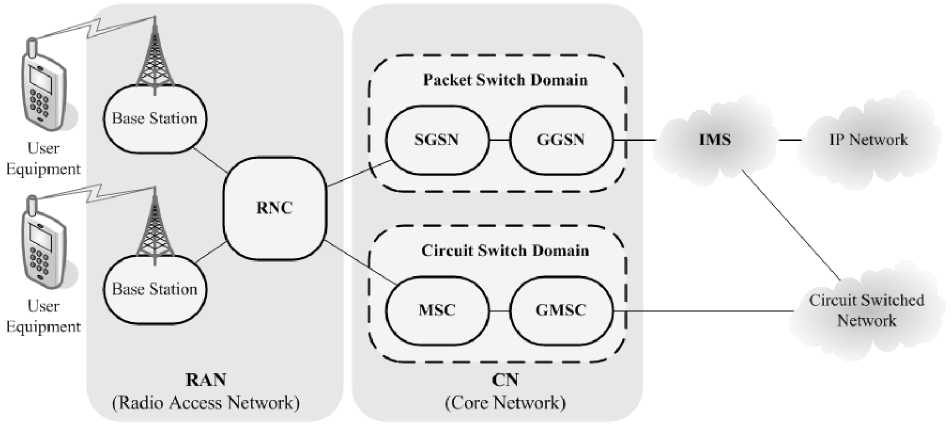
Fig. 2. 3G mobile network overview
Table 1. Characteristics of HSPA and HSPA+ each release
|
Technology |
Downlink Speed (Mbps) |
Downlink Speed (Mbps) |
|
HSPA |
14.4 |
5.7 |
|
HSPA+ release 7 |
21-28 |
5.7 |
|
HSPA+ release 8 |
42 |
5.7 |
|
HSPA+ release 9 |
63-84 |
11.5 |
|
HSPA+ release 10 |
||
|
HSPA+ release 11 |
168-336 |
23-69 |
|
HSPA+ release 12 |
-
B. VoIP Applications: Skype and LINE
Skype is a very popular VoIP application that offers the free call feature for users, whereas LINE is a very popular social application that provides several popular services including sending photos, stickers, instant messages and the free call feature. Background information about Skype and LINE are briefly described as follows:
-
1) Skype: relies on a peer-to-peer (P2P) infrastructure and uses “supernodes” for message relaying and handling metadata such as user profile and presence information [25-26]. Not only suppernodes, Skype nodes also include clients (ordinary nodes), and servers for updates and authentication. An ordinary node with a public IP address, sufficient computing resources and network bandwidth may become a supernode. Supernodes maintain an overlay network, while ordinary nodes establish connections with a small number of supernodes. Authentication servers store the user account information. A Skype client communicates with the authentication server and another ordinary node in an indirect way via supernodes that relay packets. Skype can multiplex different service flows on an established connection: voice calls to another Skype node, video conferencing, chat, file upload and download. As shown in Fig. 3, its voice codec is SILK (version 3). It has been reported that in 2013 users around the world used Skype calls at the level of nearly 40% (214 billion minutes) of
traditional telephone calls (547 billion minutes) [27]. Besides, it has been reported that Skype has about 300 million registered users recently [28].
-
2) LINE: can be defined as a kind of peer-to-peer social applications [29]. It can be install on several platforms of mobile device, e.g. iOS and Android. It uses its proprietary codec. LINE was launched in June 2011after the great disaster in Japan. It took one year to have 50 million users around the world. LINE announced in October 2014 that the number of worldwide users surpassed 560 million users within only about 6 months after having 400 million users in April 2014 [30].
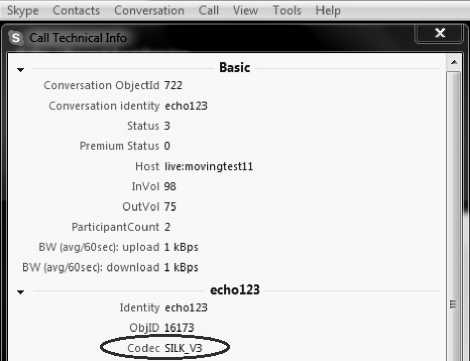
Fig. 3. Call Technical Info captured screen
VoIP Quality of Experience (e.g. MOS)

Application QoS / Application Level (eg. Signal-to-noisc ratio)
System QoS / System Level (e.g. Burst density)


Network QoS / Network Level (e.g. Packet loss, delay and jitter)
(a)
(b)
Fig. 4. Positions of QoE and QoS evaluation for VoIP (a) overview (b) focused on 3G networks.
-
C. Quality of Service and Quality of Experience
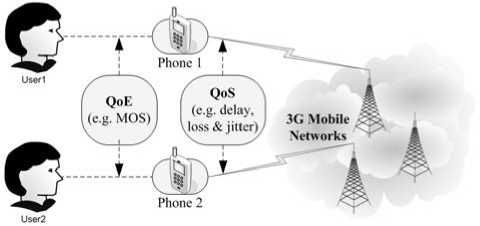
Quality of service (QoS) is an important factor for a heterogeneous network in terms of managing the resource reservation scheme. QoS is effective in improving the overall performance of the network. The term communication arise when data flows between sender and receiver while there is reliable magnitude of packet loss, jitter, delay and data rate for proper guarantees of QoS. It is essential particularly for real time applications such as VoIP and video streaming, [31].
Quality of Experience (QoE) is different from Quality of Service (QoS). It targets the point of view that a user builds after using applications, services, systems, networks and/or products [32]. The International Telecommunication Union – Telecommunication Standardization Sector (ITU-T) defined the definition of
QoS and QoE, as shown in Table 2 [33-35]. QoE is a measure of the overall level of customer satisfaction with a service [36]. Therefore, for VoIP services/applications, QoE is about the point of view of user, as in Fig. 4 [37]. Therefore, it may be described that to measure QoE of VoIP, it must be assessed from user satisfaction subjectively or assessed from the point of view of users with accurate tools.
-
D. VoIP Quality Measurement: PESQ
Basically, to evaluate voice quality, it can be performed using subjective tests with a 5-point scale. Each subject must listen to speech sentences in a controlled environment (e.g. a soundproof room) and rate scores. Then the scores from all subjects in each condition (e.g. 24-30 subjects) are calculated for Mean Opinion Score (MOS). However, there are several issues about limitations to conduct formal subjective voice quality evaluation following ITU-T standard [38], for example, requirement of a lot of subjects or participants with balancing numbers of male and female subjects, at least one sound proof room (e.g. reverberation time is less than 300 ms and the room noise is 30 dBA) and requirement of time and effort.
Therefore, objective – voice quality measurement seems to be a better option to find MOS by using special tools that have been recommended by ITU-T. For objective quality measurement, there are two approaches, consisting of intrusive and non-intrusive quality measurements. For intrusive quality measurements, there are several methods, however, Perceptual Evaluation of Speech Quality (PESQ) is the most popular intrusive quality measurement using full reference algorithm when compared to the others [39]. Its performance is very good. It has been reported that the average correlation between PESQ scores and the subjective scores is > 0.95 [40], which is consistent with the correlation of 0.9433, comparing to subjective MOS, as presented in [41]. As shown its concept in Fig. 5, there are mainly three processes [39]. The first process is signaling preprocessing, which includes input signal frequency and time alignment. Next process is perceptual modeling. This step focuses on the input and output transformation understandable by human representations. The mapping in the time and frequency domain and a signal filtering for the bandwidth typical of the telephone network are also included in this step.
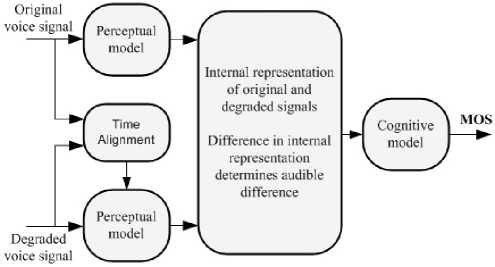
Fig. 5. PESQ measurement method overview
The last process is cognitive modeling. In this step, the values that represent noise computation are evaluated, and then combined to the MOS score calculation. A difference between reference signal and distorted signal is calculated. A positive difference indicates the presence of noise, while a negative difference indicates a minimum noise presence such as codec distortion. This model permits the discovery of time jitter and identification of frames involved and which frames are affected by the delay and erased to prevent a bad score.
The output from PESQ is called MOS-LQO, which is Mean Opinion Score from predicting the voice quality for a listening test using an objective measurement method [42]. It is equivalent to MOS from the subjective listening tests. Based-on a 5-point scale [38-39], if the degraded speech file is very similar to the original speech file, MOS-LQO is high (e.g. over 4.0). If there is high distortion in the degraded speech file, MOS-LQO is low (e.g. lower than 2.5), while MOS of 3.6 is often mentioned as a limit for minimum acceptable quality of voice communication services because it means only some users were dissatisfied, as in Table 3 [43-44]. However, MOS-LQO is inferred to equivalent to MOS-CQE, which is a kind of voice quality metric, called estimated mean opinion score for the conversational situation [44].
Table 2. Comparison of QoS and QoE
|
QoS |
QoE |
|
The collective effect of service performances, which determine the degree of satisfaction of a user of the service. |
The overall acceptability of an application or service, as perceived subjectively by the end-user. However, QoE includes the complete end-to-end system effects, while overall acceptability may be influenced by user expectations and context. |
Table 3. The relation between MOS-CQE and User satisfaction
|
MOS-CQE (lower limit) |
User satisfaction |
|
4.34 |
Very satisfied |
|
4.03 |
Satisfied |
|
3.60* |
Some users dissatisfied |
|
3.10 |
Many users dissatisfied |
|
2.58 |
Nearly all users dissatisfied |
Note: * MOS of 3.6 is used as a general guideline for providing voice communication services with acceptable voice quality
-
E. Hypothesis Tests: ANOVA and t-test
A hypothesis test is a type of statistical inference. It uses the data from a sample to decide between a null hypothesis (H0), which makes a specific claim about the parameters, and an alternative hypothesis (H1), which describes that the null hypothesis is false, for example:
H0: MOS values from all 3G networks are the same
H1: MOS values from all 3G networks are different
It has been described in [37] that it is necessary to determine the p-value from the gathered data in order to accept or reject H0. If the p-value is lower than the significance level, H0 is rejected and H1 is accepted. On the other hand, if the p-value is higher than the significance level (it is 0.05 with 95% confidence interval in general guides), H0 is accepted. Therefore, the significance level is the breakpoint to accept or reject the null hypothesis. Two important statistical tools are ANOVA and t-test. ANOVA is used for multiple comparison, while t-test is used for comparison of two samples. However, for results that show p-value closed to 0.05, either lower or higher, an error might occur. Rejecting the null hypothesis when it is in fact true is called a Type I error (false positive result) or not rejecting the null hypothesis when in fact the alternate hypothesis is true is called a Type II error (false negative result).
-
F. Related Research Works
Related works are classified into three topics, consisting of research on VoIP performance and/or preference provided by social network applications (e.g. Skype), research using PESQ and research on mobile networks (e.g. 3G). For social applications or social network services with VoIP features, not only Skype which has been mainly studied particularly in last decade but also other social applications and services, as follows:
-
1) Lisha and Junzhou [45] reported that VoIP quality of Skype, with the GIPS iSAC codec, is good but no significant difference when compared to MSN Messenger was found.
-
2) Sat and Wah [46] compared VoIP quality of Skype, Google Talk, Windows Live and Yahoo Messenger in four network conditions. It has been observed that in the ideal condition and medium jitters, Yahoo Messenger seems slightly better than other application, whereas Windows Live is more robust to packet losses and high jitters.
-
3) Wu et al. [47] evaluated Skype, Google Talk and MSN Messenger referring to buffer sizes. It has been found that MSN Messenger provides the best performances in terms of buffer dimensioning to suit varying network conditions, whereas Skype does not adjust its buffer size.
-
4) Eröz-Tuğa and Sadler [48] compared the usefulness and practicality of six CMC video chat tools (e.g., CUworld, ICQ, MSN Messenger, Skype, and Yahoo Messenger) from the perspective of language teaching professionals. The analysis results indicate a clear preference for MSN Messenger and Skype.
-
5) Casas et al. [49] studied comparison of YouTube and Facebook, two popular social sites, in mobile networks. It has been found that YouTube QoE is sensitive to downlink-encoding bottlenecks highly, while Facebook is robust to changing network conditions. Unfortunately, this study did not report about voice quality issue.
-
6) Yen et al. [50] compared the two experimental methods – lab experiment vs. crowdsourcing. It has been found that that, for the study of Skype call quality, the crowdsourcing approach stands out in terms of efficiency and user diversity.
-
7) Prokkola et al., [18] study by providing measurements in live 3G/HSPA networks. They compared TCP and UDP goodput performance in different 3G technologies, basic WCDMA, HSDPA-only, and HSPA, while, one-way delay and jitter measurement results are presented in stationary and mobile scenarios. The results show that HSPA provides higher data rates, lower delay, and lower jitter. However, for the drive tests, handovers result in high jitter and interruptions to the communications, which causes VoIP call quality decreasing.
-
8) Chen at al., [51] studied about traffic characteristics of 3G, 4G and WiFi networks by perform measurements of single path transport using TCP over major US mobile wireless networks (both 4G and 3G, including of Verizon, AT&T and Sprint), and characterize them in terms of throughput, packet loss, and round-trip time. Besides, they show that leveraging path diversity under changing environments is a promising solution for more reliable and efficient TCP transfer, and also identify issues in using multipath TCP that can limit performance.
-
9) PCWorld [52] showed the report after comparing 3G/4G wireless speeds among the service providers in 13 cities such as cities--Atlanta, Boston, Chicago, Dallas, Denver, Las Vegas, Los Angeles, New Orleans, New York, San Francisco, San Jose, Seattle, and Washington, D.C.--across USA, in April 2012, it has been found that T-mobile is the best (both downlink and uplink speeds), whereas AT&T is the best for downlink speed and Verizon is the best for uplink speed as shown in Fig. 6 [52].
-
10) OpenSignal [53] reported comparison of US LTE performance in April 2014 that T-Mobile provides the best performance with download speed of 11.5 Mbps. However, there was no comparison of significant difference when compared to other LTE operators.
-
11) In the study of quality assessment in 3G/4G wireless networks by Poncela et al. [54], one of the findings was about the relation between data speeds and MOS. Using 3G mobile networks, MOS was about 3 when the speeds were about 360-384 kbps, whereas MOS was about 2 only when the speeds were only 180 kbps.
-
12) In September 2013, the National Broadcasting and Telecommunications Commission (NBTC) reported the quality of services study in 3G mobile networks in Bangkok using drive tests [55]. According to one of the key performance indicators as shown in Fig. 7 [55], NBTC
concluded that AIS, which is the main player in
Thailand market, provided the best 3G mobile networks at that moment.
-
13) Based on social networking applications, as described in [7], Wuttidittachotti et al. compared two VoIP services provided by, Facebook and LINE [56]. It has been found that LINE tends to provide better quality than Facebook. While Azfar et al. presented an interesting work with ten popular VoIP applications, including Skype, Google Talk, Viber and Tango [57]. It has been discovered that voice traffics may not be encrypted in six of the ten applications. Besides, video
telephony study was presented by Xu et al. [58]. From this work, it has been observed that Google+ and Skype are better than iChat in terms of clock recognition probabilities, particularly bursty loss cases, whereas Google+ shows better performance than Skype in the case of 2-4% busrty losses. Moreover, based-on the same condition, average one-way video delay of Google+ (~ 370 ms) is obviously lower than Skype (~ 790 ms). However, these two works did not consider the performance of networks that may impact voice quality.
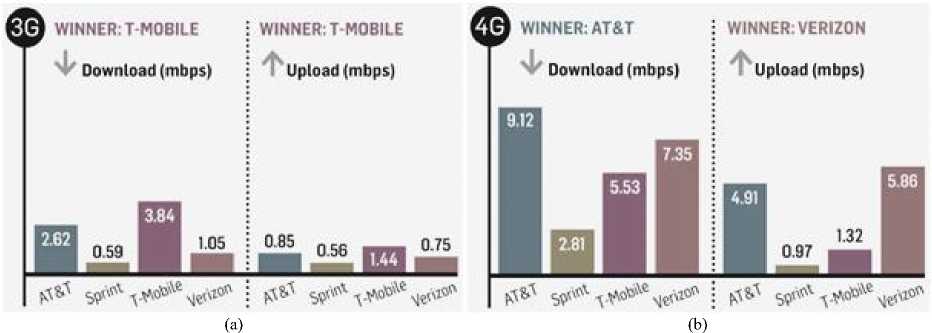
Fig. 6. Comparison of the download /upload speed results over (a) 3G and (b) 4G networks provided by the major operators in USA
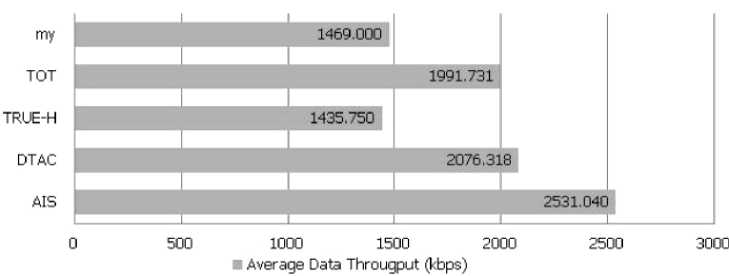
Fig. 7. The throughput result from the drive tests by NBTC, Thailand
-
III. Experiment Design, Data Gathering and PESQ Measuring
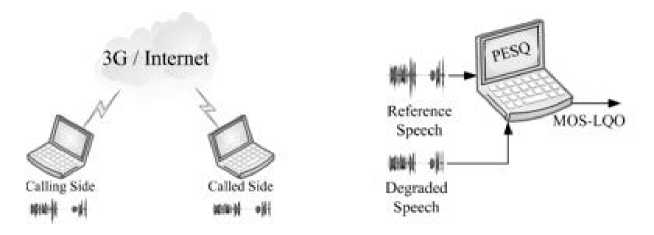
Like the Black box concept, Skype and LINE function as a black box, while each 3G network is the major input and MOS values are the outputs. The experiment was designed to conduct calls from Skype’s and LINE’s free call function on two computers with air cards (they function as User Equipment (UE)), using stationary or static scenarios, excluding mobile scenarios or drive tests [51, 59]. The type of access network is the Radio Network Sub-system (RNS). In order to focus on voice quality, in this experiment, video function was disabled while the experiments were being conducted.
For 3G mobile network operators, there are five major players in Thailand, consisting of AIS, DTAC, TrueMove, TOT and CAT. All 3G mobile networks were connected using air card and SIM cards. Instead of using smart phones, two computers were used because of data gathering techniques.
Because of using PESQ, speech samples were required. The first speech set was selected speech samples from the Thai Speech Set for Telephonometry (TSST) that was developed based-on ITU-T recommendations [61]. The second set was the American English speech samples from the ITU-T website [62].
Within the second half February 2014, fourteen experiments were conducted at 14 universities in Bangkok (see Fig. 8), a day per university. Those universities are as follows:
-
1) Chulalongkorn University (CU)
-
2) Siam University (SU)
-
3) Bansomdejchopraya Rajabhat University (BSRU)
-
4) Suan Sunandha Rajabhat University(SSRU)
-
5) King Mongkut's University of Technology North Bangkok (KMUTNB)
-
6) Srinakharinwirot University (SWU)
-
7) National Institute of Development Administration (NIDA)
-
8) Kasetsart University (KU)
-
9) King Mongkut's University of Technology
Thonburi (KMUTT)
-
10) Assumption University of Thailand (ABAC)
-
11) Rajamangala University of Technology Krungthep (RMUTK)
-
12) Bangkok University (BU)
-
13) Chandrakasem Rajabhat University (CRU)
-
14) University of the Thai Chamber of Commerce (UTCC)
In each day, the experiments were conducted with all 3G mobile networks. Via each network, Skype and LINE were tested with four Thai speech samples (2 male and 2 female) and four American English speech samples (2 male and 2 female). Both computers represent two endusers, communicating within the same base station. While each speech sample was playing at the calling side, the degraded speech was recoding at the destination side at the same time. Nevertheless, before testing with each network, the speed tests were also checked with
After gathering 8 degraded Thai speech samples and 8 degraded English speech samples from each free call from Skype or LINE via each network, both reference and degraded speech samples were measured using PESQ at the VoIP Laboratory (KMUTT), see Fig. 9 [9].
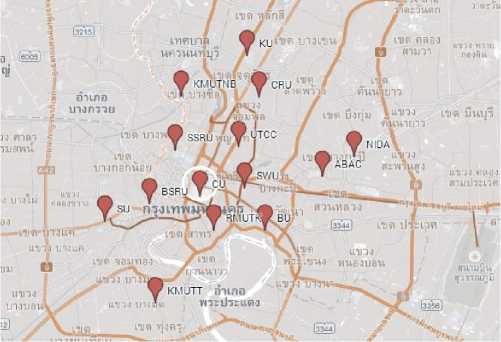
Fig. 8. Top view of University locations for the data gathering in the inner city of Bangkok
-
IV. Results, Analysis and Discussion
-
A. Speed Test Results
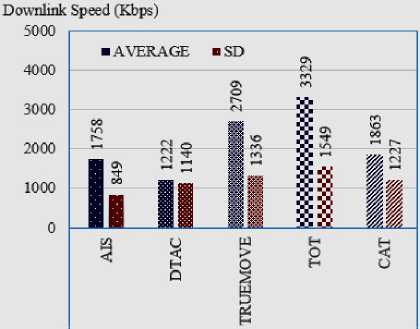
The results were gathered from speed tests of over 120 evaluations per 3G mobile network over 14 days (9:00am – 6:00pm approximately), consisting of downlink and uplink data (totally about 1,300 records). For downlink speeds (see Fig. 10 (a) which is very important for general users, it has been found that TOT provides the maximum downlink speed of Internet at about 3.33 Mbps with standard deviation (SD) of about 1.55 Mbps. Also, it can be obviously seen from Fig. 10(a) that in second place is TrueMove with speeds of over 2.7 Mbps (SD ≈ 1.34 Mbps). The third and fourth place are CAT and AIS with speeds of about 1.86 Mbps (SD ≈ 1.23 Mbps) and 1.76 Mbps (SD ≈ 0.85 Mbps) respectively, whereas the last place is DTAC with speed of 1.22 Mbps (SD ≈ 1.14 Mbps).
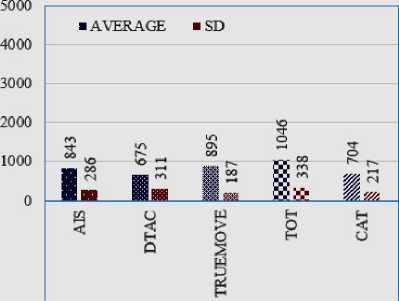
However, for uplink speeds, the results are consistent with the downlink for the first place, the second place and the last place with speeds of about 1.05 Mbps (SD ≈ 338 Kbps) Mbps, 895 Kbps (SD ≈ 187 Kbps ) and 675 Kbps (SD ≈ 311 Kbps) respectively.
Unlike the downlink, as shown in Fig. 10(b), the uplink speed provided by AIS is slightly better than CAT, with speeds of 843 Kbps (SD ≈ 286 Kbps) and 704 Kbps (SD ≈ 216 Kbps). After considering the amount of data from each 3G mobile network, it has been found that TrueMove has the most coverage areas with number of data records (N) =140. That means speed tests can be successfully completed in each university. While AIS and DTAC have less coverage areas with N =126 and 124 respectively.
-
B. VoIP Quality Test Results and Analysis
As shown in Table 4, it can be seen that only TrueMove and CAT can gather data without loss, N = 112, whereas DTAC and AIS have problems about network coverage, particularly when using Skype.
For MOS-LQO, testing LINE with American English speech files is the first condition, DTAC is the best for providing VoIP quality, its MOS-LQO is 3.83. However, in the other conditions, consisting of testing LINE with Thai speech files, Skype with American English speech files, and Skype with Thai speech files, TOT is the best with MOS-LQO of 3.94, 3.83 and 4.05 respectively.
It can be seen obviously in Fig. 11. For the second, it is not easy to identify because TrueMove and CAT are almost the same in every condition. For the last pair, DTAC provides better VoIP quality than AIS when tested with LINE, whereas AIS provides better VoIP quality than DTAC when tested with Skype, both American English and Thai. For standard deviation (SD) of MOS-LQO, it can be observed that LINE seems to provide better stability that Skype. LINE’s SD is 0.40-0.67 but Skype’s SD is about 0.43-0.88. Besides, the lower number of samples from Skype when compared to LINE in the same conditions might be a result of unknown condition of Skype service infrastructure (e.g. the efficiency of supernodes to route calls between originating and answering hosts [25-26], which should be extended to study in the future.
Then, the statistical analysis was conducted for the test condition over 3G mobile networks. To investigate that the best 3G mobile network at the studied period trends to provide better VoIP quality than other 3G mobile networks with significant difference when they are
(a)
(b)
Fig. 9. (a) Overview on the data gathering via VoIP applications over 3G networks (b) The data processing using PESQ
(a)
Uplink Speed (Kbps)
(b)
Fig. 10. Speed test results, consisting of (a) downlink speed results and (b) uplink speed results, where N for AIS, DTAC, TrueMove, TOT and CAT are 126, 124, 140, 130, and 130 respectively.
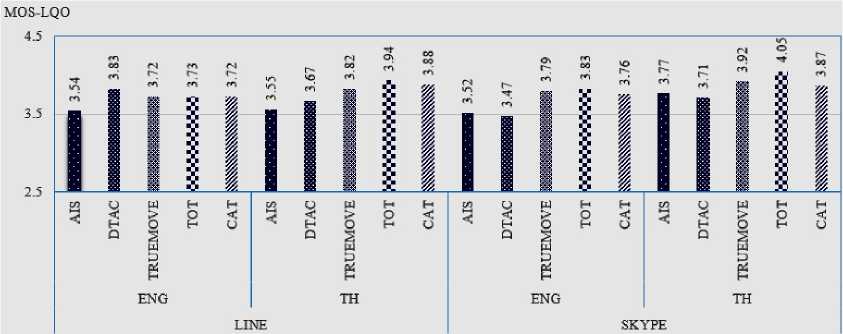
Fig. 11. Graphical MOS-LQO results, as in Table 4
Table 4. Comparison of QoS and QoE, defined by ITU-T
|
LINE |
SKYPE |
|||||||||||||||||||
|
English |
Thai |
English |
Thai |
|||||||||||||||||
|
AIS |
DTAC |
TRUE MOVE |
TOT |
CAT |
AIS |
DTAC |
TRUE MOVE |
TOT |
CAT |
AIS |
DTAC |
TRUE MOVE |
TOT |
CAT |
AIS |
DTAC |
TRUE MOVE |
TOT |
CAT |
|
|
N |
96 |
104 |
112 |
104 |
112 |
96 |
104 |
112 |
104 |
112 |
88 |
98 |
112 |
104 |
112 |
88 |
96 |
112 |
104 |
112 |
|
MOS-LQO |
3.54 |
3.83* |
3.72 |
3.73 |
3.72 |
3.55 |
3.67 |
3.82 |
3.94* |
3.88 |
3.52 |
3.47 |
3.79 |
3.83* |
3.76 |
3.77 |
3.71 |
3.92 |
4.05* |
3.87 |
|
SD |
0.58 |
0.53 |
0.60 |
0.55 |
0.54 |
0.67 |
0.66 |
0.48 |
0.40 |
0.45 |
0.85 |
0.88 |
0.67 |
0.74 |
0.83 |
0.75 |
0.76 |
0.63 |
0.43 |
0.61 |
Note: * = The best result in each condition.
studied using VoIP applications. The raw data of VoIP quality from all 3G mobile networks obtained from PESQ were analyzed using ANOVA and Student’s t-test. From the analyzed results from the test using four conditions, consisting of LINE with English speech and Thai speech, and Skype with English speech and Thai speech, as shown in Table 5, it has been found from H1 using ANOVA that there is significant differences among all 3G mobile networks. Thus, each pair of 3Gmobile networks was investigated deeply to find significant differences.
For H2, which is the comparison between AIS and DTAC, it has been found that only the p-value from the evaluation using LINE with English speech is less than 0.05 (p-value<0.001), while the other three conditions show p-values of >0.05. Therefore, this is evidence that 3G mobile network by DTAC trends to be insignificantly better than the AIS network.
For H3, H4, and H5, they are AIS versus TrueMove, AIS versus TOT and AIS versus CAT respectively, it can be seen that at least 3 conditions from each pair of comparison, for example, from evaluation using LINE with both English and Thai speech, show p-values of <0.05. Thus, it can be claimed that there are significant differences when comparing 3G mobile networks by AIS with TrueMove, TOT and CAT networks.
For H6, which is a comparison between DTAC and True, it has been found that there is no significant deference with tests using LINE but there are significant differences when tested with Skype. However, when comparing DTAC with TOT using H7, it can be claimed that there are significant differences because three fourth conditions show p-values of >0.05. Comparing DTAC with CAT, H8, found significant differences in two conditions, LINE with Thai and Skype with English (p-values <0.5) but there is no significant difference from LINE with English and Skype with Thai (p-values > 0.5). Therefore, H8 might be re-studied in the future.
For H9, H10 and H11, which are TrueMove versus TOT, TrueMove versus CAT and TOT versus CAT respectively, it can be seen that at least 3 conditions from each pair of comparison, for example, from the evaluation using LINE and Skype with English speech, show p-values of >0.05. That means there is no significant difference when comparing 3G mobile networks by TOT with TrueMove and CAT networks. However, from H9, it can be seen that the p-value of 0.049 when tested using LINE with Thai speech. It means this hypothesis is rejected, which might be wrong because of Type I error. Therefore, H9 might be also investigated deeper in the future.
From the hypothesis test results, 3G mobile networks in Bangkok, Thailand can be classified into 2 groups, as shown in Table 6, consisting of the first group; TOT, TrueMove and CAT (MOS ≈ 3.72-4.05), and the second group; DTAC and AIS (MOS ≈ 3.47-3.83). It has been discovered that the second group of 3G mobile networks tends to be less stabile than the first group and also covered the test areas less than the first group.
-
C. Discussion
There are several issues to be discussed in this section as follows:
-
1) For one contribution of this study, it has applied QoE knowledge using VoIP quality evaluation technique to the real world of 3G mobile networks and social applications/networks. Also, it has applied statistical analysis using ANOVA and t-test for deriving conclusions from the experimentation based-on field tests.
-
2) In this study, although speed rates from 3G network operators that have been assessed from the field tests are not parts of network impairment factors for VoIP, it is a clue that might be used for decision making about 3G network selection by users because they can conduct speed tests by themselves easily, instead of finding packet delay, packet loss and jitter. However, according to the maximum data speed rate of 42 Mbps from each operator as mention in Section 2.1, it can be considered that the number of the highest average speed result of about 3.3 Mbps is very low. It is inconsistent with the theoretical speed rate of 42 Mbps from 3G with HSPA+ obviously (over 10 times). Moreover, the highest speed rate from this study is lower than the maximum speed rate from 3G with HSPA that has been used in the first era of 3G about 10 years ago. This might be from the capacity of the access channel provided by each operator and/or depends on business reasons.
-
3) Based-on MOS of 3.6, as shown in Table 3 that is often used as a baseline for minimum acceptable quality of voice communications, it has been found that LINE provides MOS of over 3.6 in most conditions, except testing over AIS 3G network with both Thai and English speech. Whereas, Skype provides MOS over 3.6 in most conditions, except testing with English speech over AIS and DTAC 3G networks.
-
4) From Fig. 9, focusing on the downlink speed from the best to worst, which are TOT (3329 Kbps) TrueMove (2709 Kbps), CAT (1863 Kbps), AIS (1758 Kbps) and DTAC (1222 Kbps). TOT 3G mobile network provides the best download speed even though it has the highest standard deviation (SD=1549 Kbps) that is consistent with the results in Section 4.2, it also tends to provide the best VoIP quality when used with LINE and Skype. However, when compared to TrueMove and CAT, although TOT shows better downlink speed than TrueMove and CAT 3G mobile networks and TrueMove shows better downlink speed than CAT, no significant difference about VoIP quality among these three 3G mobile networks were found (TOT does not tend to provide better VoIP quality than TrueMove and CAT with significant differences, whereas TrueMove does not tend to provide better VoIP quality than CAT with significant differences as well, see H9, H10 and H11 in Table 5).
-
5) From Fig. 11, AIS and DTAC tend to provide 6)
VoIP quality less than TOT, TrueMove and CAT.
It has been found that DTAC 3G mobile network which is the worst in the downlink speed tests (1222 Kbps with SD = 1140 Kbps) provides the highest VoIP quality in one condition (using Line with English speech). It is possible that the LINE’s codec can work efficiently with the DTAC’s QoS policy. Although significant differences were found when comparing DTAC to TOT, there is no significant difference when comparing DTAC to 7)
TrueMove and CAT in some conditions, such as, testing LINE with English speech. For AIS 3G mobile network, its downlink speed seems higher than DTAC significantly while AIS 3G mobile network has the lowest standard deviation (SD = 849 Kbps) but VoIP quality provided by AIS is the worst, which could stem from algorithms or Quality of Service (QoS) policy which handle VoIP applications behind the scene of each network. This finding is inconsistent with the report in Q3 2013 by NBTC [56] that found the best 3G mobile networks is AIS.
Based-on the analyzed results from Table 5, and the classification in Table 6, it might be recommended to Thai users who prefer high VoIP quality from social applications to use Skype over 3G networks provided by TOT, TrueMove or CAT. However, for users who use 3G network service from DTAC that provide the lowest downlink and uplink speed rates, they should use LINE to ensure that they obtain the acceptable level of voice quality with MOS of at least 3.6.
Although the data in this study was intensively gathered from field tests around the inner city of Bangkok, it is necessary to repeat this kind of study every 6 months or every year because each 3G network operator competes with other operators to provide good quality of their 3G network. That means if AIS and DTAC improve or upgrade their 3G systems and networks, their 3G networks might provide better performance than TOT, TrueMove and CAT to support multimedia applications and service, including VoIP from social applications.
Table 5. The tested results of hypotheses of VoIP quality over 3G mobile networks.
|
Hypotheses |
p-value |
Remark |
|||
|
LINE |
Skype |
||||
|
English |
Thai |
English |
Thai |
||
|
H1 0 : MOS-LQOs from all 3G mobile networks are the same H1 1 : MOS-LQOs from all 3G mobile networks are different |
0.009* |
<0.001* |
0.002* |
0.002* |
Significant |
|
H2 0 : MOS-LQOs from AIS and DTAC are the same H2 1 : MOS-LQOs from AIS and DTAC are different |
<0.001* |
0.186 |
0.711 |
0.567 |
|
|
H3 0 : MOS-LQOs from AIS and TrueMove are the same H3 1 : MOS-LQOs from AIS and TrueMove are different |
0.028* |
0.001* |
0.016* |
0.143 |
Significant |
|
H4 0 : MOS-LQOs from AIS and TOT are the same H4 1 : MOS-LQOs from AIS and TOT are different |
0.017* |
<0.001* |
0.008* |
0.002* |
Significant |
|
H5 0 : MOS-LQOs from AIS and CAT are the same H5 1 : MOS-LQOs from AIS and CAT are different |
0.023* |
<0.001* |
0.042* |
0.341 |
Significant |
|
H6 0 : MOS-LQOs from DTAC and TrueMove are the same H6 1 : MOS-LQOs from DTAC and TrueMove are different |
0.171 |
0.071 |
0.004* |
0.032* |
Insignificant for LINE Significant for Skype |
|
H7 0 : MOS-LQOs from DTAC and TOT are the same H7 1 : MOS-LQOs from DTAC and TOT are different |
0.204 |
0.001 |
0.002 |
<0.001 |
Significant |
|
H8 0 : MOS-LQOs from DTAC and CAT are the same H8 1 : MOS-LQOs from DTAC and CAT are different |
0.140 |
0.008* |
0.015* |
0.103 |
Require more investigation |
|
H90: MOS-LQOs from TrueMove and TOT are the same H91: MOS-LQOs from TrueMove and TOT are different |
0.893 |
0.049* |
0.655 |
0.064 |
|
|
H10 0 : MOS-LQOs from TrueMove and CAT are the same H10 1 : MOS-LQOs from TrueMove and CAT are different |
0.979 |
0.299 |
0.821 |
0.522 |
|
|
H11 0 : MOS-LQOs from TOT and CAT are the same H11 1 : MOS-LQOs from TOT and CAT are different |
0.865 |
0.348 |
0.539 |
0.008* |
|
Note: * = Significant at p-value < 0.05 with 95% confidential interval
Table 6. Classifications of 3G mobile networks based on the results in Table 5
|
Group |
3G Network |
MOS |
|
|
LINE |
Skype |
||
|
1 |
TOT, TrueMove and CAT |
3.72 - 3.94 |
3.76 - 4.05 |
|
2 |
AIS and DTAC |
3.54 - 3.83 |
3.47-3.77 |
-
V. Conclusion and Future Work
This paper presents the alternative method to evaluate 3G network using a voice quality evaluation technique that is a part of QoE evaluation. Of course, the result from this kind of study is useful for 3G consumers or users in Thailand because the data has been gathered from field tests that are real so that they can choose an appropriate 3G network for their usage, whereas the regulator in Thailand may only consider 3G network quality control. Thus, this study can be an example for 3G network evaluation using QoE concept in other countries. After intensively gathering a lot of speech files, over 2,000 degraded files, using field tests around the inner city of Bangkok and then processing by PESQ to obtain VoIP quality values called MOS-LQO, which could be applied as a key performance index for 3G mobile network performance evaluation, it has been found that the TOT 3G mobile network tends to provide better performance than other 3G mobile networks, particularly when tested with VoIP applications and realtime applications. The TOT 3G mobile network is slightly better than TrueMove, whereas TrueMove is slightly better than CAT, which is consistent with the speed test result. However, when analyzed using t-test, it has been found that there was no significant difference among the three of them. When comparing TOT, TrueMove and CAT to AIS and DTAC, it has been found that the first group tends to provide better VoIP quality than the second group with significant differences.
This study focused on the part of voice only, video telephony using the same applications and others should be conducted as future work, to investigate deeper the performance of those 3G mobile networks to support IP multimedia applications and services. Moreover, QoS evaluation, mobility characteristics (e.g. handovers and usages on high speed vehicles) and important factors (e.g. smart phone antenna gain and smart phone computation resources) should be considered in the future works. Furthermore, 4G/LTE technology that will used in Thailand within few years (the auction is going to be conducted by the end of 2015), will also be considered for study. Besides, this study should be repeated at least once a year, due to development and improvement of each 3G mobile network and operator.
Acknowledgment
Thank you to the reviewers for very useful comments. Thank you pto Worawat Akapan, our old Student in IT Faculty, KMUTNB for all data/ Thank you to the Speech and Audio Laboratory, NECTEC for TSST, the VoIP Laboratory, School of Information Technology (SIT), KMUTT for PESQ measurement tool, particularly two SIT members, Dr. Tuul Triyason and Asst. Prof. Dr. Vajirasak Vanijja. Finally, special thanks to Mr. Gary Sherriff for editing.
Список литературы Quality Evaluation of Mobile Networks Using VoIP Applications: A Case Study with Skype and LINE based-on Stationary Tests in Bangkok
- A. Zieliński and K. Zielińsk, "Mobile Telecommunication Systems Changed the Electronic Communications and ICT Market", J. Telecommun. Inf. Technol., vol. 2013, no. 2, pp. 5-13, 2013.
- P. Sereewiwatthana, A. Nittayagasetwat and K. Panyagometh, "3G and Economic Impact: A Case of Thailand", NIDA Bus. Admin. J., vol. 9, pp. 5-21, 2011 (ไพบูลย์ เสรีวิวัฒนา, เอกชัย นิตยาเกษตรวัฒน์ และ กำพล ปัญญาโกเมศม, "3G และผลกระทบต่อเศรษฐกิจไทย", วารสารบริหารธุรกิจ นิด้า., เล่มที่ 9, หน้า 5-21, 2011).
- S. Malisuwan, T. Orada, M. Navneet, S. Jesada, and K. Wassana, "Analysis of Mobile Spectrum Management in Thailand to Move Towards a Knowledge Based Economy: A Regulatory Review", J. Adv. Manage. Sci., vol 1, no. 3, pp. 288-298, 2013. DOI: 10.12720/joams.1.3.288-298.
- NBTC, "Report of Telecoms Market Status", Q3/2014 (รายงานสภาพตลาดโทรคมนาคม ไตรมาสที่ 3 ปี 2557).
- http://www.techinasia.com/line-releases-regional-breakdowns-for-its-490m-registered-users/.
- P. Wuttidittachotti and T. Daengsi, "QoE of social network applications: A study of VoIP quality from Skype vs LINE over 3G and 4G", Proc. 7th ICUFN 2015, Sapporo, Japan, pp. 462-464, Jul. 2015. DOI: 10.1109/ICUFN.2015.7182586.
- P. Wuttidittachotti, W. Akapan, and T. Daengsi, "Comparison of VoIP-QoE from Skype, LINE, Tango and Viber over 3G networks in Thailand", Proc. 7th ICUFN 2015, Sapporo, Japan, pp. 456-461, Jul. 2015. DOI: 10.1109/ICUFN.2015.7182585.
- http://truemoveh.truecorp.co.th/change/network_en.php (Accessed Sep. 14, 2015).
- S.M. Chadchan and C.B. Akki, "A Fair Downlink Scheduling Algorithm for 3GPP LTE Networks",Int. J. Comput. Network. Inf. Secur., vol.5, no.6, pp.34-41,2013. DOI: 10.5815/ijcnis.2013.06.05.
- http://www.oopsmobile.net/wp-content/uploads/2013/09/Evolution-of-the-G.jpg.
- S. Kasera, and N. Narang, 3G Networks, Tata McGraw-Hill Education, 2004.
- A.O. Samuel, "Evaluation of Video Quality of Service in 3G/UMTS Wireless Networks as Succor for B3G/4G Wireless Network", Master Thesis in Electrical Engineering, Bleking Institute of Technology, 2010.
- J.L. Burbank, J. Andrusenko, J.S. Everett, W.T.M. Kasch, Wireless Networking: Understanding Internetworking Challenges, John Wiley and Sons, Inc., 2013.
- M.Z. Shafiq, J. Lusheng, A.X. Liu, and J. Pang, "Characterizing Geospatial Dynamics of Application Usage in a 3G Cellular Data Network", Proc. IEEE INFOCOM, Orlando, FL, pp. 1341-1349, Mar. 2012. DOI: 10.1109/INFCOM.2012.6195497.
- L. Boker, Z. Kanizsai and G. Jeney, "IMS-centric Evaluation of IPv4/IPv6 Transition Methods in 3G UMTS Systems", Int. J. Adv. Networks. Serv., vol. 3, pp. 402-416, 2010.
- Y.-B. Lin et al., "Performance measurements of TD-LTE, WiMax and 3G systems", IEEE Wirel Commun., vol. 20, pp. 153-160. 2013. DOI: 10.1109/MWC.2013.6549295.
- 4G Americas, "The Evolution of HSPA: The 3GPP standards progress for fast mobile broadband using HSPA+," White Paper, Oct. 2011.
- J. Prokkola, P.H.J. Perala, M. Hanski and E. Piri, "3G/HSPA Performance in Live Networks from the End User Perspective", Proc. IEEE ICC 2009, Dresden, Germany, pp. 1-6, Jun. 2009. DOI: 10.1109/ICC.2009.5198575.
- I.F. Akyildiz , D. M. Gutierrez-Estevez , E.C. Reyes, "The evolution to 4G cellular systems: LTE-Advanced," Phys. Commun., vol. 3, no. 4, p.217-244, Dec. 2010. DOI: 10.1016/j.phycom.2010.08.001.
- Qualcomm, "HSPA+ Evolution: Building upon the solid foundation" Aug. 2014.
- http://investor.ais.co.th/FileUpload/Editor/DocumentUpload/WebContent/56-1/56-1%202013.pdf (Accessed Sep. 14, 2015).
- http://www.dtac.co.th/postpaid/products/addon-internet.html (Accessed Sep. 14, 2015).
- http://truemoveh.truecorp.co.th/why/entry/51 (Accessed Sep. 14, 2015).
- http://www.mybycat.com/about.php?id=31 (Accessed Sep. 14, 2015).
- B. Trammell, E. Boschi, G. Procissi, C. Callegari, P. Dorfinger, and D. Schatzmann, "Identifying Skype traffic in a large-scale flow data repository", Proc. 3rd COST TMA International Workshop on Traffic Monitoring and Analysis (TMA 2011), Vienna, Austria, Apr 2011. DOI: 10.1007/978-3-642-20305-3_7.
- M. Korczynski, and A. Duda," Classifying Service Flows in the Encrypted Skype Traffic," Proc. IEEE ICC 2012, Ottawa, Canada, pp. 11064-1068, Jun. 2012. DOI: 10.1109/ICC.2012.6364024.
- http://it-nigeria.com/wp-content/uploads/2014/05/Skype-statistics-2013.png (Accessed Sep. 14, 2015).
- http://blogs.skype.com/2013/08/28/skype-celebrates-a-decade-of-meaningful-conversations/ (Accessed Sep. 14, 2015).
- S.-W. Hsieh and M.-P. Wu, "Exploring Learning Performance toward Cognitive Approaches of a Virtual Companion System in LINE app for m-learning", Eurasia J. Math. Sci. Technol. Educ., vol. 9(4), pp. 337-346, 2013. DOI: 10.12973/eurasia.2013.943a.
- http://www.statista.com/statistics/250926/number-of-registered-line-app-users/ (Accessed: Sep. 14, 2015) .
- Al-Imran and A.O. Samuel, "Evaluation of Video Quality of Service in 3G/UMTS Wireless Networks as Succor for B3G/4G Wireless Network", Master Thesis, School of Computing, Blekinge Institute of Technology, Sep. 2010.
- S. Zainab, M. Jannisar and A. Javed,"Improving Quality of Perception (QoP), Quality of Experience (QoE), and Quality of Service (QoS) in agile development using Cleanroom Software Engineering (CSE)", Int. J. Mod. Educ. Comput. Sci., vol.6, no.10, pp.49-56, 2014. DOI: 10.5815/ijmecs.2014.10.07.
- ITU-T Recommendation G.1000. Communications quality of service: A framework and definitions. November, 2001
- ITU-T Recommendation E.800. Terms and definitions related to quality of service and network performance including dependability. August, 1994.
- ITU-T Recommendation P.10/G.100. Vocabulary for performance and quality of service, Amendment 1 - New Appendix I- Definition of Quality of Experience (QoE). January, 2007.
- ITU.T Recommendation P.800. Methods for subjective determination of transmission quality. August, 1996.
- T. Daengsi, "VoIP Quality Measurement: Recommendation of MOS and Enhanced Objective Measurement Method for Standard Thai Spoken Language", Ph.D. Thesis, Faculty of Information Technology, KMUTNB, Nov. 2012.
- M. Langer, "Quality Management in 4G Wireless Networking Technology Allows to Attend High-Quality Users", J. Telecommunications and Information Technology, vol. 2013, No.3, pp. 48-55, 2013.
- M. Voznak and J. Rozhon, "Influence of Atmospheric Parameters on Speech Quality in GSM/UMTS", Int. J. Math. Model. Method. Appl. Sci., vol. 6(4), pp. 575-582, 2012.
- Ditech Networls, "Limitations of PESQ for Measuring Voice Quality in Mobile and VoIP Networks", White paper, Dec 2007.
- M. Goudarzi, L. Sun, and E. Ifeachor, "PESQ and 3SQM measurement of voice quality over live 3G networks," MESAQIN'09, Czech Republic, Jun. 2009.
- ITU-T Recommendation P.800.1. Mean Opinion Score (MOS) terminology. July, 1996.
- T. Ulseth, and F. Stafsnes, "VoIP speech quality – Better than PSTN?" Telektronikk, pp. 119-132, 2006.
- ITU-T Recommendation G.107, "The E-model: a computational model for use in transmission planning," 2011.
- G. Lisha and L. Junzhou, "Performance Analysis of a P2P-Based VoIP Software", Proc. AICT/ICIW 2006, San Jose, CA, pp. 11, Feb. 2006. DOI: 10.1109/AICT-ICIW.2006.147.
- B. Sat and B. W. Wah, "Evaluation of Conversational Voice Communication Quality of the Skype, Google-Talk, Windows Live, and Yahoo Messenger VoIP Systems", Proc. IEEE 9th MMSP 2007, Crete, Greece, pp. 135-138, Oct. 2007. DOI: 10.1109/MMSP.2007.4412836.
- C.-C. Wu, K.T. Chen, C.-Y. Huang, and C.-L. Lei, "An Empirical Evaluation of VoIP Playout Buffer Dimensioning in Skype, Google Talk, and MSN Messenger", Proc. NOSSDAV, Williamsburg, VA, pp. 97-102, Jun. 2009. DOI: 10.1145/1542245.1542268.
- B. Eröz-Tuğa and R. Sadler, "Comparing six video chat tools: A critical evaluation by language teachers", Comput. Educ., vol. 53(3), pp. 787-798, 2009. DOI: 10.1016/j.compedu.2009.04.017.
- P. Casas, A. Sackl, S. Egger, and R. Schatz, "YouTube & Facebook Quality of Experience in Mobile Broadband Networks", Proc. IEEE Globecom Workshops, Anaheim, CA, pp. 1269-1274, Dec. 2012. DOI: 10.1109/GLOCOMW.2012.6477764.
- Y.-C. Yen et al., "Lab experiment vs. crowdsourcing: a comparative user study on Skype call quality", Proc. AINTEC'13, Chiang Mai, Thailand, pp. 65-72, Nov. 2013. DOI: 10.1145/2534142.2534151.
- Y.-C. Chen, "Measuring Cellular Networks: Characterizing 3G, 4G, and Path Diversity", Presented in Annual Conference of ITA 2012, Southampton, UK, Sep. 2012. Retrieved from: http://people.cs.umass.edu/~yungchih/publication/12_mtcp_4g_tech_report.pdf (Accessed Sep. 14, 2015).
- http://www.pcworld.com/article/253808/3g_and_4g_wireless_speed_showdown_which_networks _are_fastest_.html (Accessed: Sep. 14, 2015) .
- http://opensignal.com/reports/state-of-lte/usa-q1-2014/ (Accessed: Sep. 14, 2015) .
- J. Poncela et al. "Quality Assessment in 3G/4G Wireless Networks", Wireless Personal Communications, vol. 76, pp. 363-377, 2014. DOI: 10.1007/s11277-014-1711-5.
- NBTC, "Results of Quality of Service Measurement from Mobile Networks", Field Survey Report, Sep. 2013.
- P. Wuttidittachotti, K. Yochanang, N. Chumkot, T. Triyason and T. Daengsi, "Quality of Experience of VoIP for Social Network Services: Facebook vs LINE over 3G Networks in North Bangkok", Proc. 11th ECTI-CON 2014, Nakhon Ratchasima, Thailand, pp. 1-6, May. 2014. DOI: 10.1109/ECTICon.2014.6839876.
- A. Azfar, K.-K.R. Choo, L. Liu, "A study of ten popular Android mobile VoIP applications: Are the communications encrypted?" Proc. 47th Hawaii Int. Conf. System Sciences (HICSS) 2014, Waikoloa, HI, pp. 4858-4867, Jan. 2014. DOI: 10.1109/HICSS.2014.596.
- Y. Xu, C. Yu, J. Li and Y. Liu, "Video Telephony for End-consumers: Measurement Study of Google+, iChat, and Skype," IEEE/ACM Trans. Networking, vol. 22(3), pp. 826-839, 2014. DOI: 10.1109/TNET.2013.2260354.
- K. Jang et al., "3G and 3.5G wireless network performance measured from moving cars and high-speed trains", Proc. 1st ACM workshop on Mobile internet through cellular networks (MICNET'09), Beijing, China, pp. 19-24, Sep. 2009. DOI: 10.1145/1614255.1614261
- T. Daengsi et al., "The Development of a Thai Speech Set for Telephonometry", Proc. Oriental COCOSDA 2010, Kathmandu, Nepal, paper no. 53, Nov. 2010.
- https://www.itu.int/net/itu-t/sigdb/genaudio/AudioForm-g.aspx?val=10000501 (Accessed Sep. 14, 2015).
